

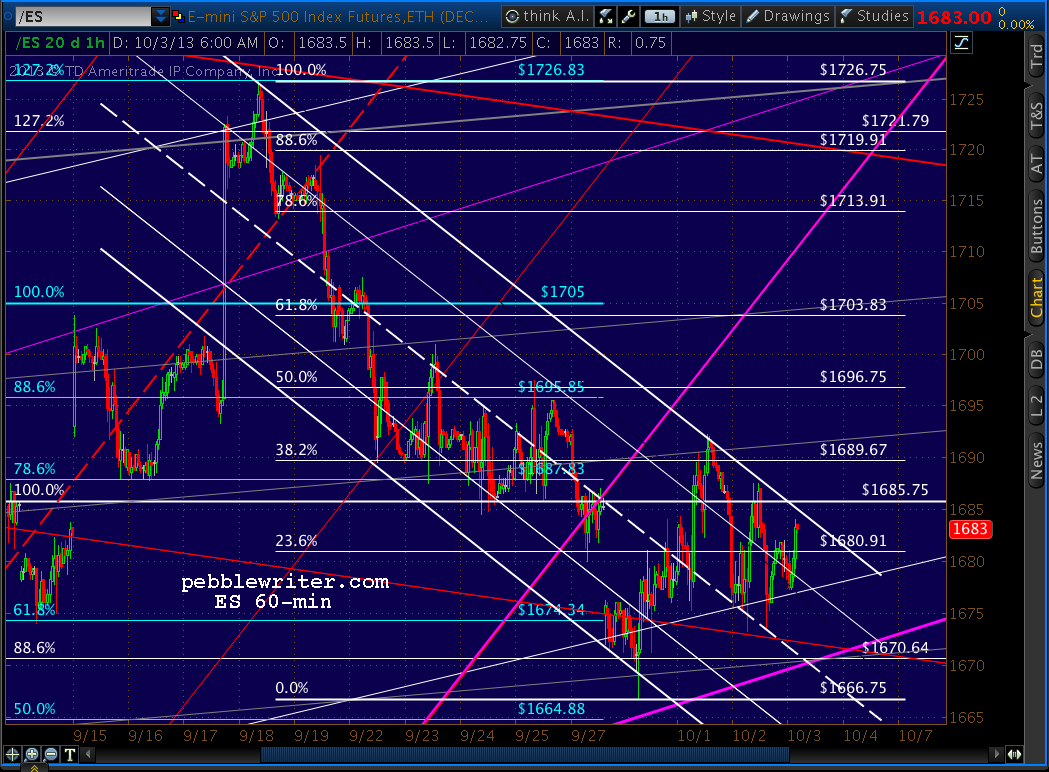
After an overnight dip, S&P 500 futures are back to slightly positive at an expanded channel top.
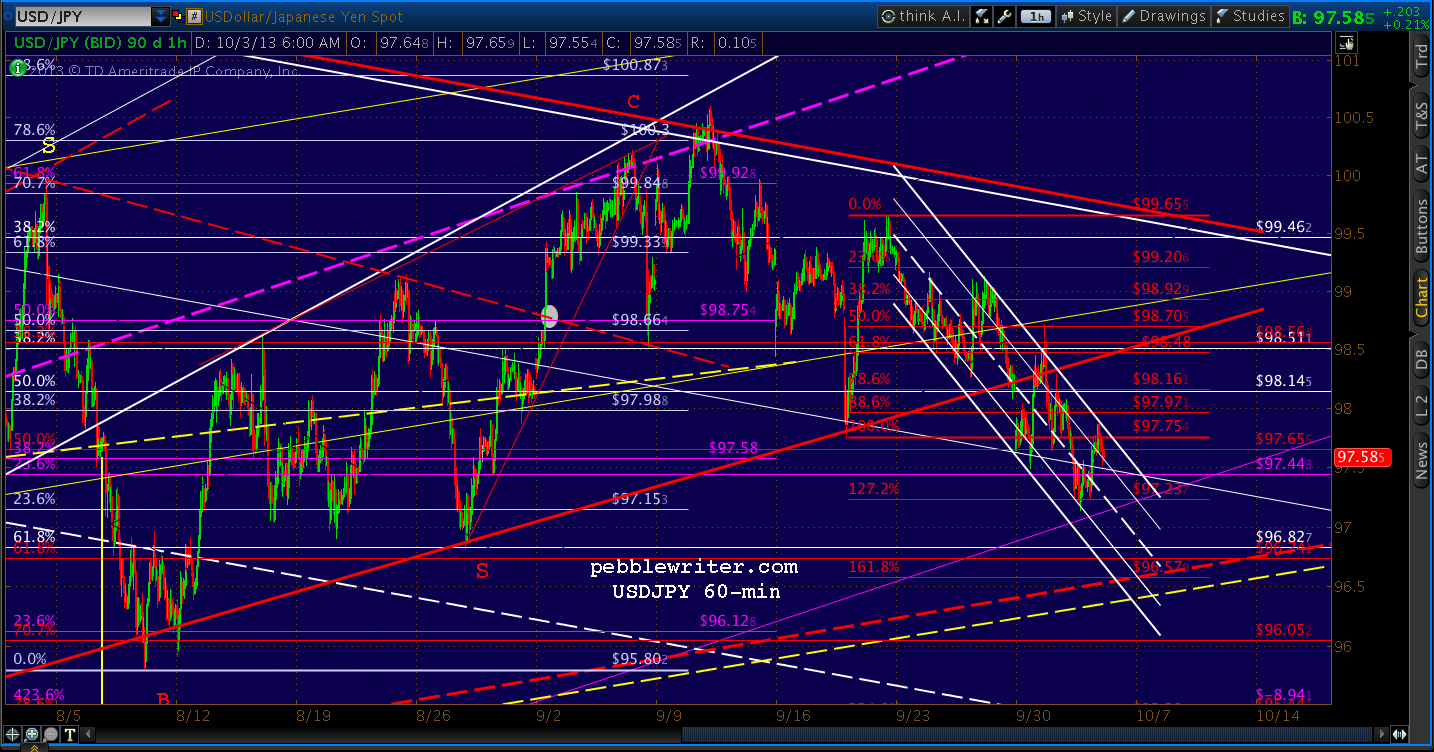
 USDJPY continues toward our Fib targets…
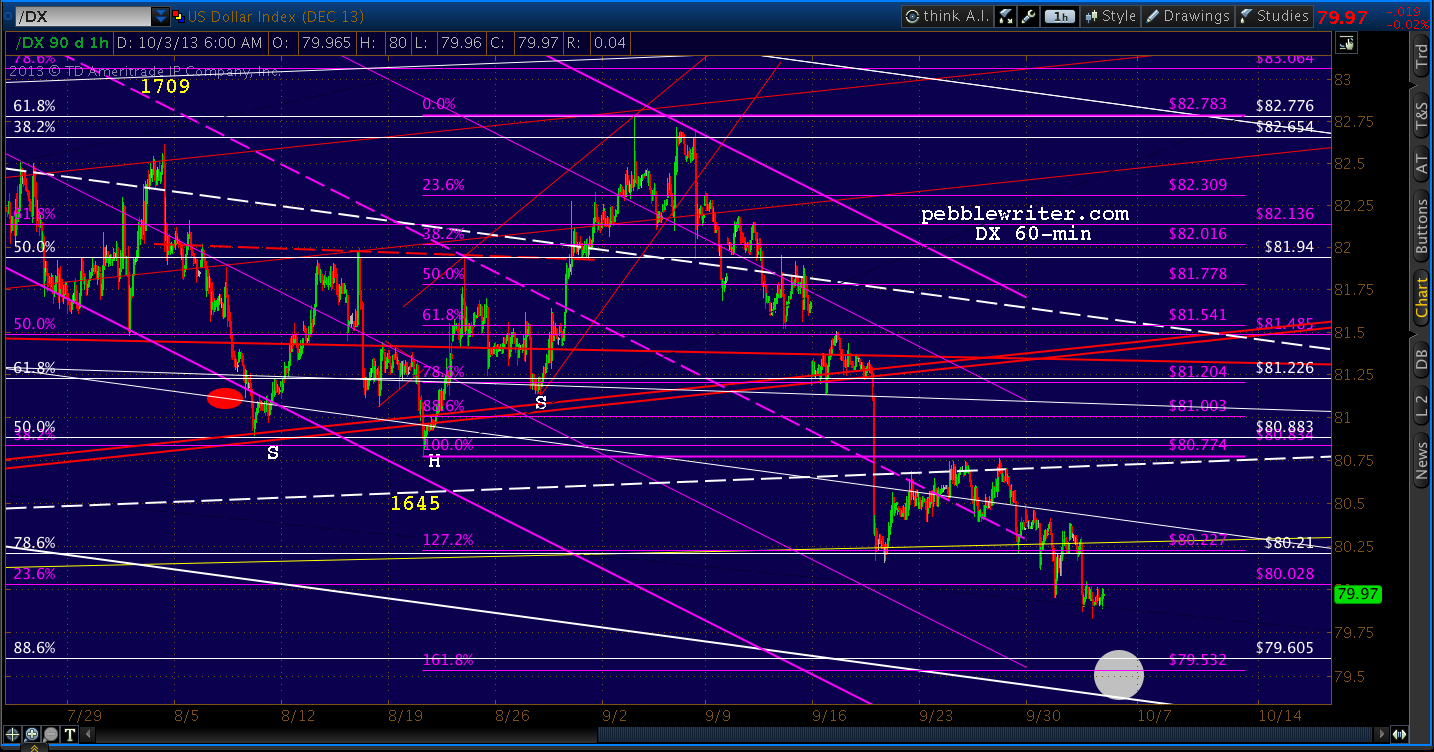
 And, DX is consolidating just below 80 on its way to our initial target.
UPDATE:10:25 AM
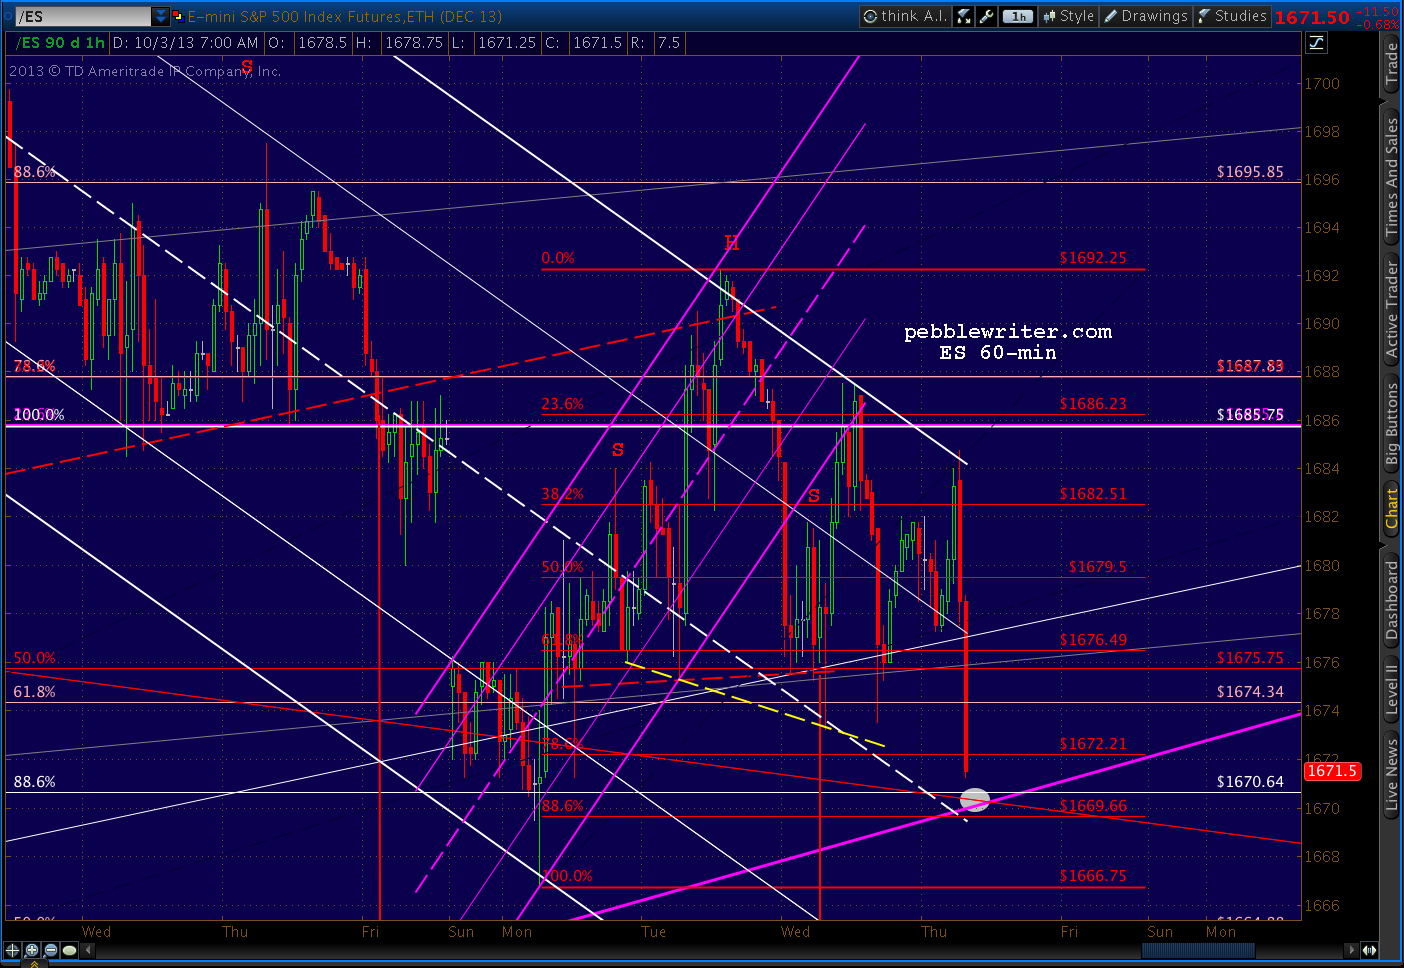
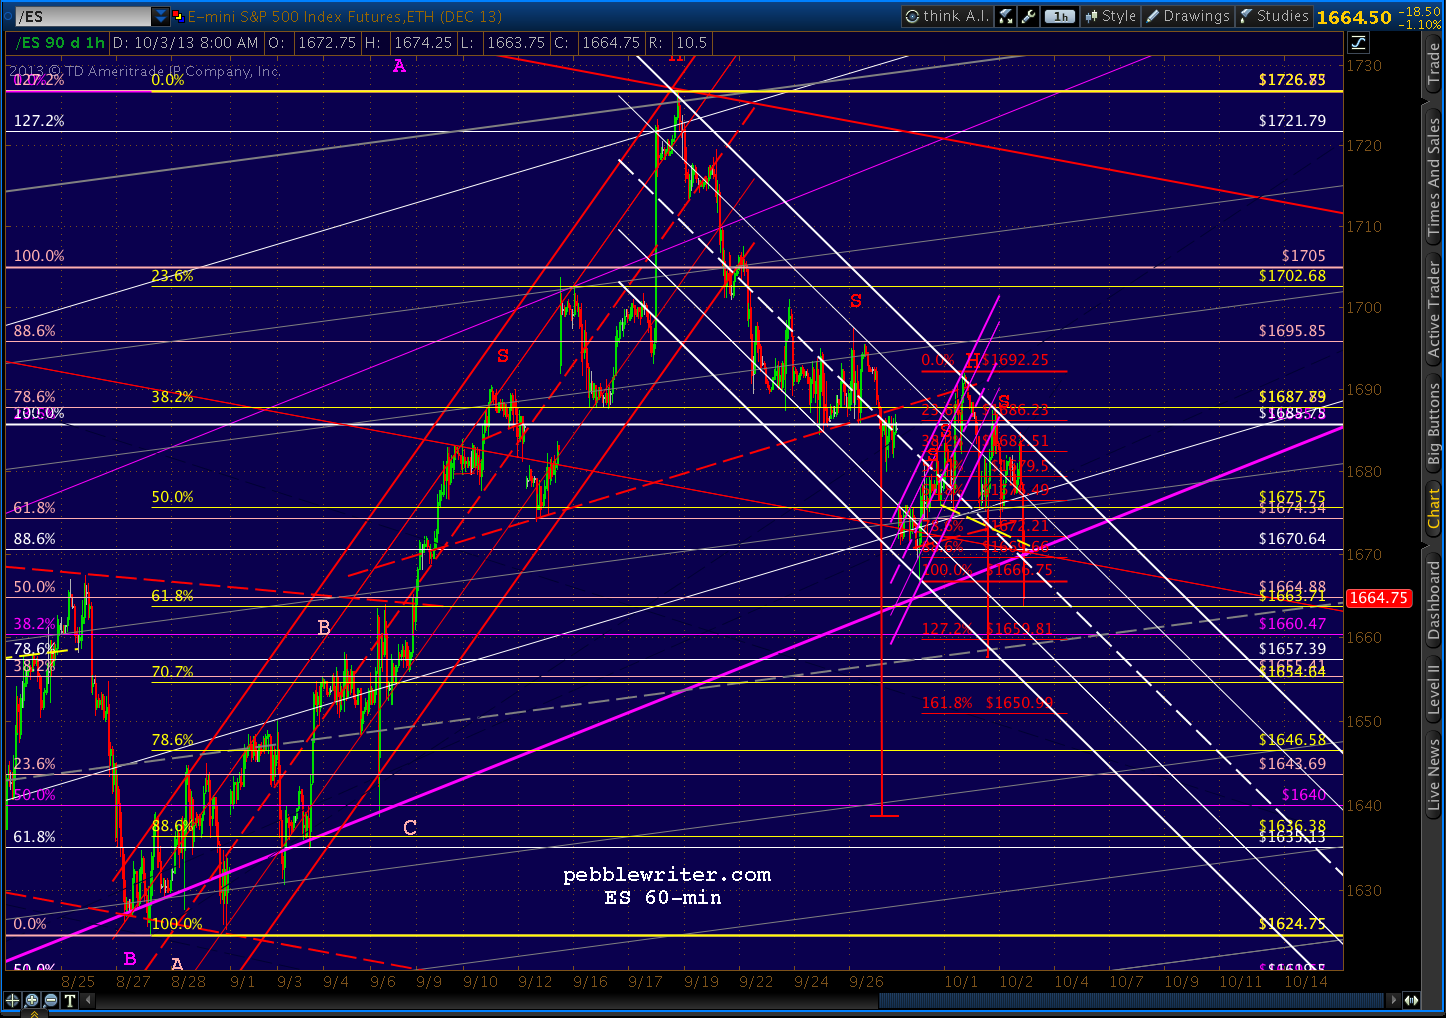
Awfully close to a bounce at ES 1670/SPX 1677.45. But, the following move might fool a lot of traders.
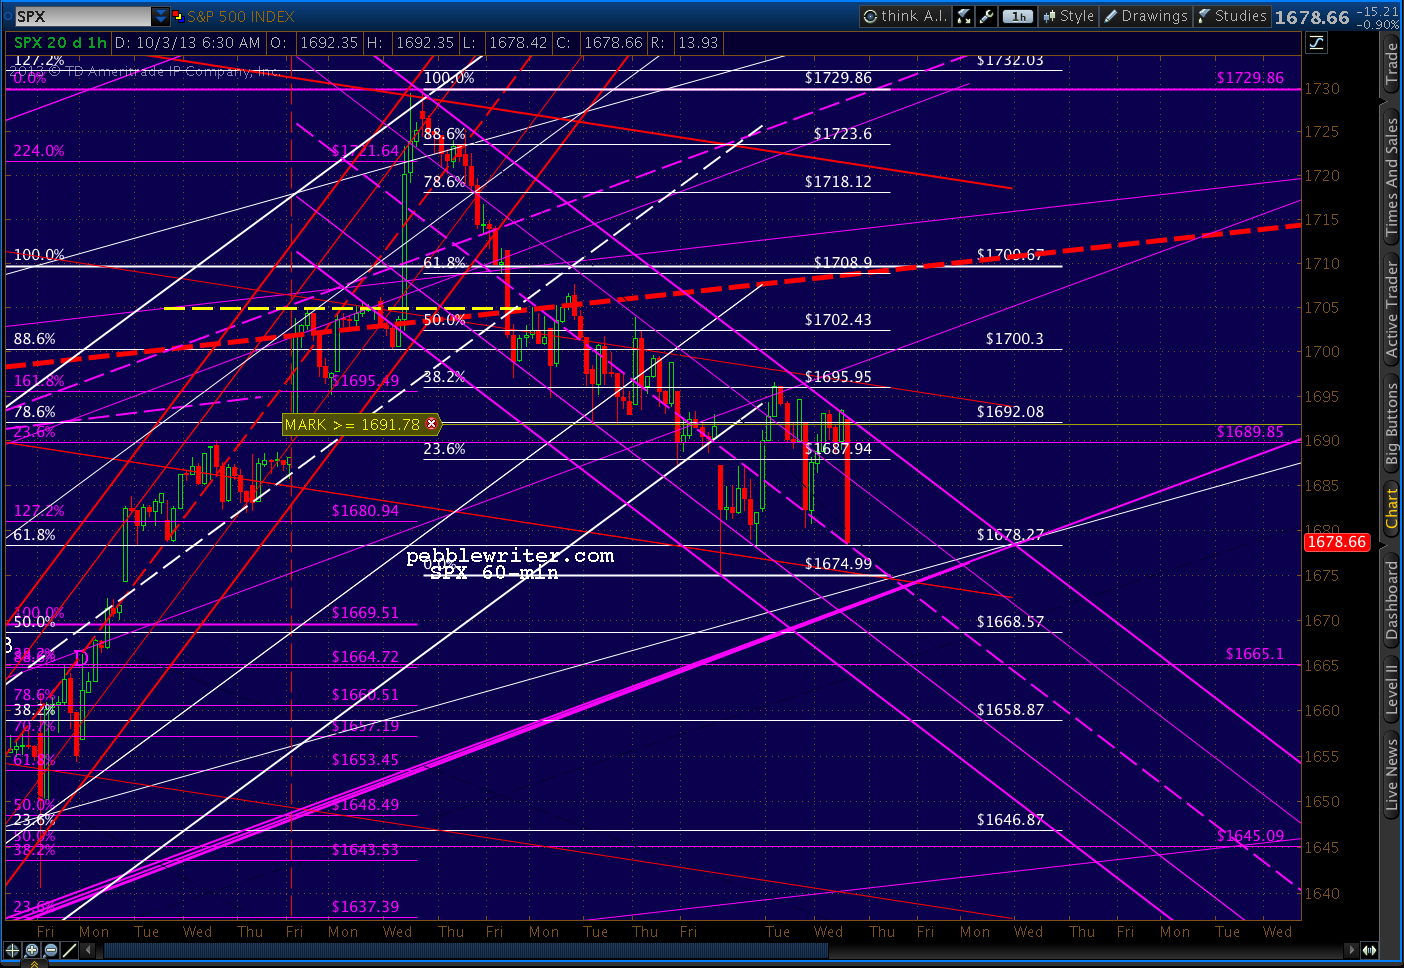 Note the .886 tag coming up on the red grid — also the midline of the falling channel and the bottom of the purple channel.
 A dip below 1666.75 might normally be expected to open up a small Crab Pattern to 1650.99. But, the larger pattern .618 is at 1663.71 (below in yellow) — only a slight breech of the purple channel bottom. It could prove to be strong support — depending on what sound bytes are being delivered by CNBC at the moment.
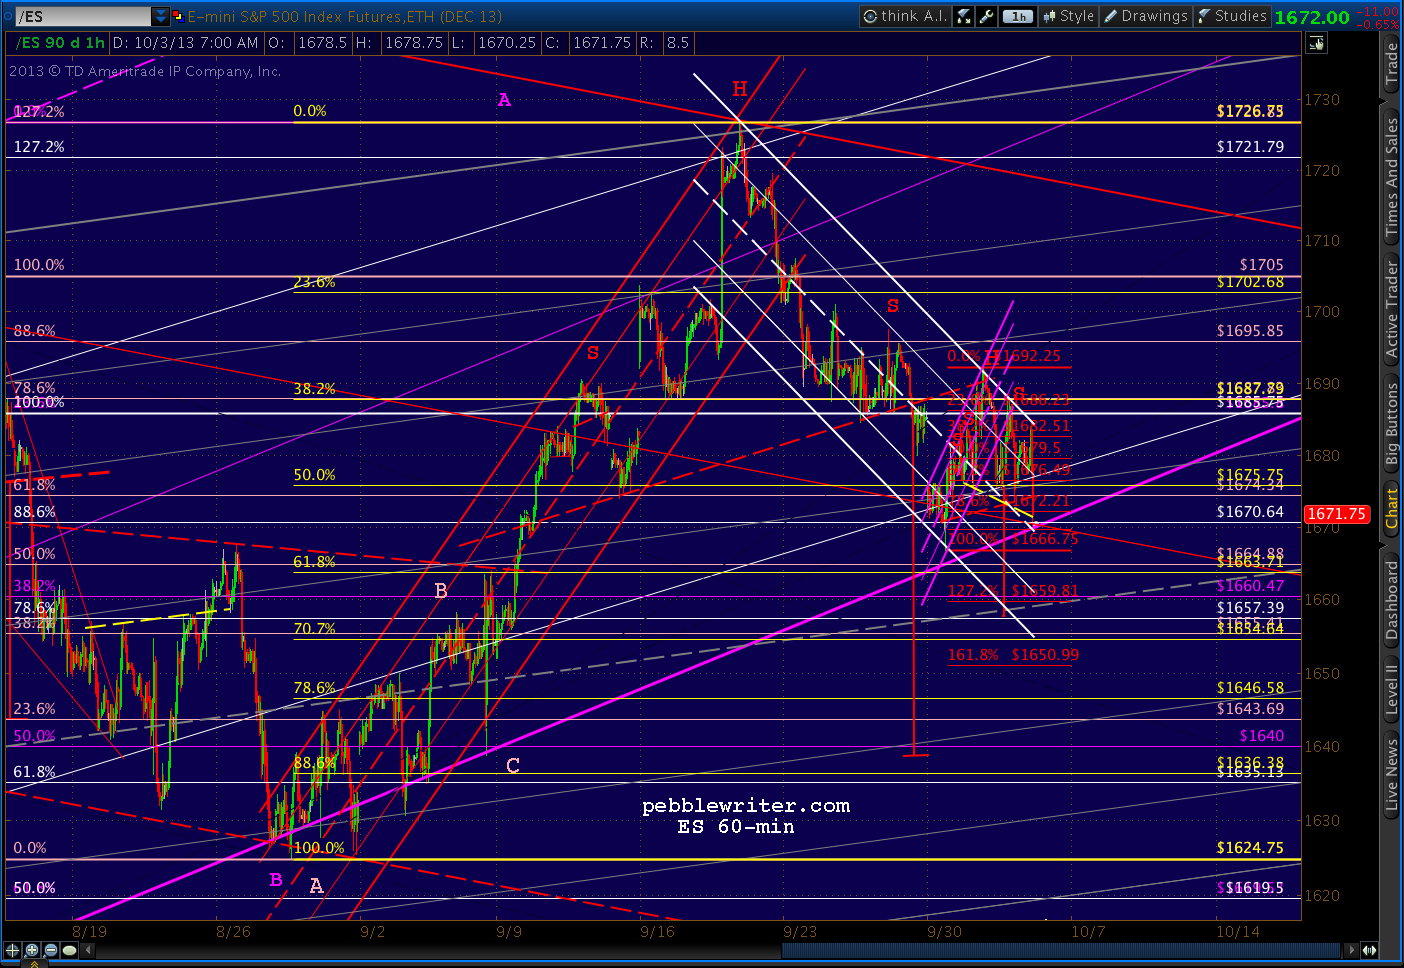 The equivalent .618 for SPX is 1666.58.
UPDATE: 11:30 AM
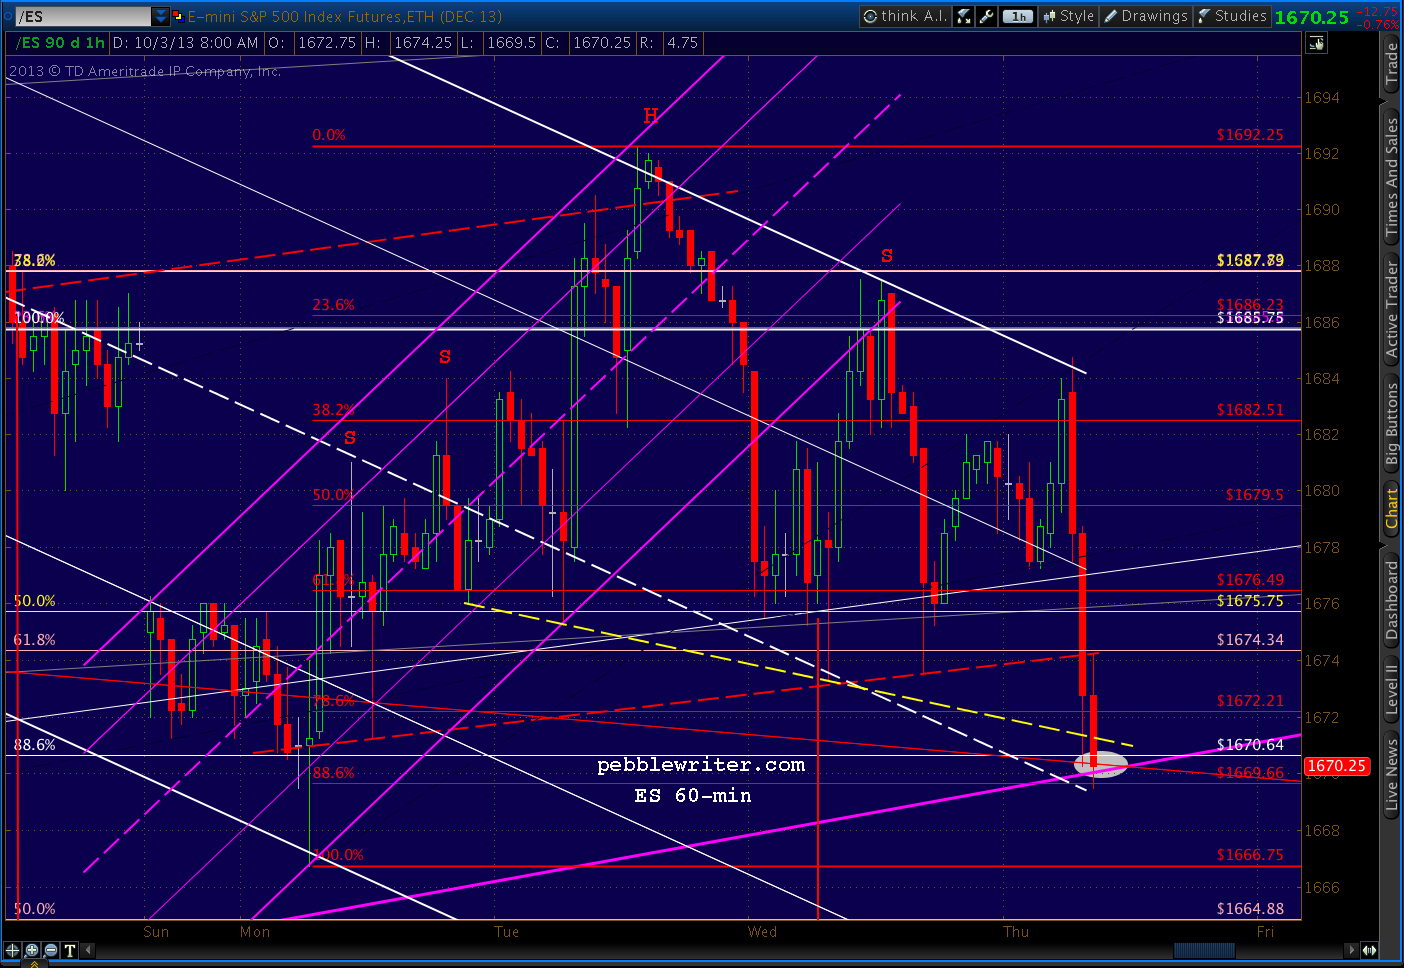
There’s the ES 1669.66 tag. Should be a nice bounce here. But, watch out for the drop through 1666.75 to 1663.71 we talked about above.
 UPDATE: 11:50 AM
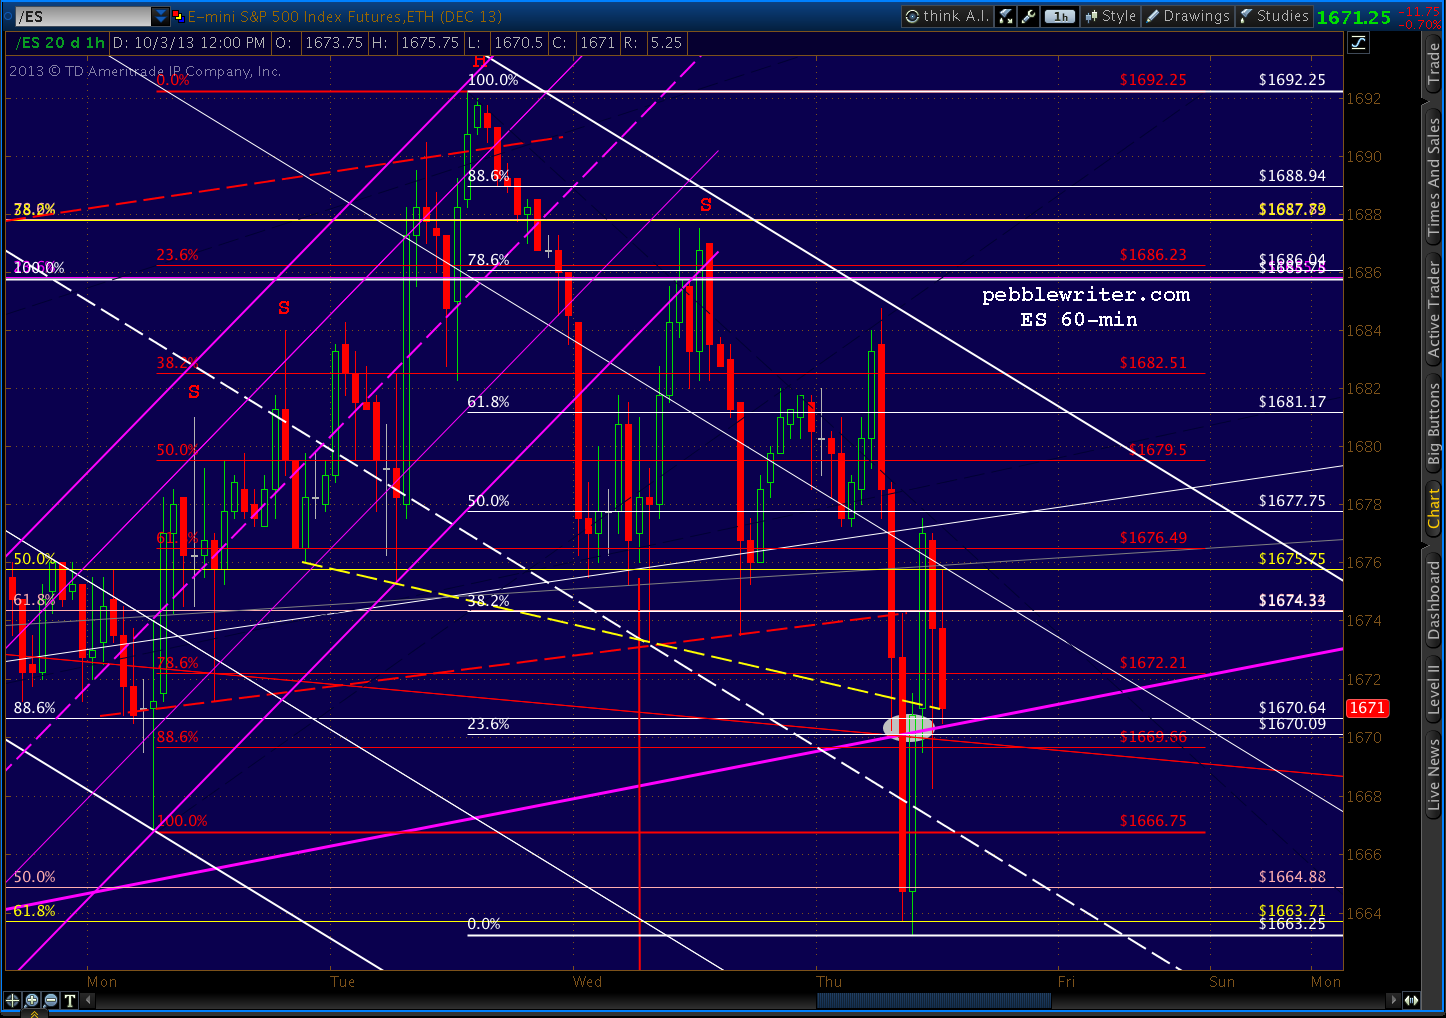
Just dropped through ES 1666.75. Next stop is the .618 at 1663.71 — though there’s no real good channel support there. There are lots of other potential turning points, including my favorite from the 30th at 1657 and my new favorite of the yellow .786 at 1646.58.
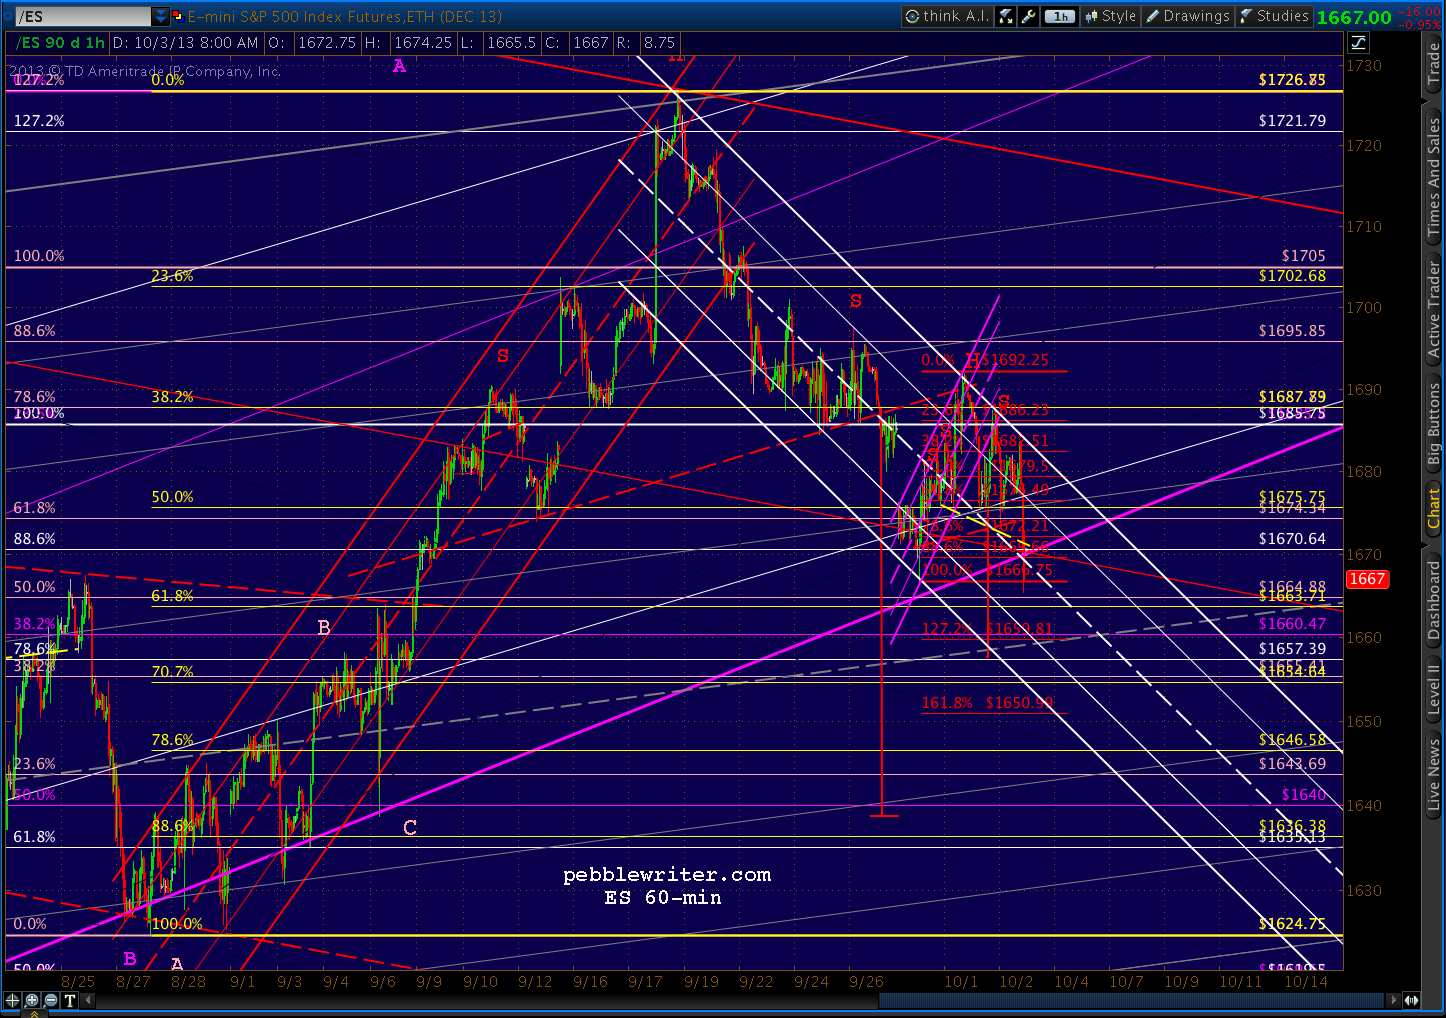 Needless to say, if the purple channel line doesn’t hold, all those other targets open up — starting with 1590-1600.
UPDATE: 11:59 AM
There’s the .618 tag at 1663.75. I’d look for a recovery here to at least the purple channel line — probably around 1670. A failure to close back up there means the purple channel is kaput.
 UPDATE: 3:58 PM
Looks like a close right on the neckline of the latest (yellow) H&S. For overnight traders, the purple line is the one that matters. SPX is well above its purple channel line, so there’s room for a little downside overnight — say, 1671.
 I’ll be spending the rest of the afternoon filling out forms for the Fund — an unbelievable number of forms, actually — as we try to get all the accounts open asap.
For those who have been waiting patiently, my best guess is that we’ll have documents as early as this afternoon or tomorrow, and wiring instructions as early as tomorrow or Monday. With any luck, we’ll be up and trading by next Wednesday.
Comments
5 responses to “Charts I’m Watching: Oct 3, 2013”
PW…a follow up on your response to Airyk…and not to bring politics into this forum but I am assuming you consider “Good News” as a passed CR and/or debt ceiling increase. In view of the dysfunctional congress we are probably several days (maybe early next week) or up to the debt ceiling deadline 10/17, (2 weeks from today) before we can expect any deals. Therefore, unless you have other news feed info, are we not at risk of a significant downside after we backtest the purple channel??? What would prop these markets to the upside at this point? News vs Harmonics….
PW…ES has breached the bottom purple channel intraday…your targets 1663.71/1657.39 are possible support and reversal points and would preserve the integrity of the purple channel bottom. At what point do you consider the purple channel broken and were heading to 1590/1600?
As a follow on to that question, if we do get the bounce- what would be your target/timeframe?
Well, it depends. If we get a technical bounce here at 1663 on no news, then we’ll probably just head back up to backtest the purple channel and close around 1670 to keep the channel intact (SPX 1672ish.)
If we bounce in conjunction with good news out of DC, then we’re probably off to the races — 1700+ in a jiffy.
The purple channel IS broken. The only question is whether ES can recover and close above 1670 or so in order for the intra-day break to be ignored. A close much below 1670, and the downside targets are immediately in play — including the yellow .707 at 1654.64, .786 at 1646.58 and .886 at 1636.38. Of course, if we don’t bounce at 1663, then they’re already in play.
Getting down to 1590/1600 is a little trickier, as I need to see some significant reversals in this area in order for the harmonic patterns to line up.