

ORIGINAL POST:
I’m keeping trailing stops fairly tight on this ramp after going long at 1431.50 yesterday for a bounce. There’s a good chance it won’t last. More after the open.
UPDATE: 9:40 AM
New channel for the leg down?

I’m taking profits on my long position here at 1441 and will sit on the sidelines until this sorts itself out.
More in a few…
UPDATE: 9:55 AM
Here’s one problem. The EURUSD, after completing a Crab Pattern at the purple channel line as we anticipated, reversed and broke the channel it’s been in since late July 24 (in red.) It’s back-testing the red channel now, and is unlikely to retake it.
This doesn’t mean it can’t move higher — on the underside of the channel. I wrote about this a few days ago, noting that the channel would run out of room prior to the election, but TPTB would likely seek to keep it afloat until after Nov 6.
These back tests sometimes go on for quite some time, so I don’t see a clear signal from the EURUSD just yet — other than the possibility that this morning’s rally is done (hence closing the long position.)
 The dollar, meanwhile, broke out of the channel it’s been over the same period. It hasn’t completed a back-test to the same extent as the EURUSD — but there’s a good possibility it will, ramping equities a little higher in the process. So, why not just stay long?

Since it exceeded the previous high of 80.25 yesterday, the downside case presented by the purple grid is damaged somewhat. Doesn’t mean it can’t go down, but there’s no harmonic case to support it at present.

Here’s the scenario I have been expecting for the past several weeks…
continued for members…
The EURUSD and the DX could maintain a pregnant pause, having completed their patterns but not yet ready to move on. Think of it as OPEX on steroids.
 The EURUSD, having broken the channel, moves sideways — hugging the highlighted intersection for the next 3 weeks. DX does the same with its just broken channel.
Both are itching to start a new chapter, but will likely not be allowed to unless the Fed/ECB are completely asleep at the switch. Once the election is over, however, there’s strong potential for everything to snap back.
If I’m wrong, and the EURUSD goes on to establish a new channel up (breaks out of the purple channel) then something wonderful will have happened to economies around the world. But, is that likely with the fiscal cliff looming and euro zone economies hanging on by their fingernails?
UPDATE: 11:50 AM
A fresh peek at the EURUSD illustrates my forecast a little better. The move from X to A fulfilled a Crab Pattern right at the purple channel boundary — making for a relatively easy short call.
Since then, EURUSD retraced 88.6% of that move to what I have market as Point B — yesterday’s low. I anticipate that this will eventually play out in another Crab Pattern to the Point D way down in the lower right hand corner — but probably after the election.
 Until then, I expect the latest move up to set up a Bat Pattern to the upside — with purple lower-case “d” coinciding with “C” about a week from today. This is as high as the back-test can go without breaking out of the falling purple channel it’s been in since the May 2, 2011 high.
To do so would obviously be highly significant and would mean either the investing world has recognized the fundamental strength of the euro or weakness of the dollar. In other words — a sea change. My longer-term forecast is for the dollar to rise relative to the euro, with DX reaching 87 in the next couple of months [see: Oct 2 Dollar Update] commensurate with an equities correction — but likely after the election.
Bottom line, the Fed and the ECB need the current administration to remain in place. Whether it’s good for the country/world is certainly open to debate, but they’ve committed to a policy of monetary expansion and a new guy in the White House would most certainly undermine that.
I read yesterday that Goldman Sachs employees/executives/PAC, ardent supporters of Obama in the last election, have swung to Romney’s camp due to the industrial strength dissing coming out of Penn Ave. If true — and we should expect the same from JPM Chase et al — would they go so far as to try and torpedo the market between now and then?
I can easily imagine some tense screaming matches between all parties, with the Fed holding the trump card — its checkbook that has, so far, enabled the banks to remain in business despite enormous unreported losses in their derivatives portfolios that would otherwise wipe out their capital faster than you can say “whale trader.”
If you haven’t read them lately, I strongly recommend “There is Nothing Wrong” and “The Wipeout Ratio.” It might well be that the banking establishment can keep their troubles hidden indefinitely. But, nothing has changed since I posted this chart last April.
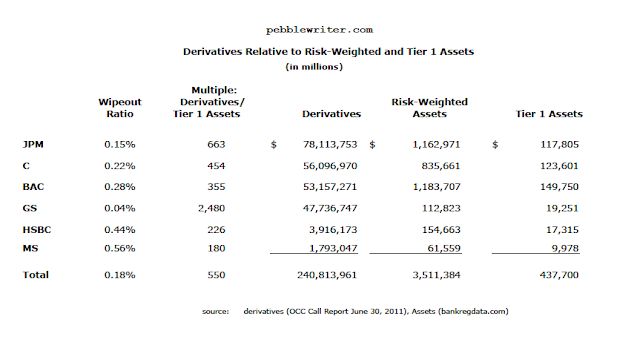
At the time, JPM held $663 in derivatives for every $1 in tier-1 capital. So, a 0.15% change in the value of that $78 trillion portfolio would wipe them out. What are the chances that they haven’t experienced a 0.15% decline during the volatile past few months? The Fed doesn’t require them to mark their portfolio to market, as it knows investors would surely run screaming for the exits if the truth were ever revealed.
Just saw an amusing quote from Lloyd Blankfein, Goldman CEO. He said he “would be a buyer of the market if the fiscal cliff were solved.” So would I. I would also suck on plutonium lollipops if they weren’t radioactive.
The fiscal cliff is a self-imposed deadline to take action on the inherent imbalance between the money the US takes in and what it spends. According to the CBO, fiscal 2012 closed with a $1.1 trillion deficit. We took in $2.45 trillion, and spent $3.54 trillion. So, actually “solving” the fiscal cliff (not just postponing it) would mean a 45% increase in taxes or a 31% decrease in expenses (or some combination.)
Look at the way D.C. works these days and ask yourself which of those outcomes is even remotely possible. How many politicians would vote for either course? Talk about political suicide…
Speaking of politics — and then I’ll get back to the markets — the cheapest gas I saw in LA yesterday was 4.68/gallon. I know other states are also being hit with higher prices now, just weeks before the election. I have to ask myself, who benefits when prices move higher like this — aside from obviously goosing oil company profits?
California is obviously not going Republican any time soon, but might the oil companies — whose contributions (according to the Center for Responsive Politics) have favored Romney 4:1 — have an interest in who gets elected?
Elections, like markets, are not won by changing everyone‘s opinion. They’re won by influencing the folks in the middle — the 2-3% who might, in this case, switch sides if convinced that a change in the White House might save them a few bucks at the pump. It’ll be interesting to see what happens over the next few weeks to gas prices in swing states like Ohio, Florida, Colorado…
UPDATE: 1:45 PM
SPX is nearing the bottom of the pink channel that caught the market at 1430 yesterday. This is important support. A break probably means a decline to at least 1426 (the .618) and, more likely, 1413.24 — the .786 of the 1396 – 1474 we discussed at length yesterday. It’s seen as Point 5 on the chart below.
 If the pink channel holds, then this morning’s spurt to 1443 could count as a Point B in a potential Bat Pattern that could complete at the .886 of 1466.36 — probably tagging the rising white channel midline in the process.
If the pink channel doesn’t hold, then the falling channel will likely continue down to either 1426 or 1413 as discussed above. A reversal at 1426 leaves the most options open:
- a Gartley completing at the .786 of 1413
- a Bat completing at the .886 of 1405
- A Crab completing at the 1.618 of 1348
Since the high previous to 1474 was 1422 (last April 2), the .618 target of 1426 is the only one which wouldn’t involve a wave overlap of some sort. It is therefore the most bullish of the three downside scenarios — leaving higher prices (than 1474) on the table.
The 60-min RSI clearly shows the overhead resistance lying in wait for any breakout.
 If RSI breaks out of the falling white channel — which correlates with our small white price channel — it must contend with the red channel mid-line and a yellow channel line.
In playing around with the daily RSI, I can see several sets of channel lines that roughly correlate with those which guided SPX’s price from 1074 in October 2011 to 1422 in April 2012. It takes a bit of squinting, but similarly sloped channels apply to the 1266 – 1474 rally as well.
 Ignore the yellow and purple channel lines for the moment. The important thing is the divergence that accompanied the previous high and the two lows — the white dots. The 1474 high on Sep 14 came at the top of the white channel, whereas the 1422 high last April came after RSI had broken down from the channel and came back to tag its mid-line.
There’s certainly no guarantee the this current cycle will play out as the previous one — the basis for yesterday’s analog post. But, the parallels are compelling enough that it’s my baseline assumption until circumstances dictate otherwise.
If the pattern does repeat, it might look something like the following, with the ultimate high (if not 1474) coming just after the election on a lower RSI high than the 1474 peak.
 My best guess as to how this works out on the price graph is an upturn from here (or after a brief dip to 1426 or 1413) to re-test the white channel high.
Comments
5 responses to “Charts I’m Watching: Oct 11, 2012”
Nice posts PW!
PW, Does this look like a H&S on the SPX to you? On the 60 min chart
it looks almost symmetrical with a slight down slope to the shoulders.
Are you seeing a completed pattern or an almost complete pattern — with the right shoulder half-formed so far? I like the potential…
I was thinking 1430 neckline and the right shoulder between 50 and 61
retracement.
I’ll buy that. It would complete at just under 1430 and target 1391 — the bottom of the expanded white channel. Just not sure about the time frame. And, of course, it loses a little credibility as a continuation pattern — rather than coming at a top. But, I think it’s a good call regardless.