Futures are mixed as we cruise into the end of the quarter – with USDJPY’s breakout and VIX’s breakdown neatly offsetting WTI’s selloff. continued for members…The equity picture is essentially unchanged except that the downside potential has been delayed by the channel breakout. Breakouts usually persist and produce new highs. But this one, coming on the heels of QT, is unlikely to do so. Instead, it is likely to backtest the broken channel at the lower price target.
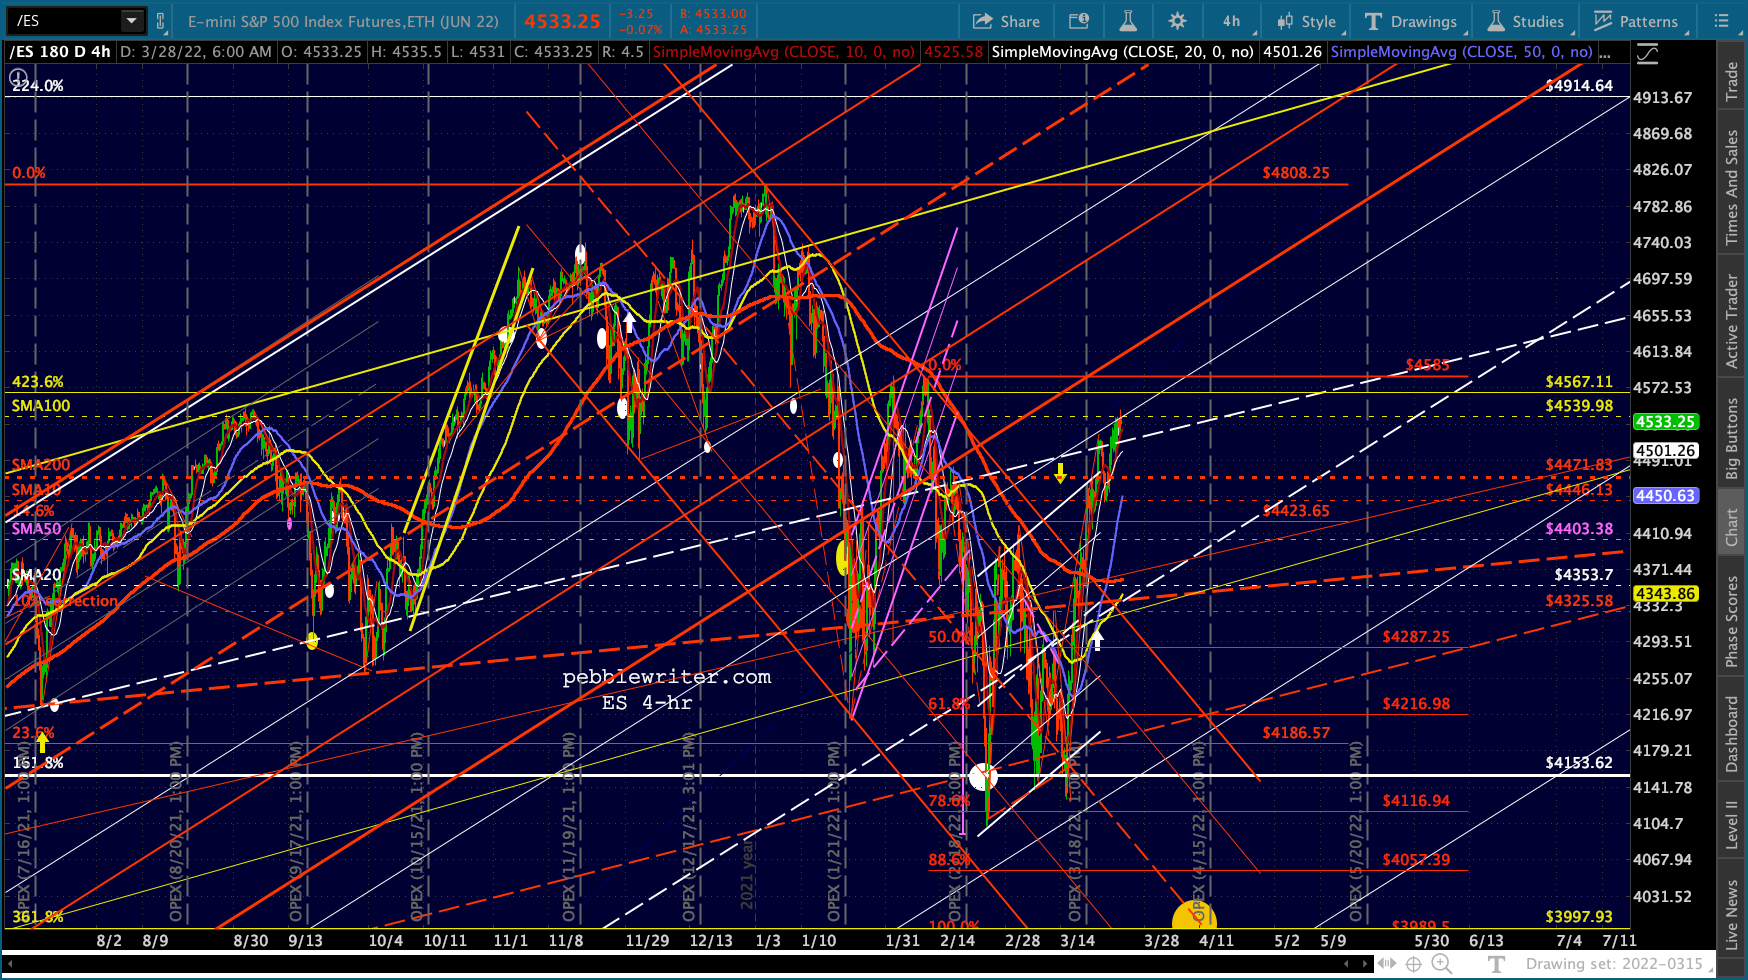
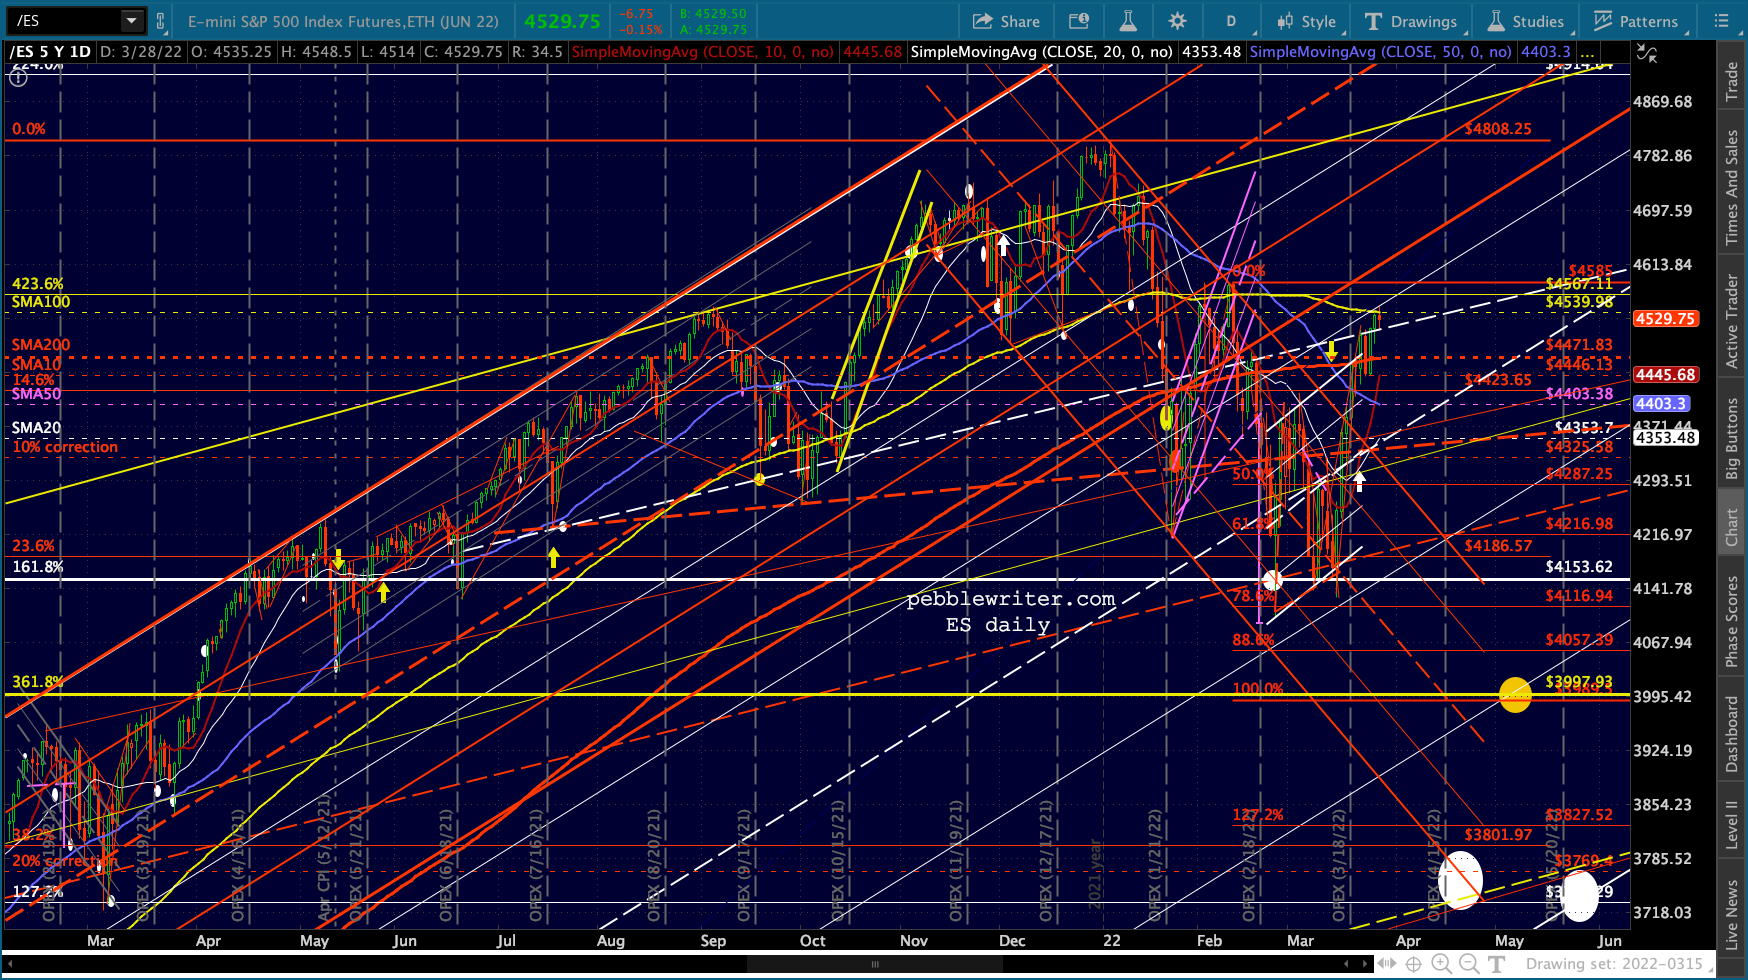
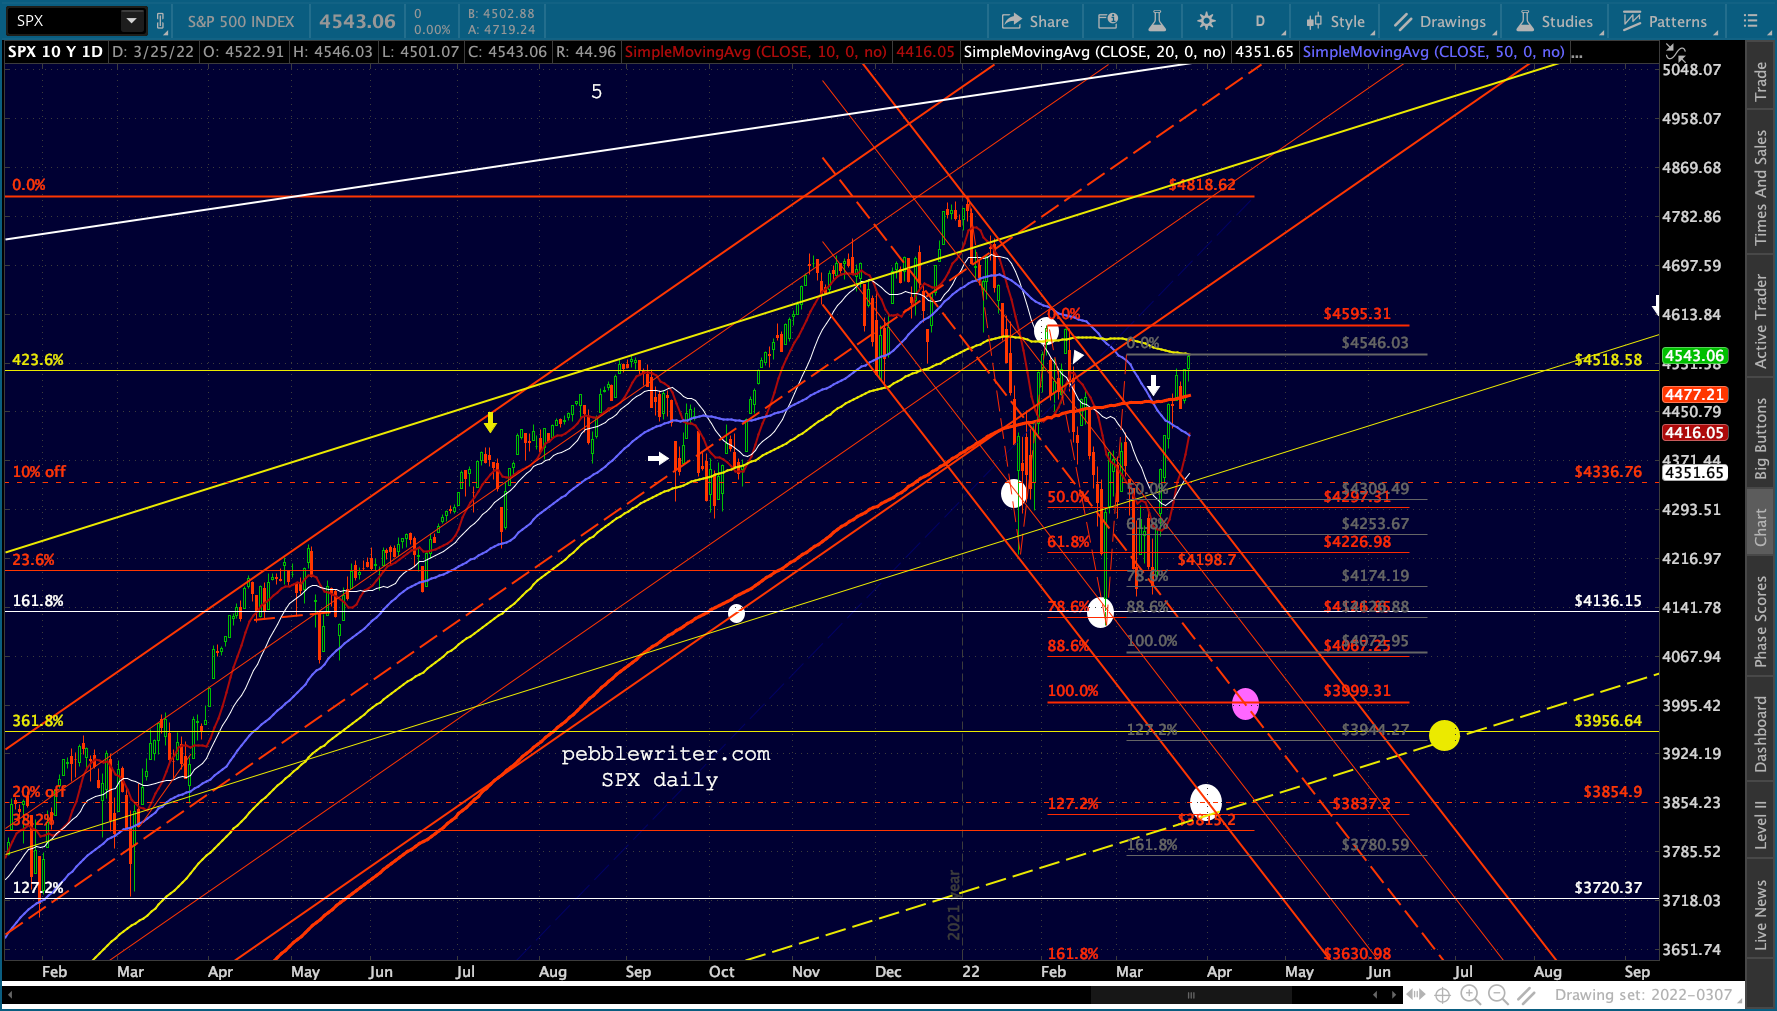 A drop through the SMA200 is all that is needed to motivate additional equity upside – or, at least, to postpone any significant drops.
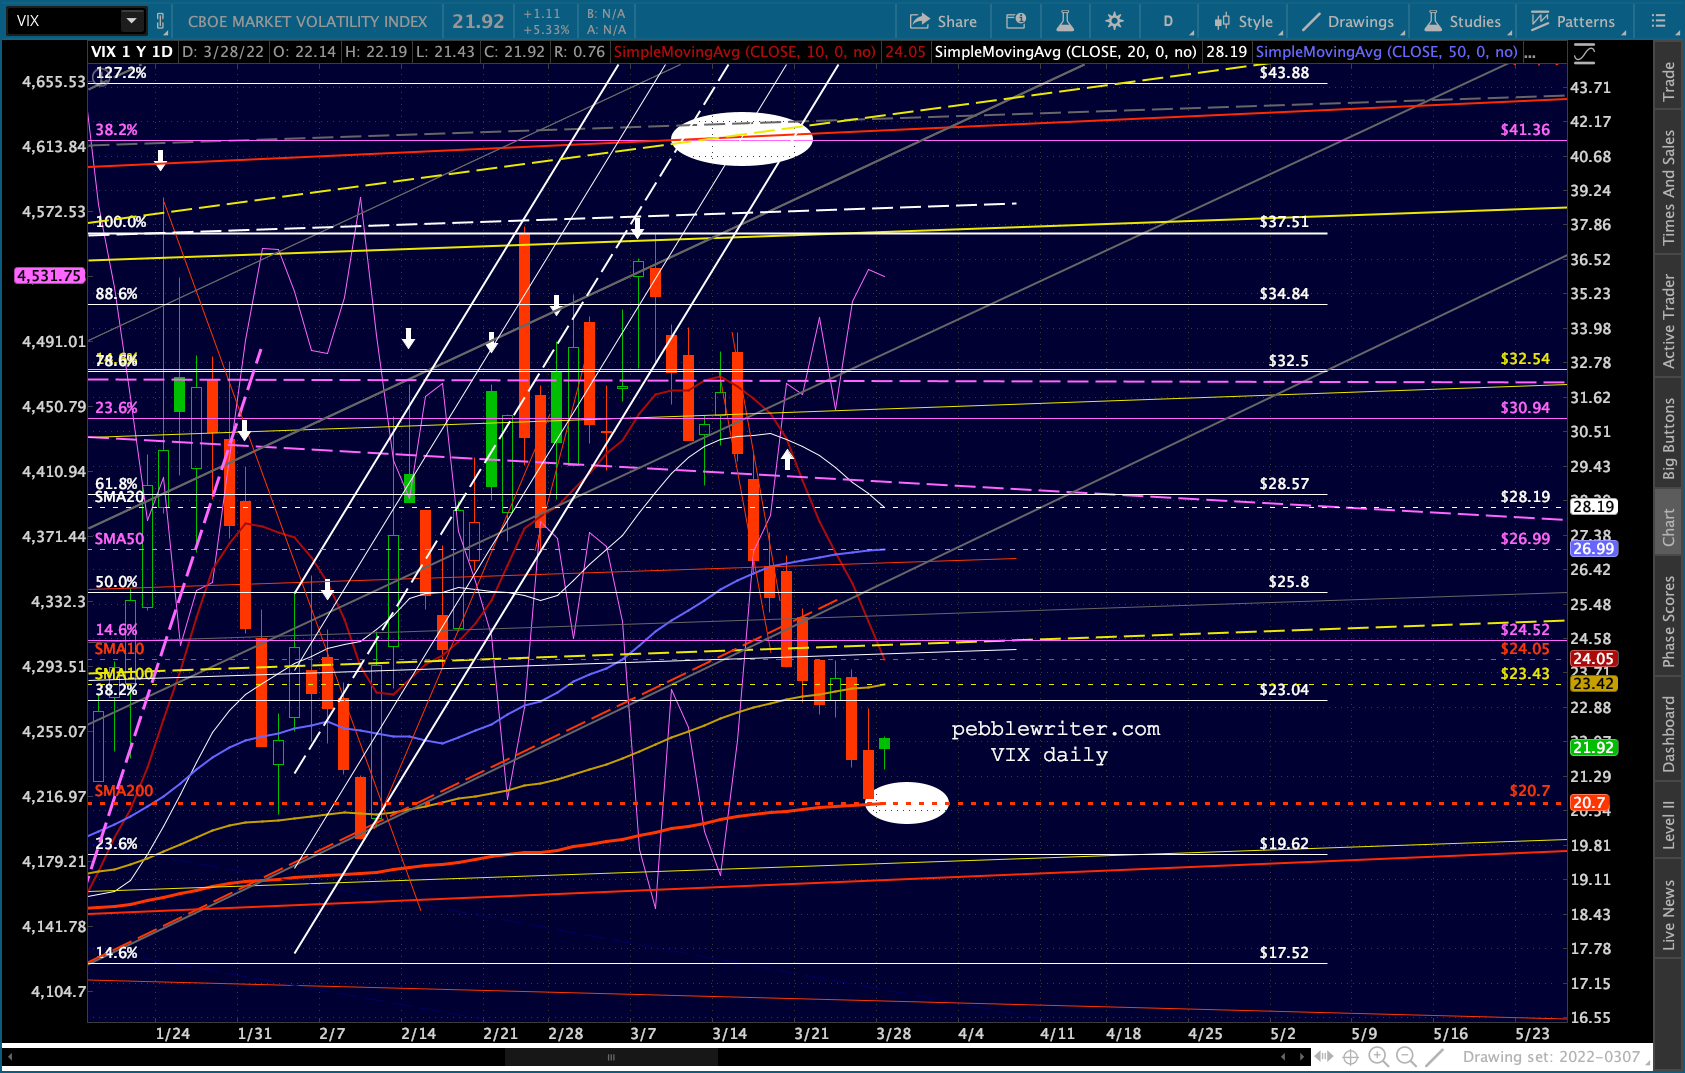 In the currency picture, note that USDJPY has clearly broken out…
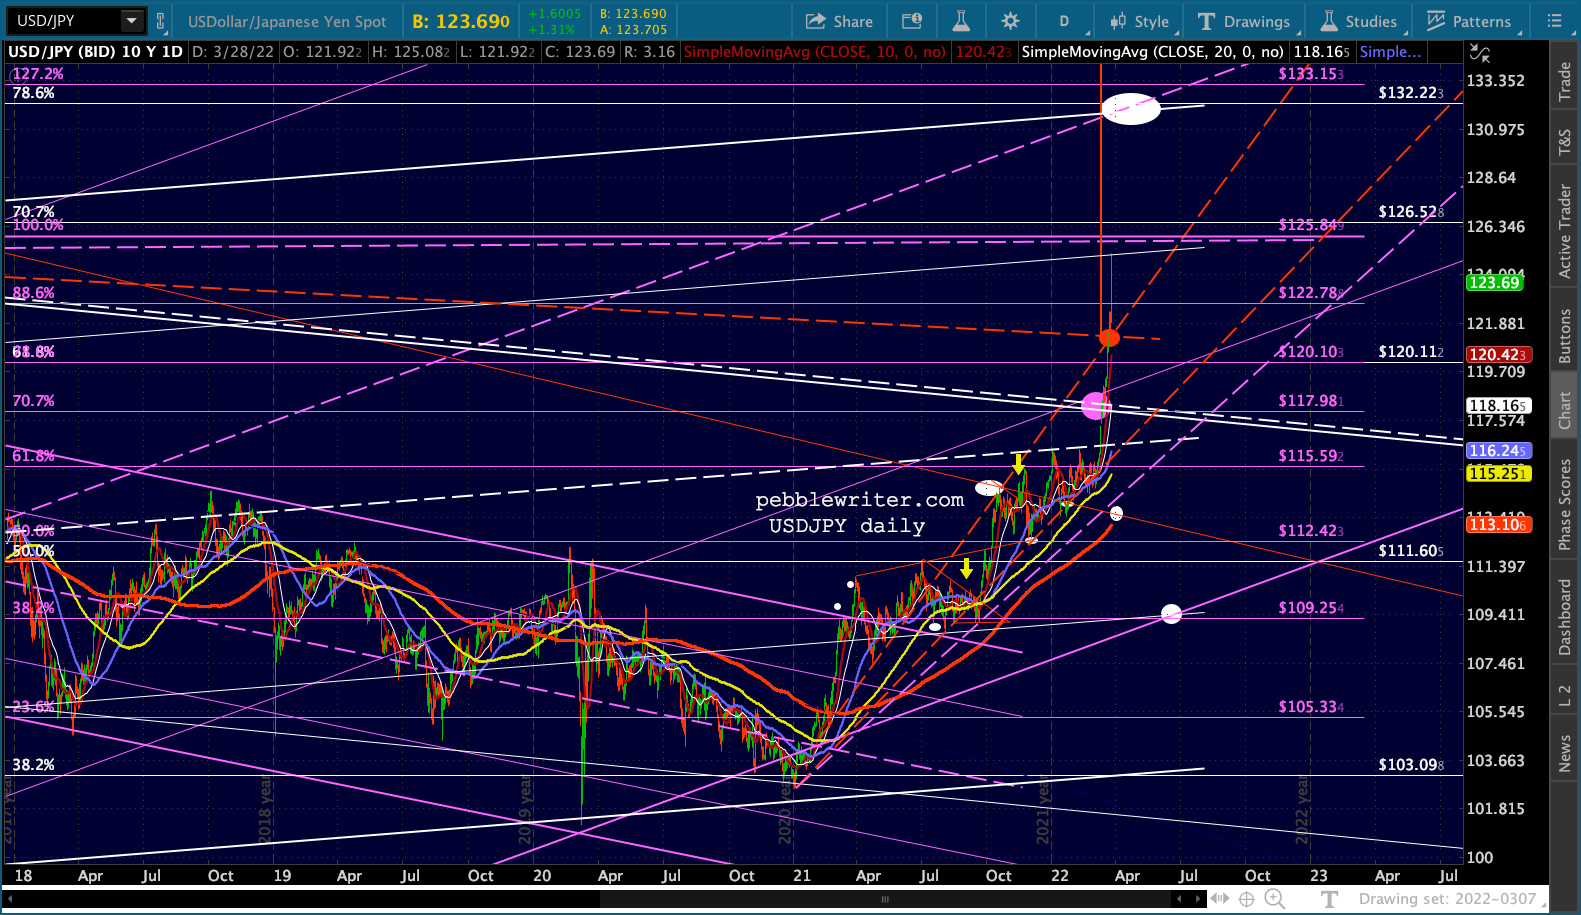 …while EURUSD seems to finally be breaking down.
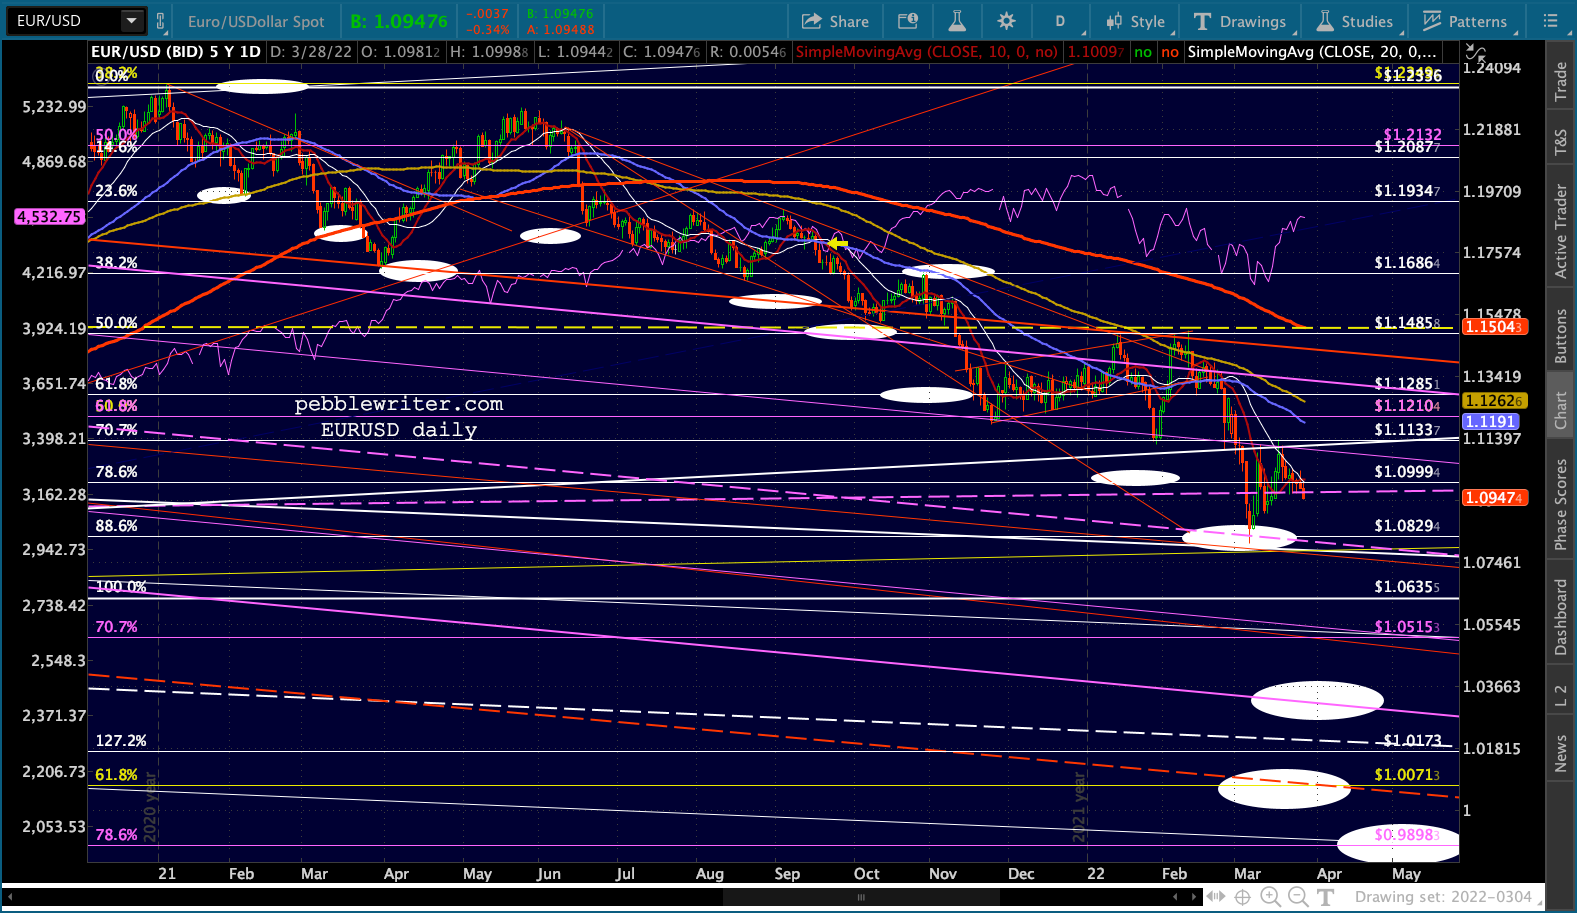
 I had expected BTC to wait until the SMA200 dropped down to the neckline for its backtest. But, it’s happening now – which is theoretically a more bullish development. If it can remain above the neckline, then it has a much better chance of rising through the SMA200. But, it won’t be easy. A reversal at the SMA200 is much more likely.
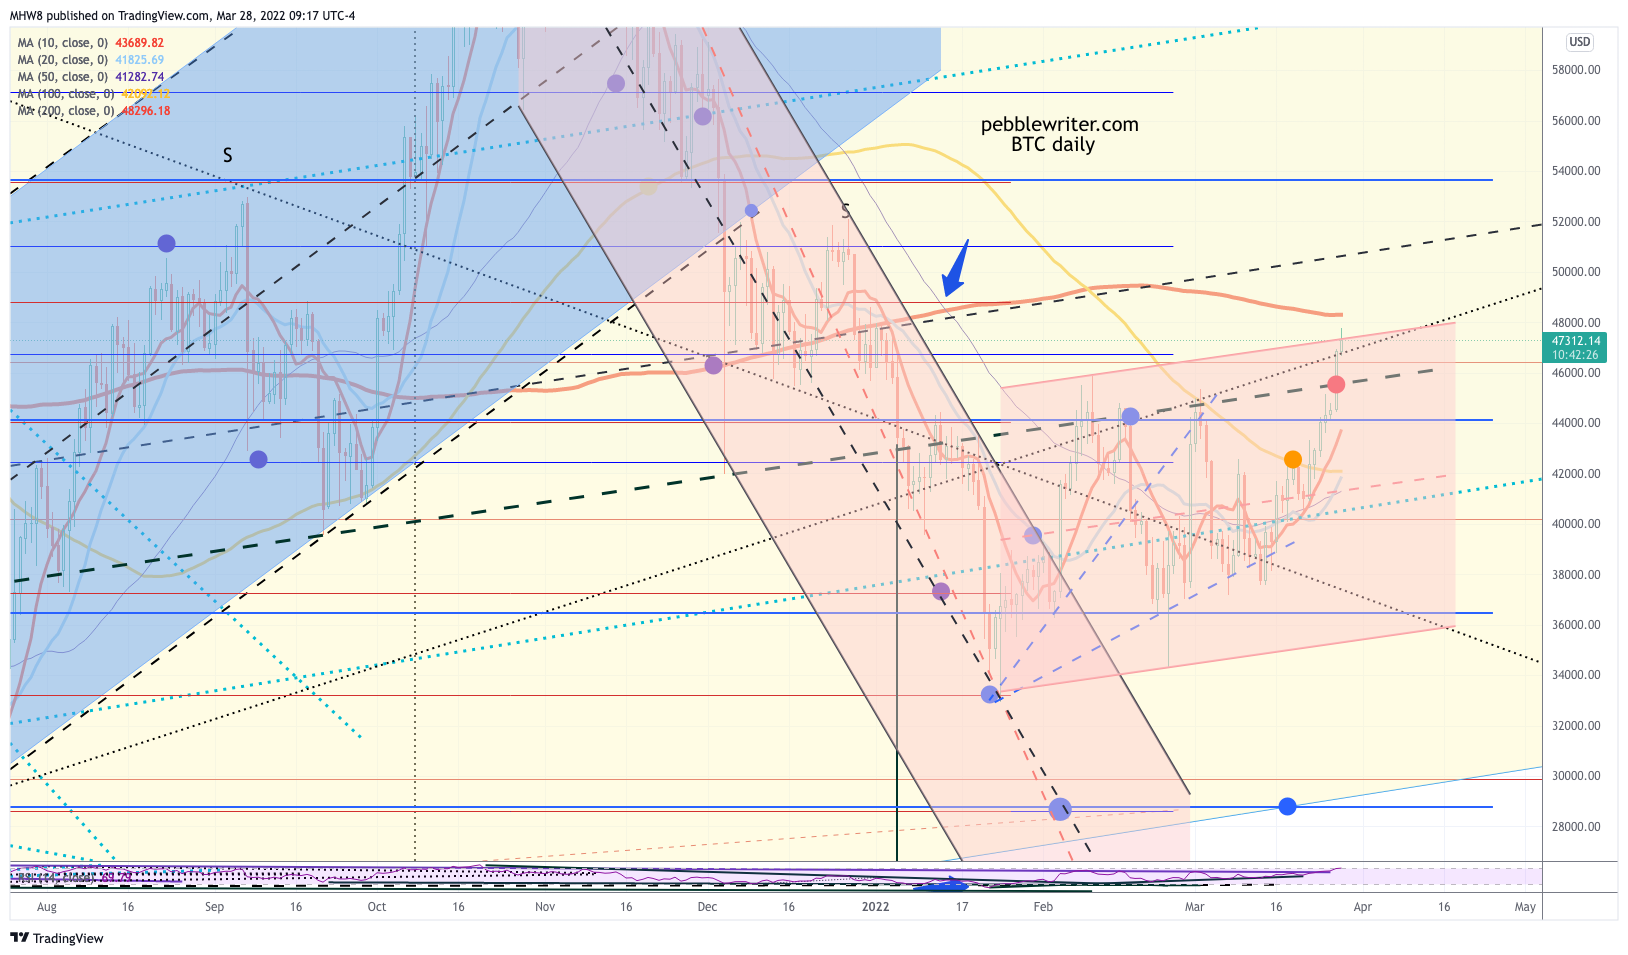 Note that while RSI has broken out, it is once again overbought.
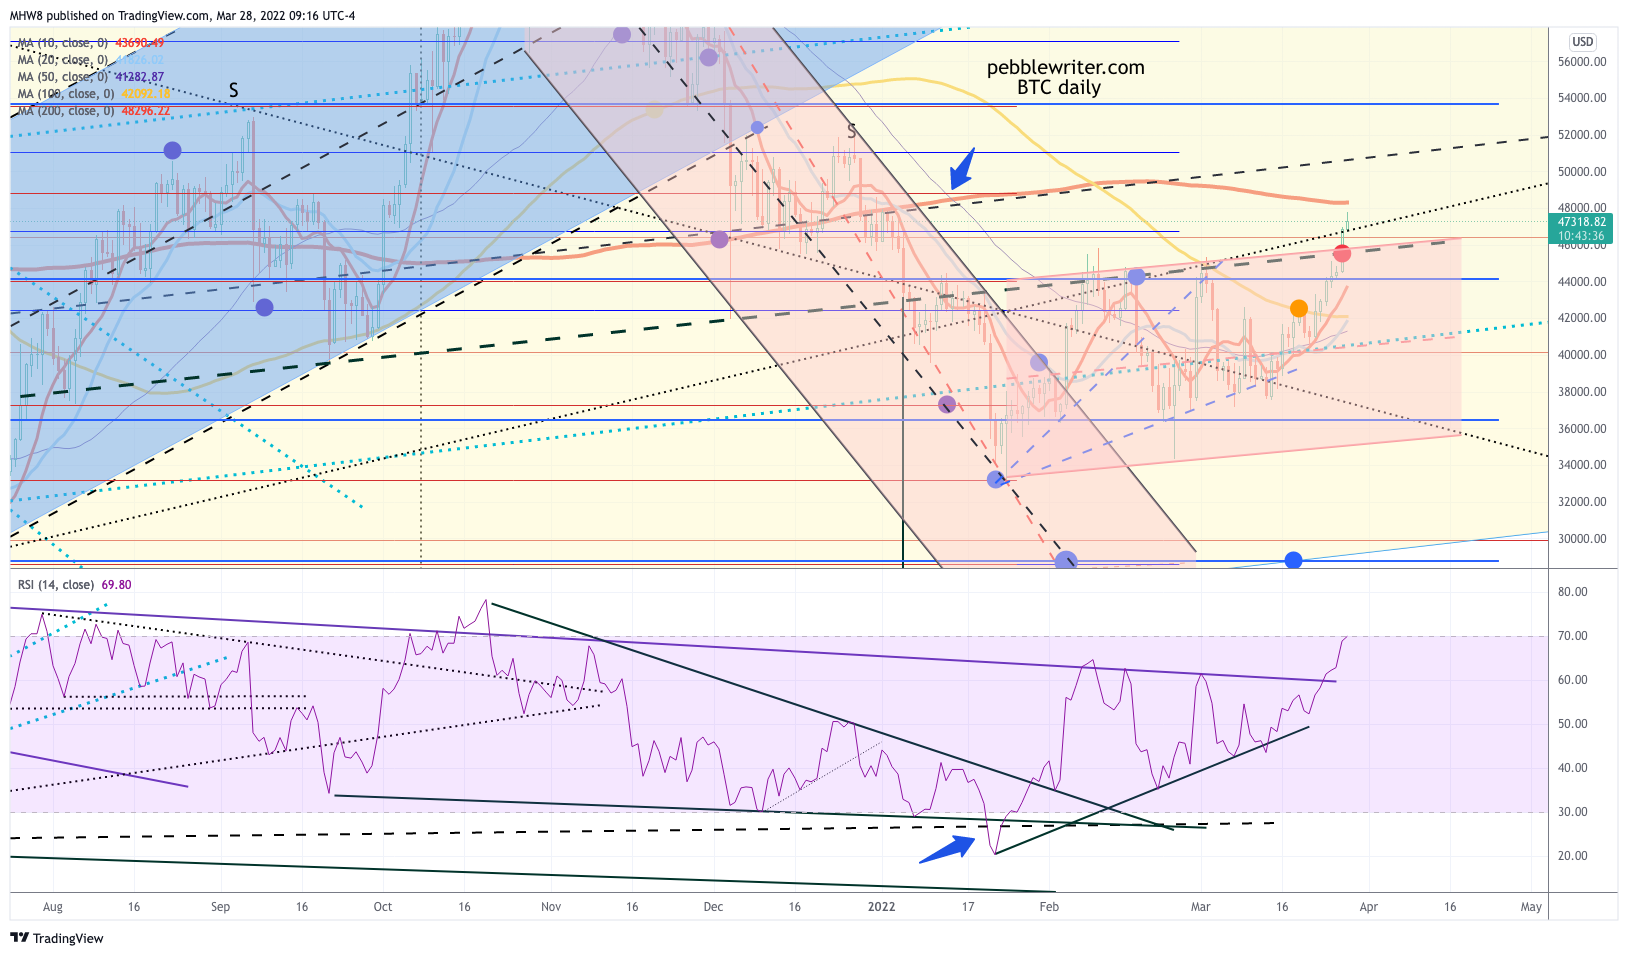 As mentioned above, oil is breaking down. Why? Because it has to. TNX broke out of the rising red channel and is nearing its yellow channel top.
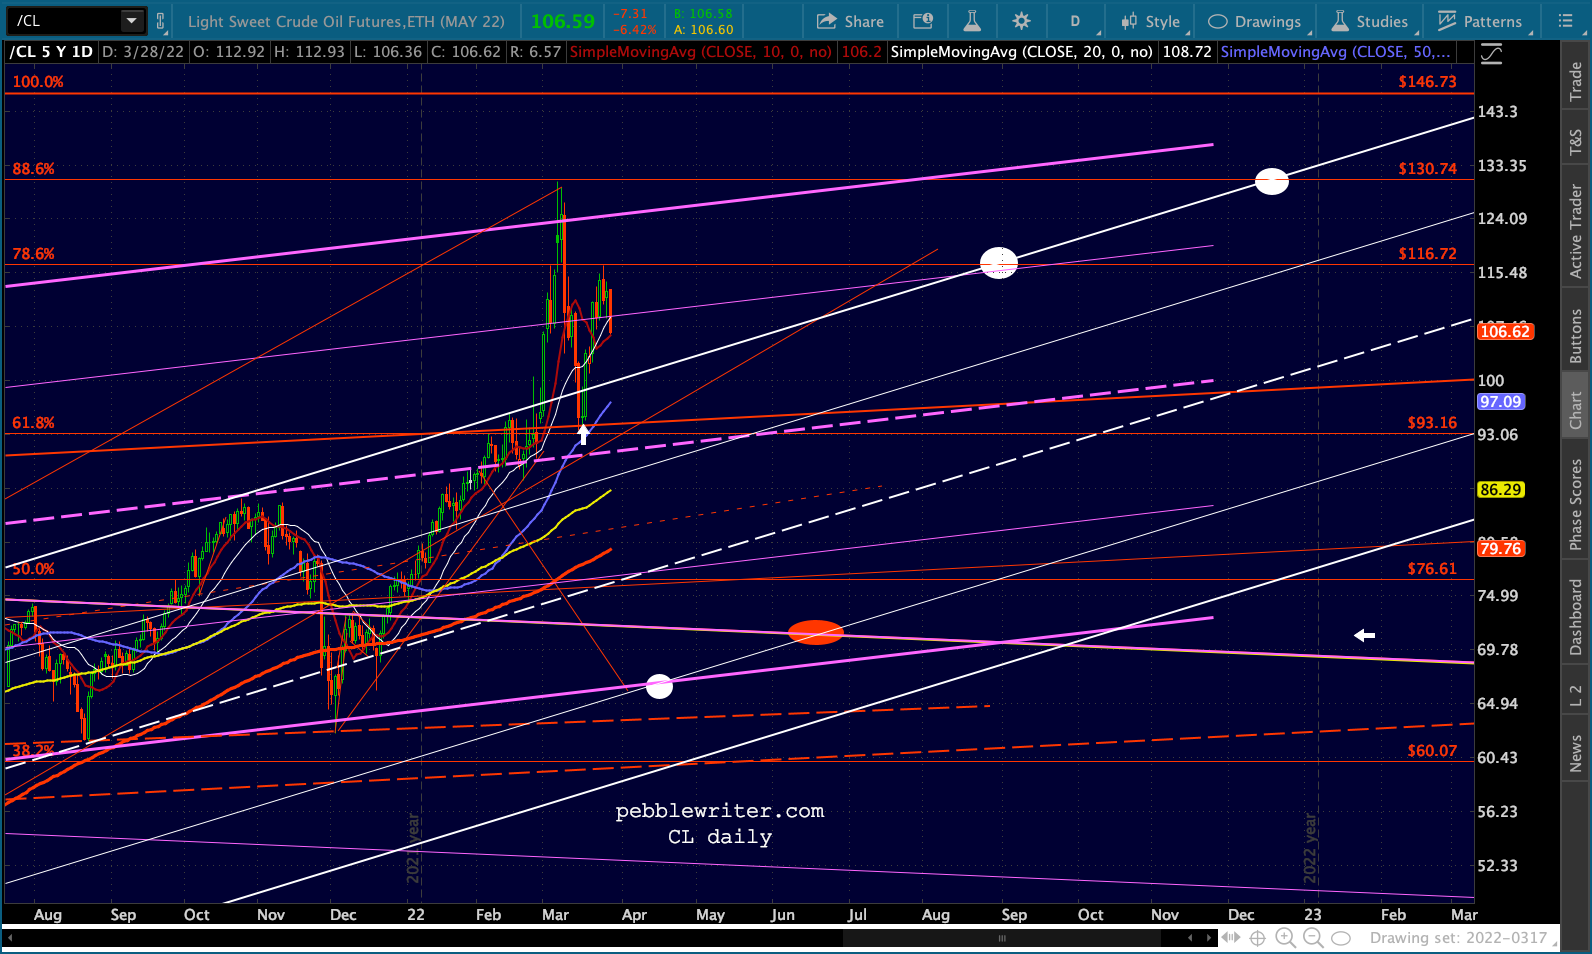
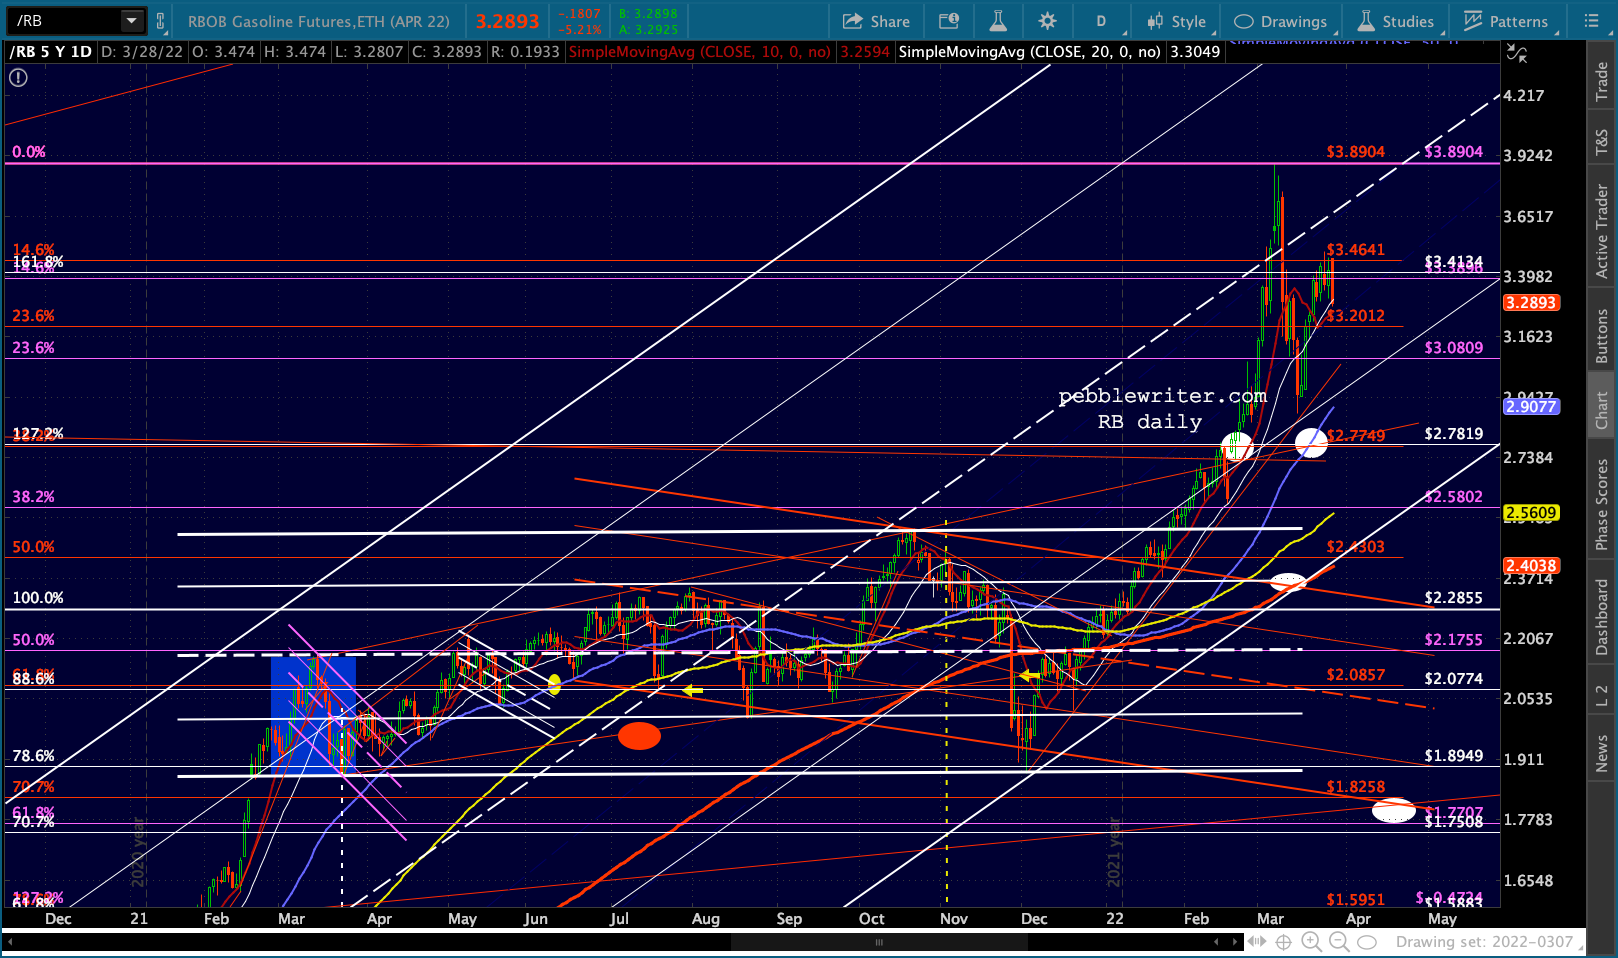
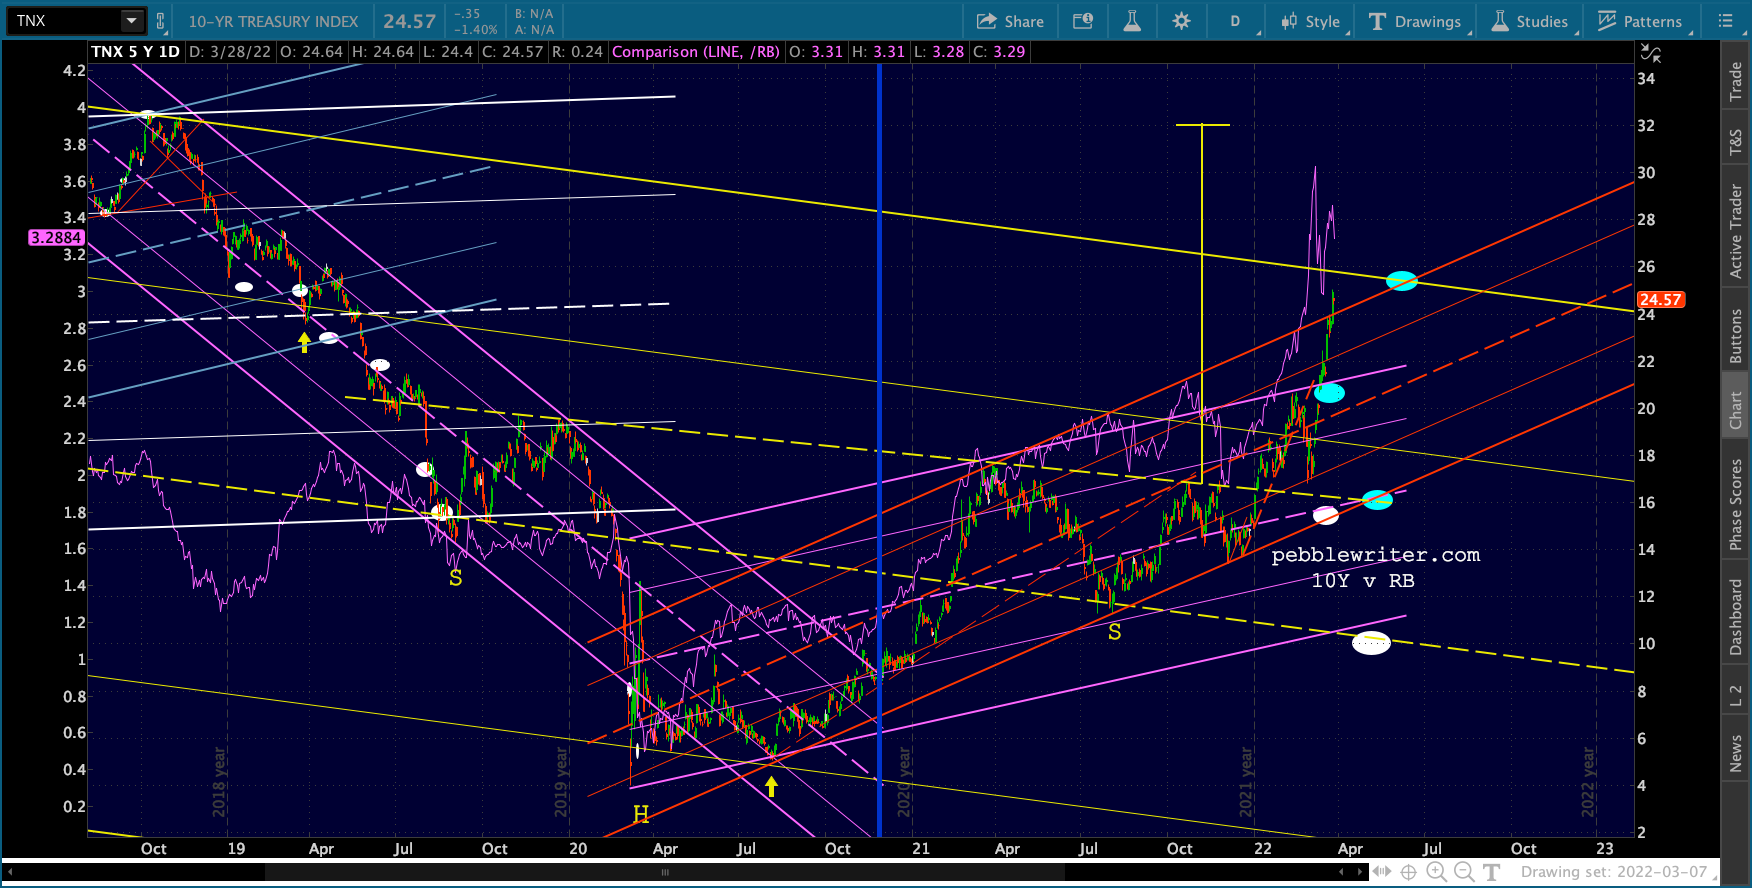
The only way to stop its ascent is to reduce inflation expectations – i.e. crash oil and gas. Look for one or more announcements in the next day or two (e.g. more lockdowns, the Iran deal?) that will dramatically lower oil and gas prices.
Look for CL to re-test the white channel top and its former low (the white arrow.) If it doesn’t hold, then we can start looking