

Yesterday’s death cross in VIX is officially in the books (the yellow arrow.) So, it’s no surprise that ES added another 10 points in the after-hours. Look for it to backtest the 1.272 it just broke through (2845.11) as soon as the SMA5 200 arrives on the scene.
 There are potential pitfalls ahead, of course. The Fed’s supposed reticence to take further action, a resolution to the China trade war, the meltup in oil and gas prices — these things are all baked into the current price.
With a Fed announcement and presser scheduled for tomorrow, the present meltup will soon get a chance to prove its resiliency.
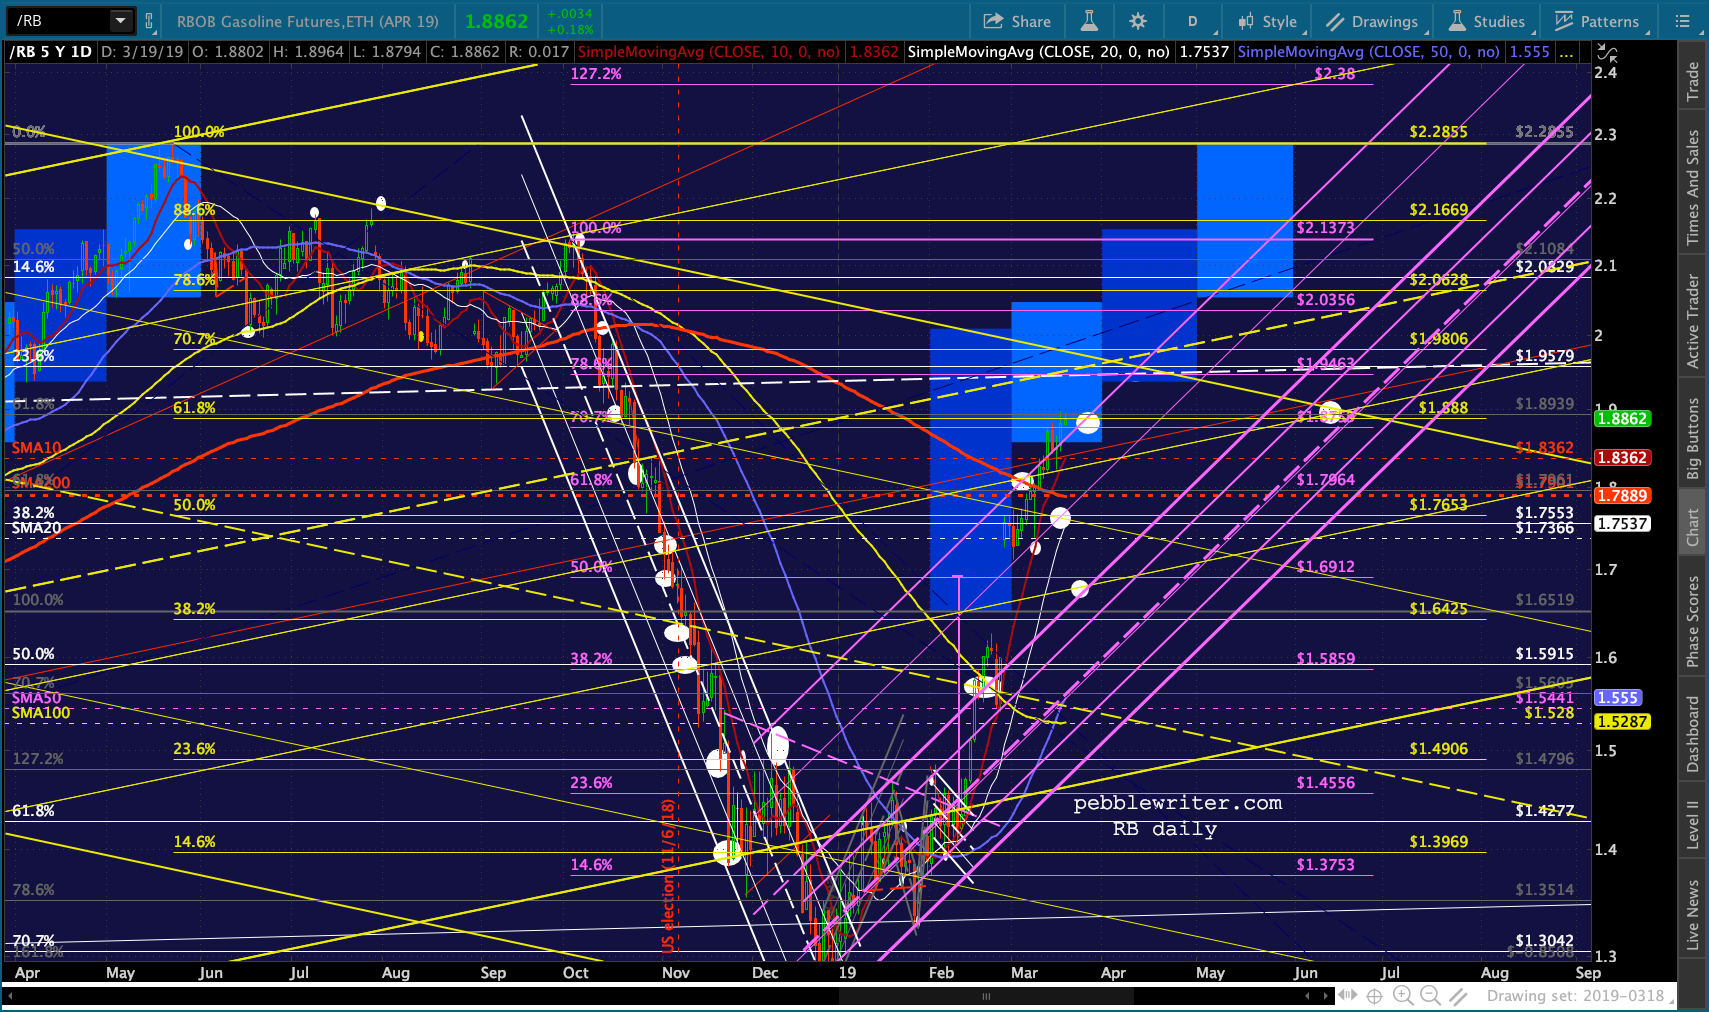
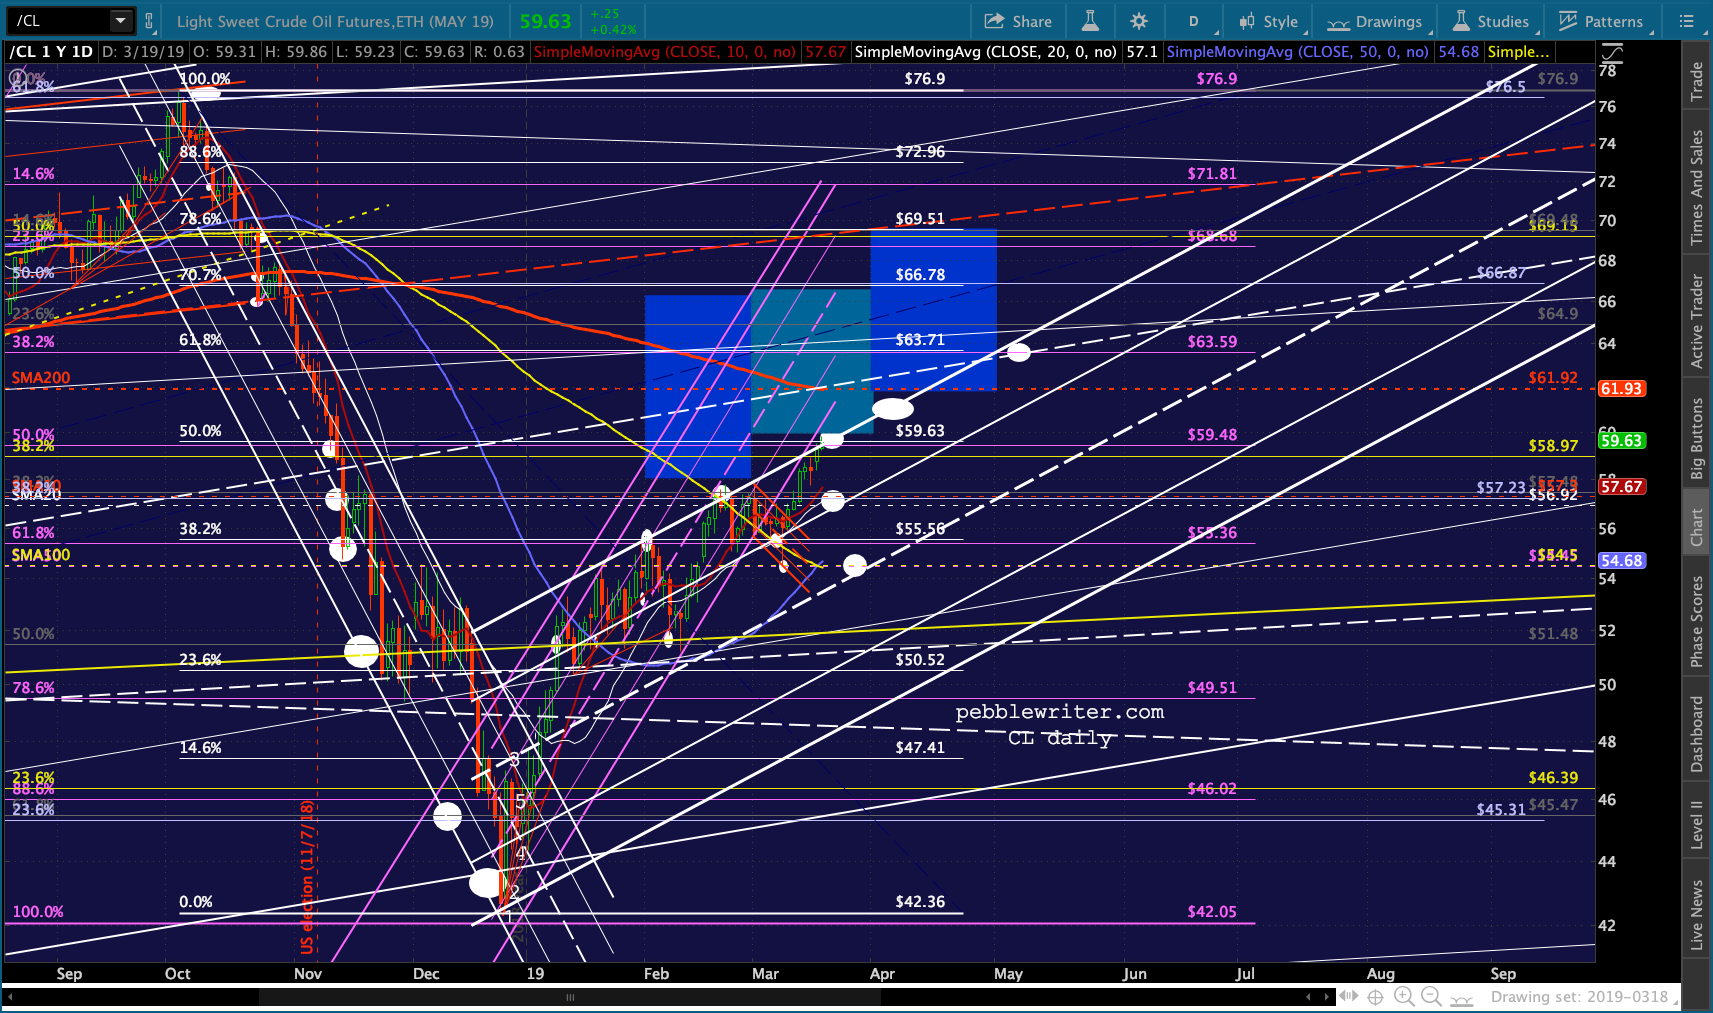
continued for members…Today’s charts show RB running into its yellow .618 and CL its .500 and the bottom of its 2018 range. In other words, both face important resistance and are susceptible to a meaningful drop here. Watch for any signs of a reversal.
 But, SPX is getting plenty of support from USDJPY, which suddenly popped back above its SMA200…
 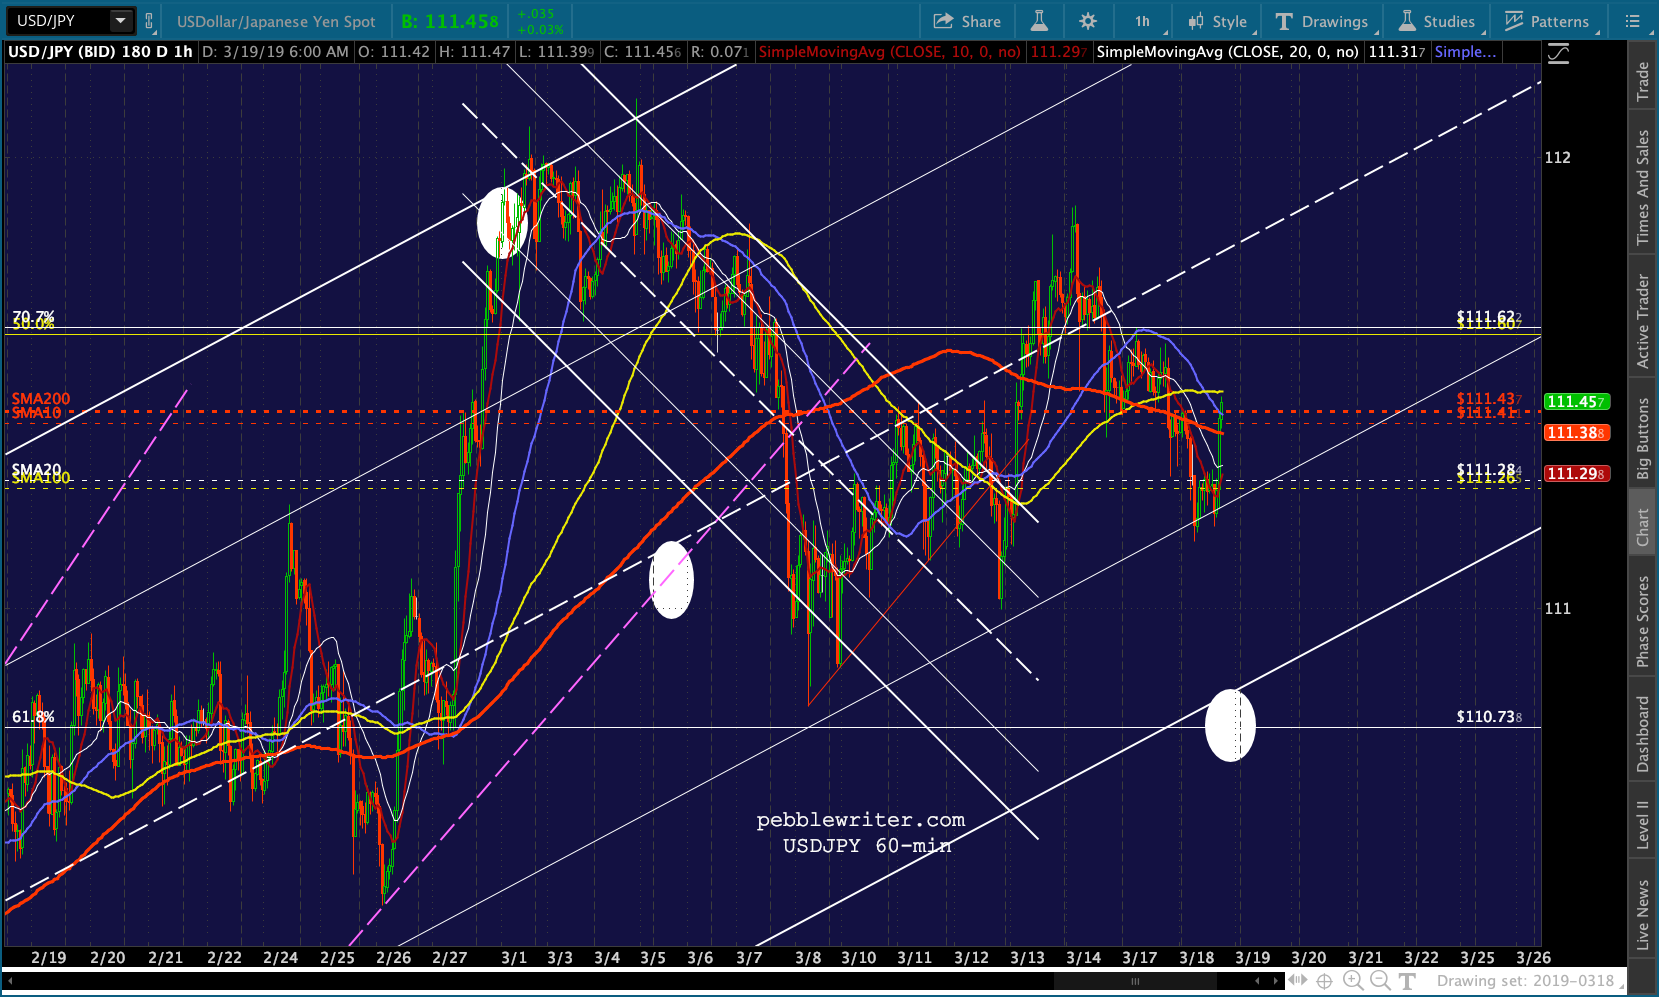 …and VIX, which is plumbing new lows and approaching the yellow channel top.
 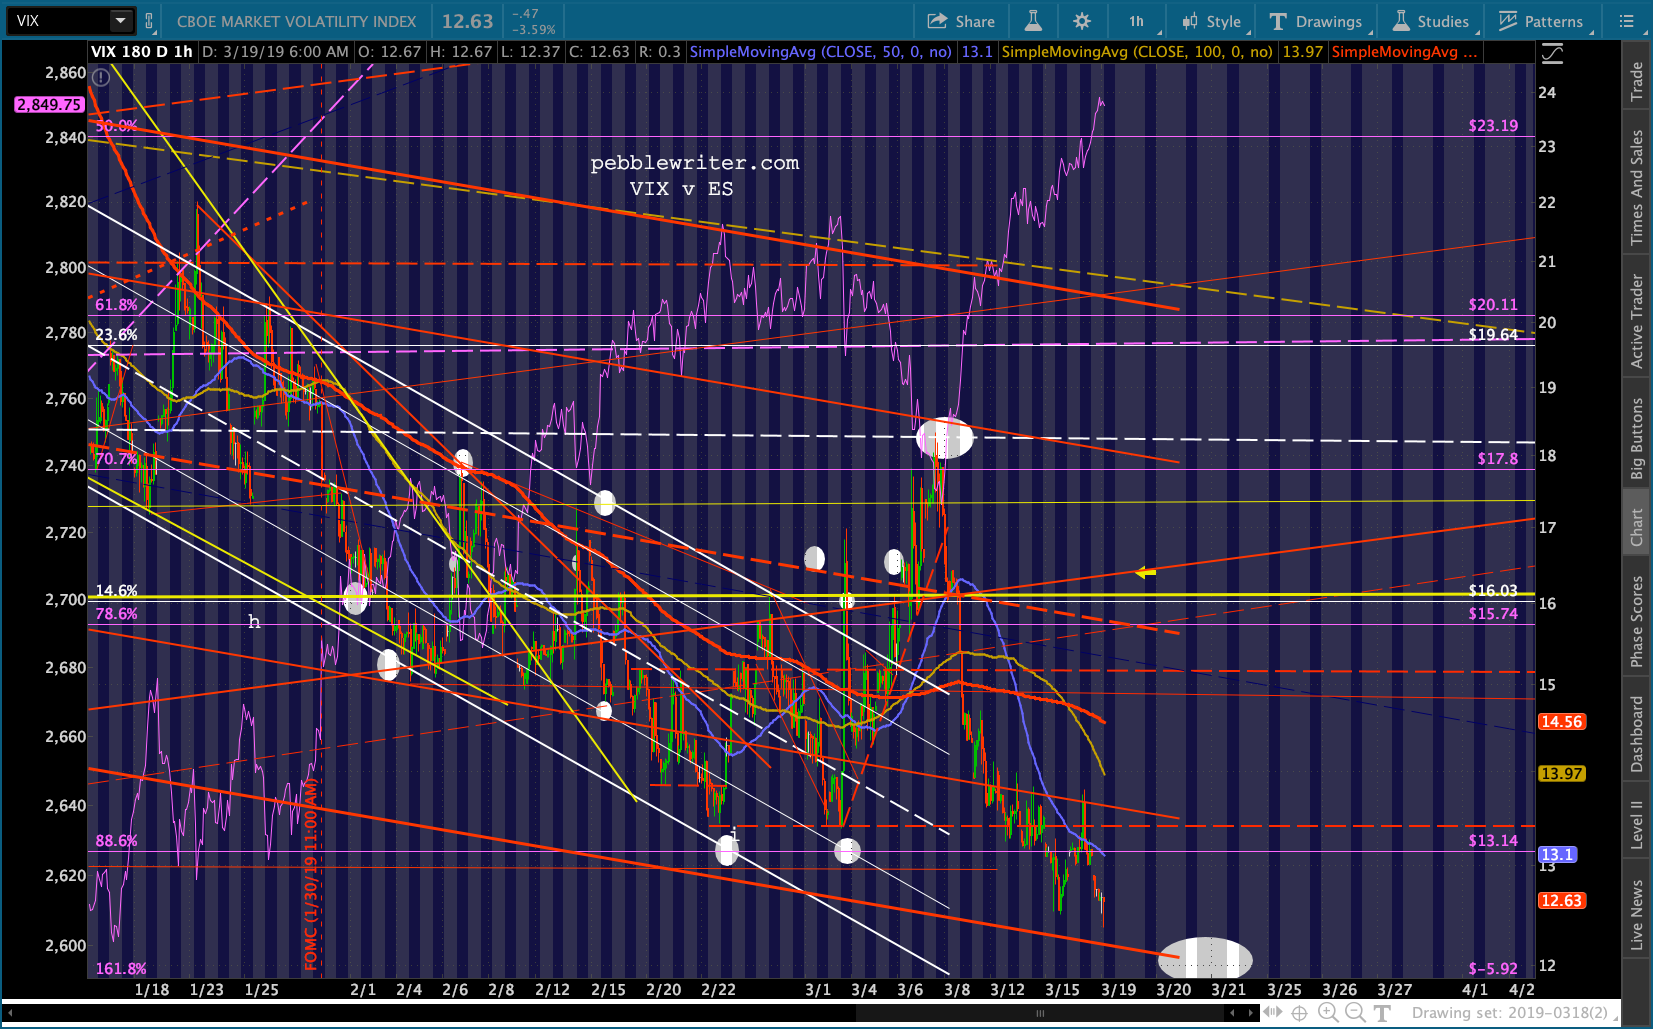 This leaves SPX’s targets unchanged. The yellow channel midline at 2844 is the first line of resistance. If SPX can push through, the .886 awaits at 2873.16.
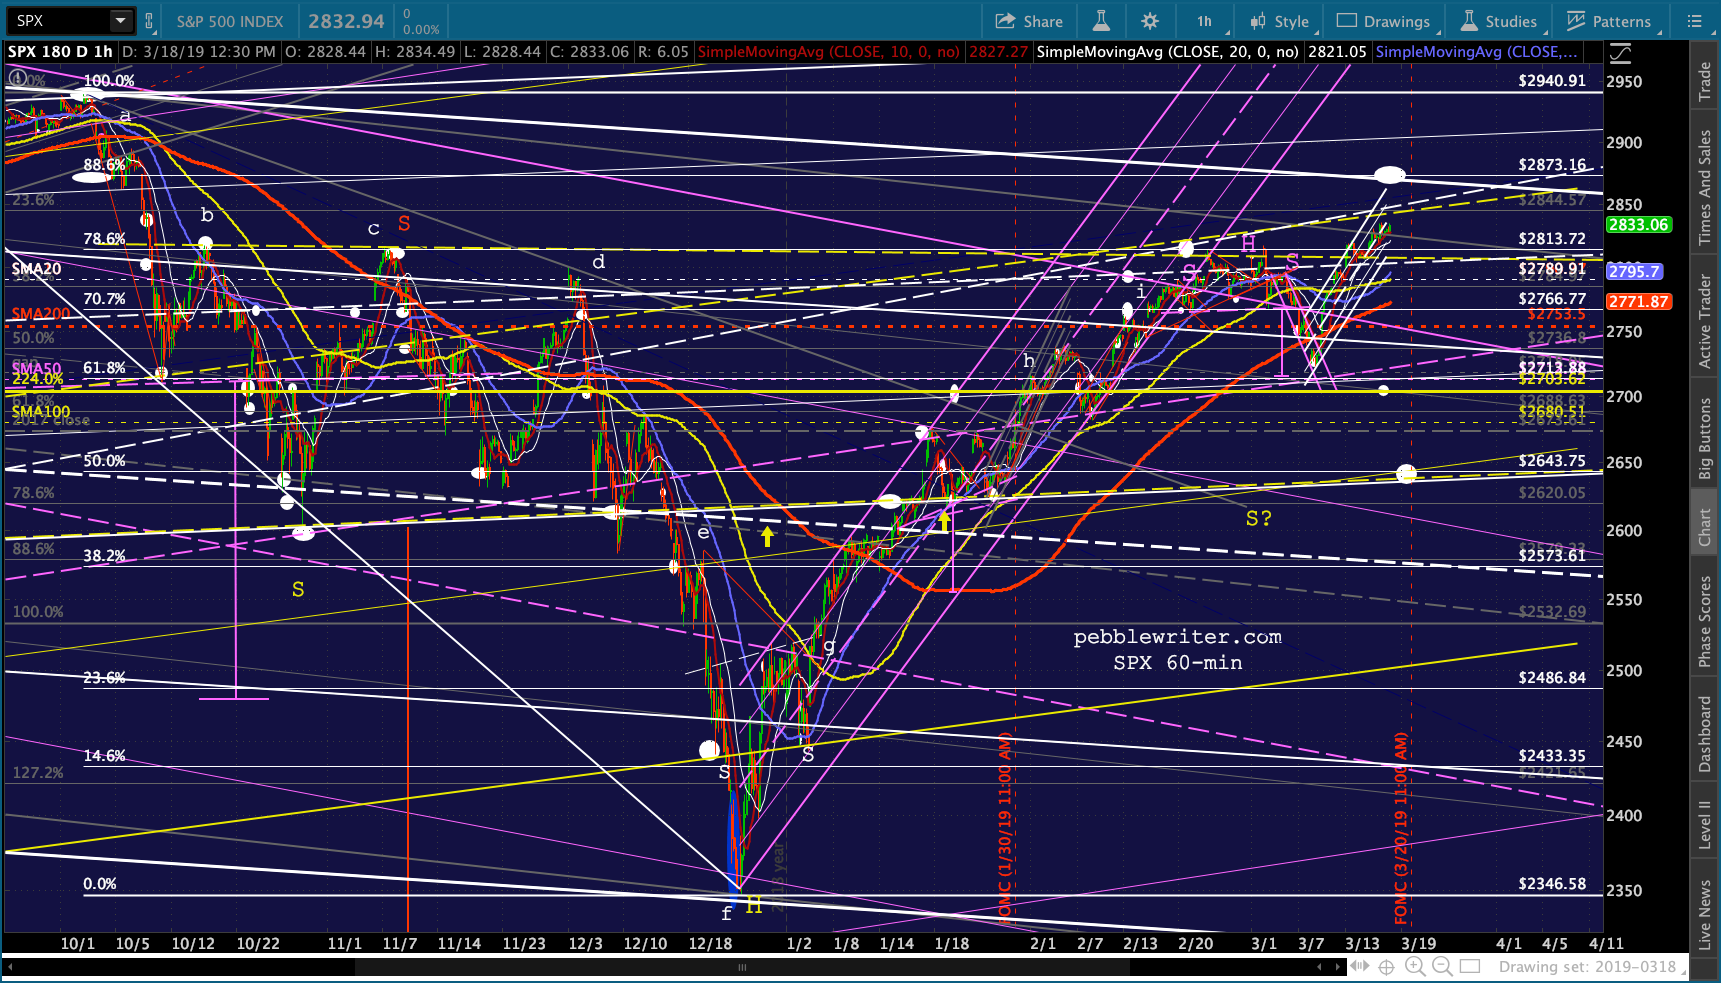 The rest of the charts…
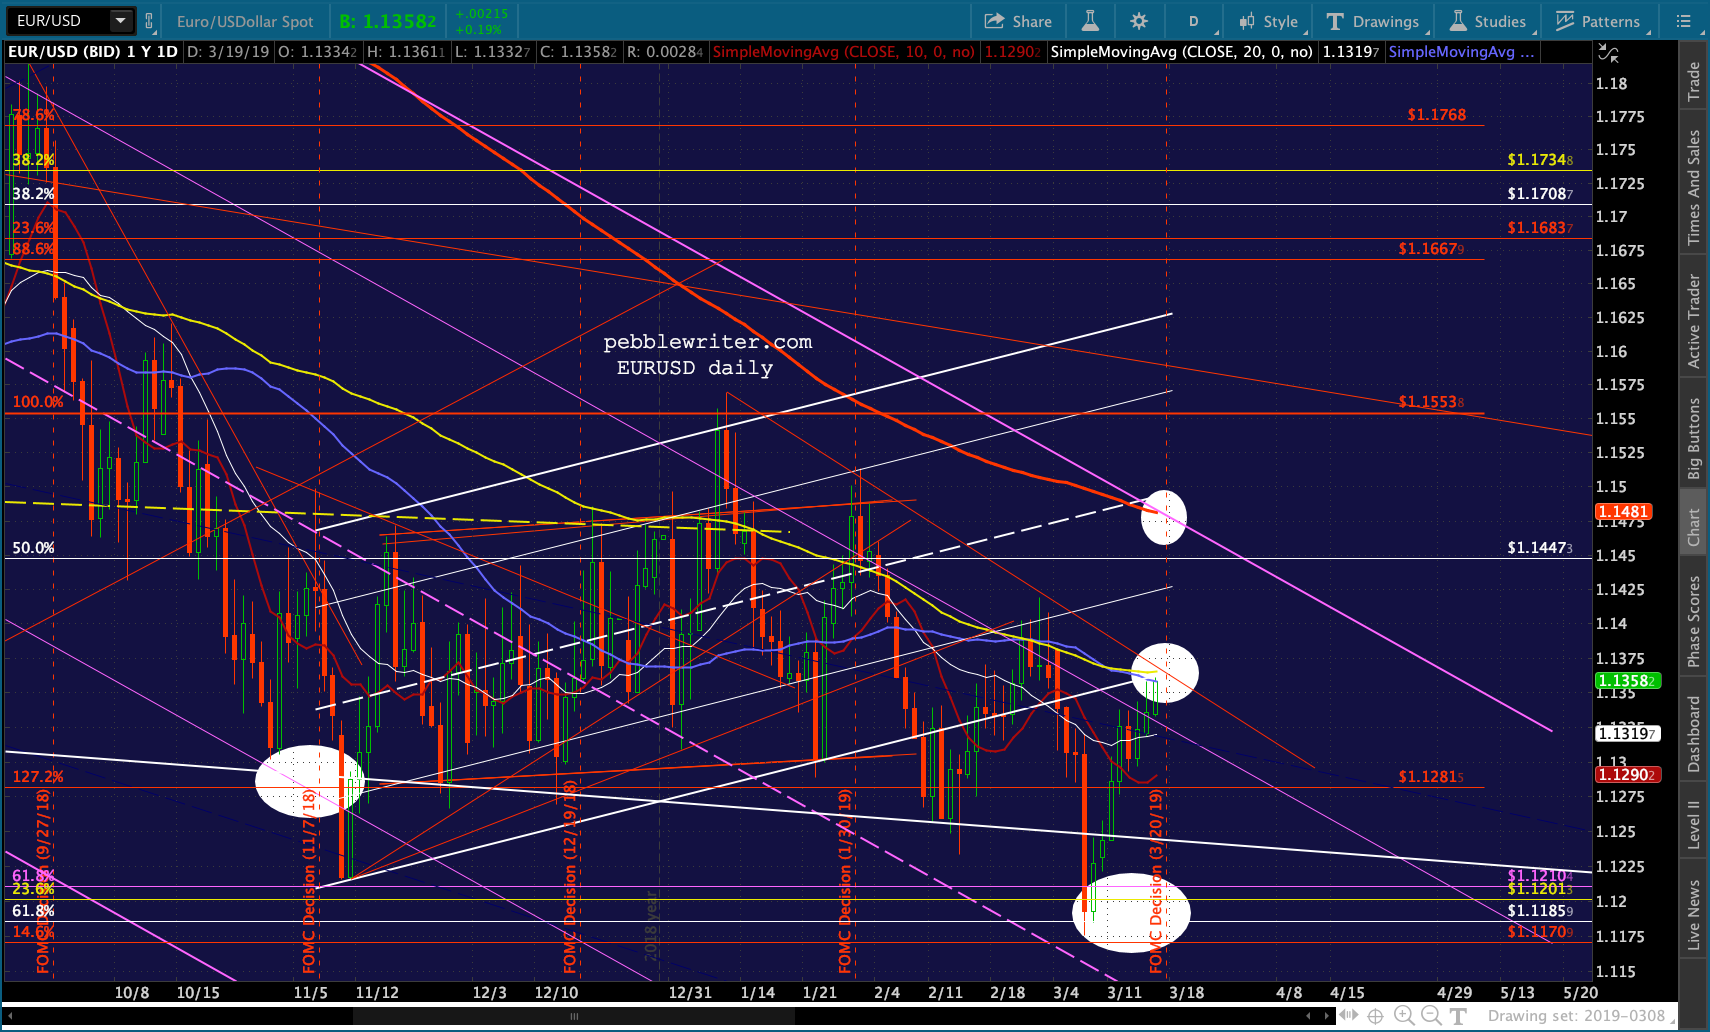
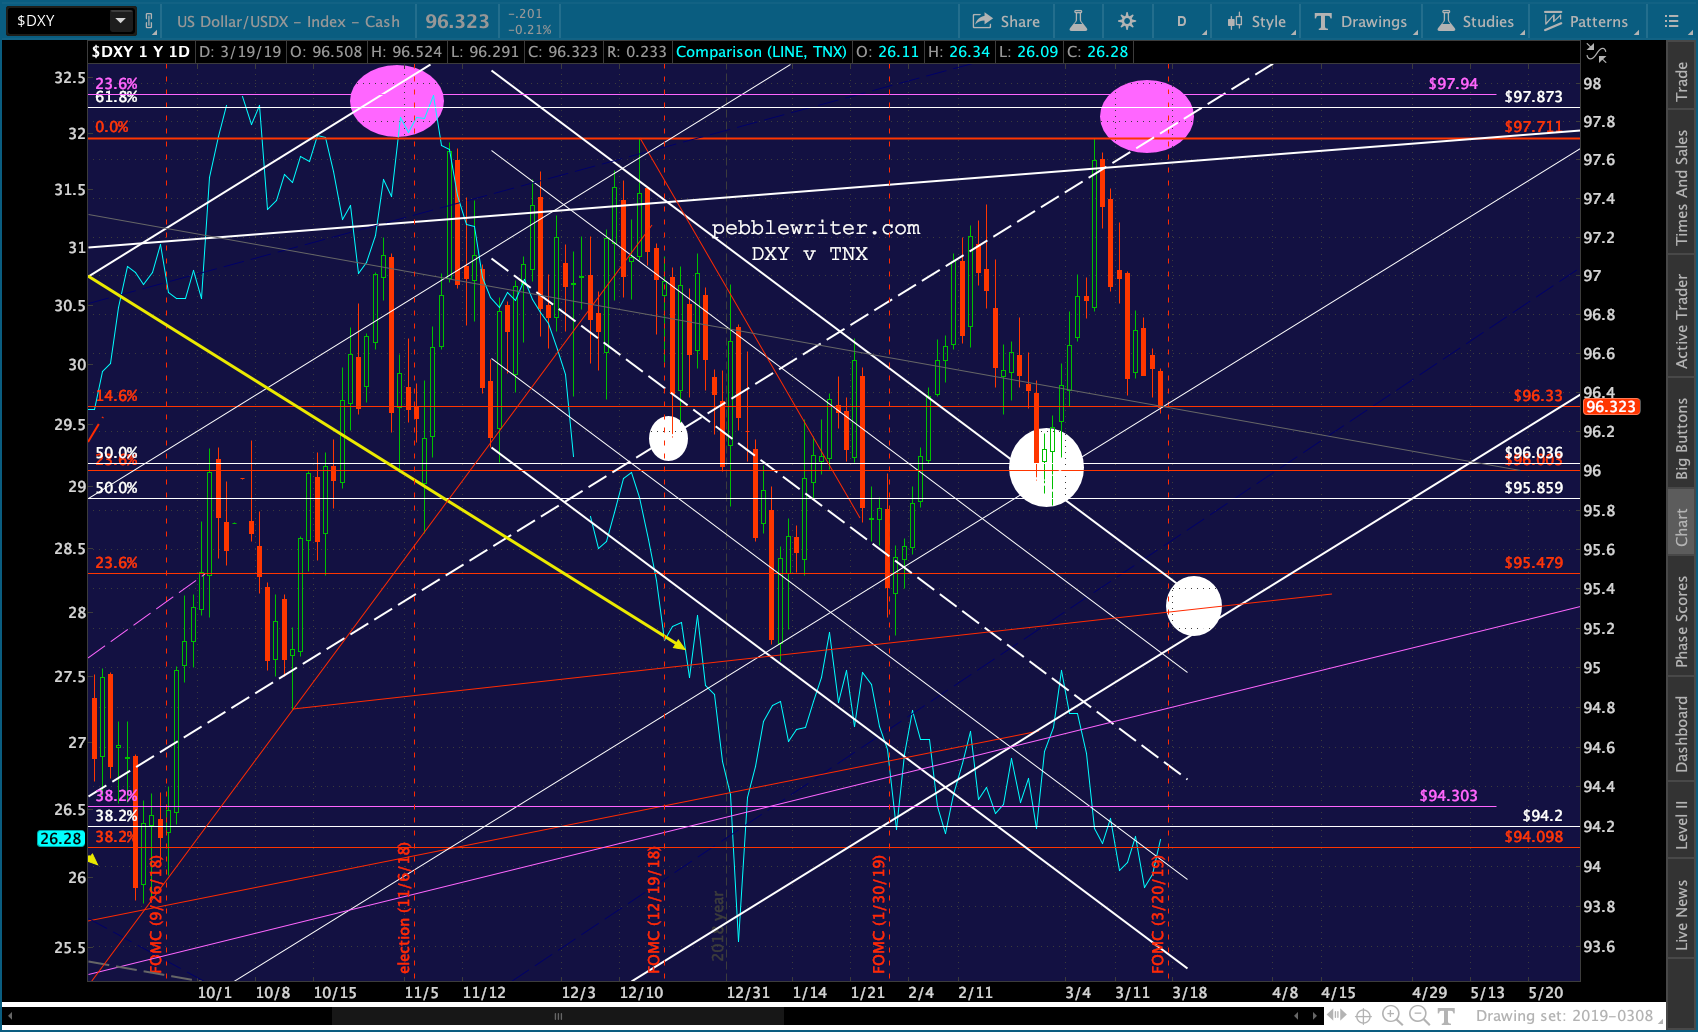
EURUSD is hinting at a breakout to the SMA200 which would align with DXY’s backtest.
 USDJPY’s weekly chart shows some very important decisions coming up.
 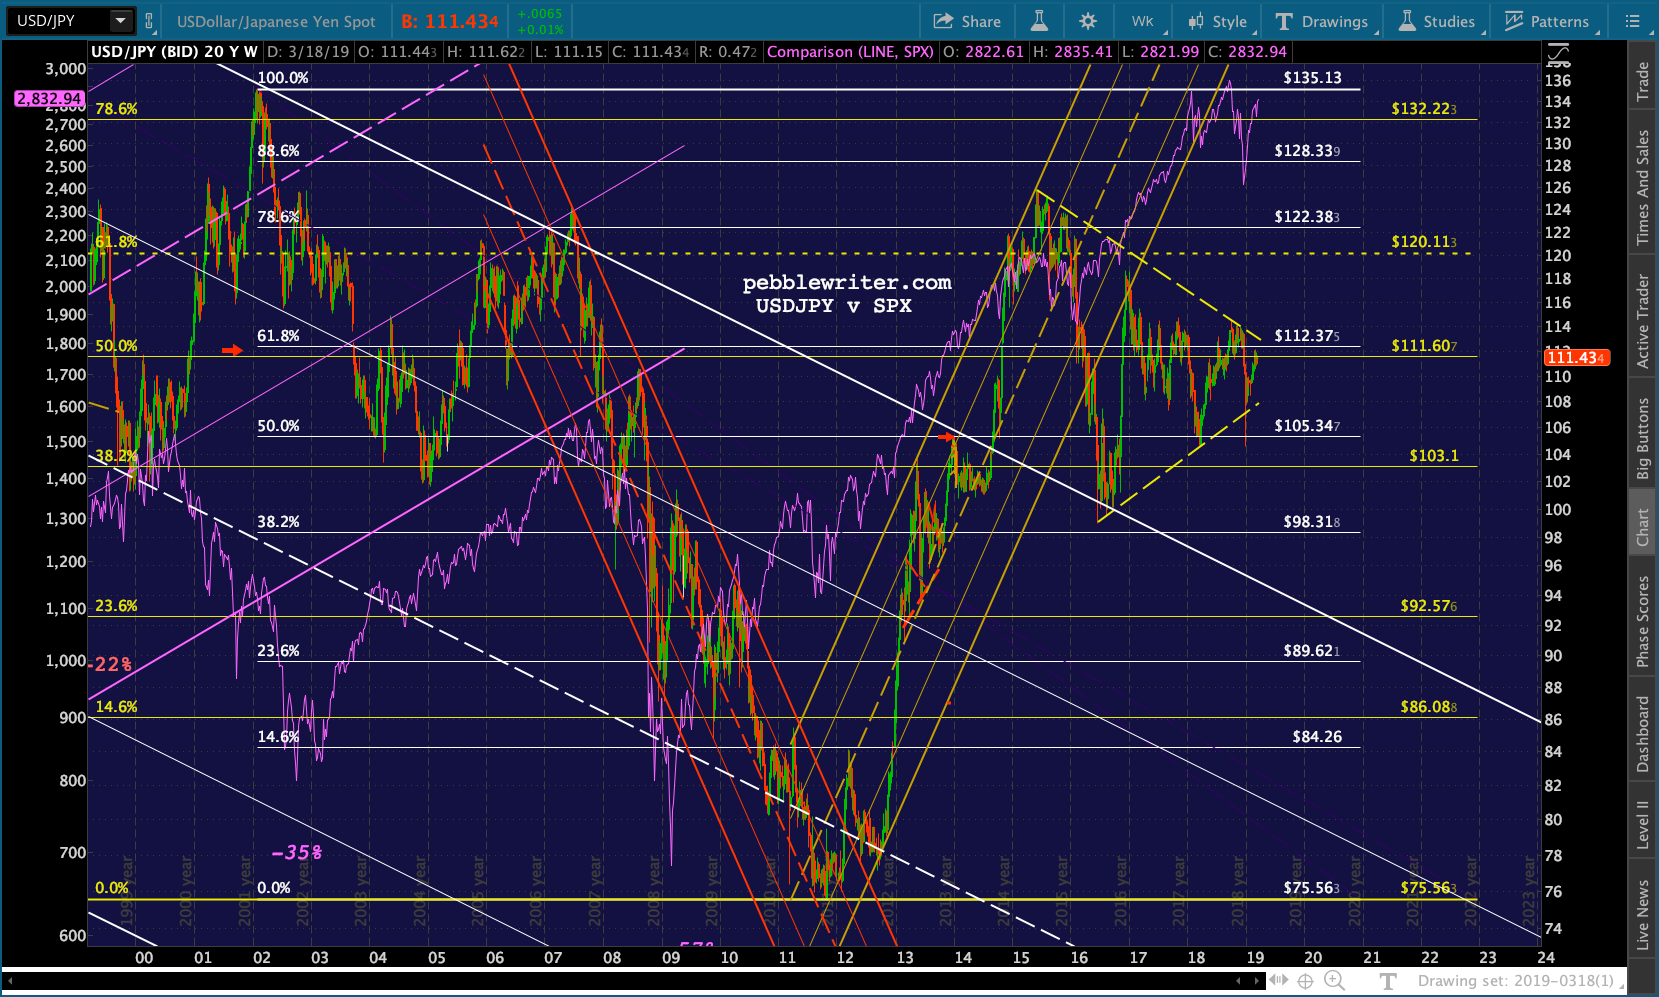 And, notes are still in a holding pattern, with our targets still within easy striking distance — possibly after tomorrow’s Fed announcement.
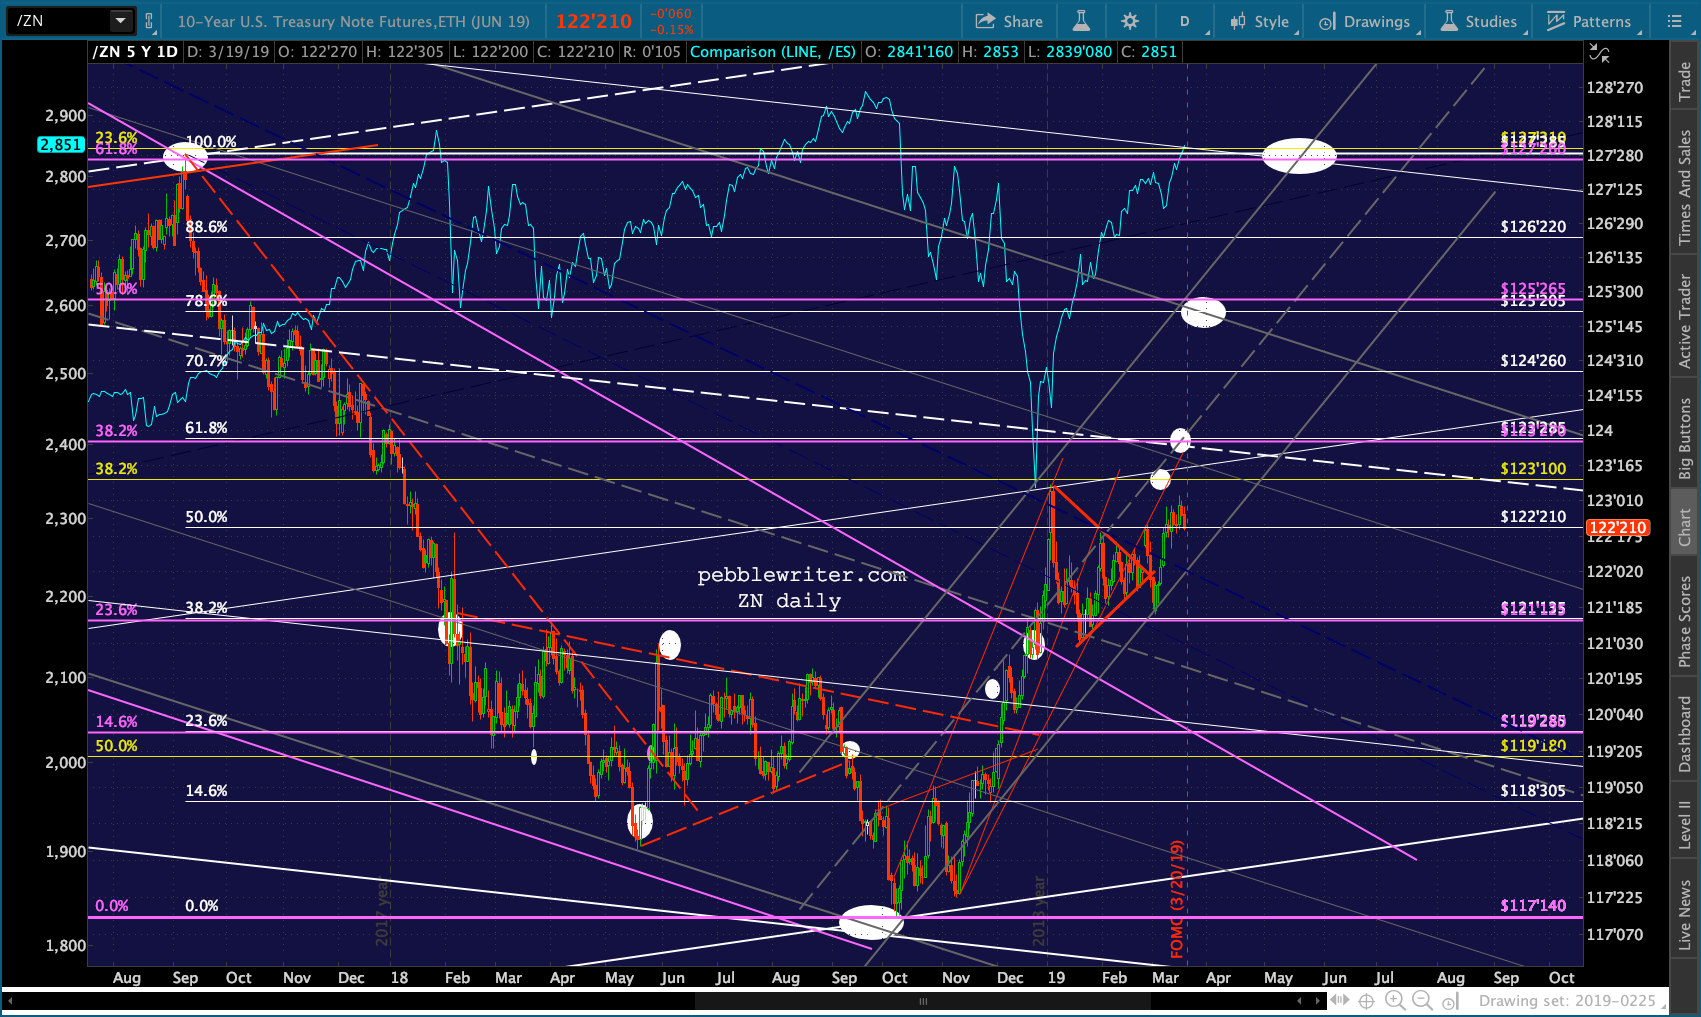 GLTA.
GLTA.