

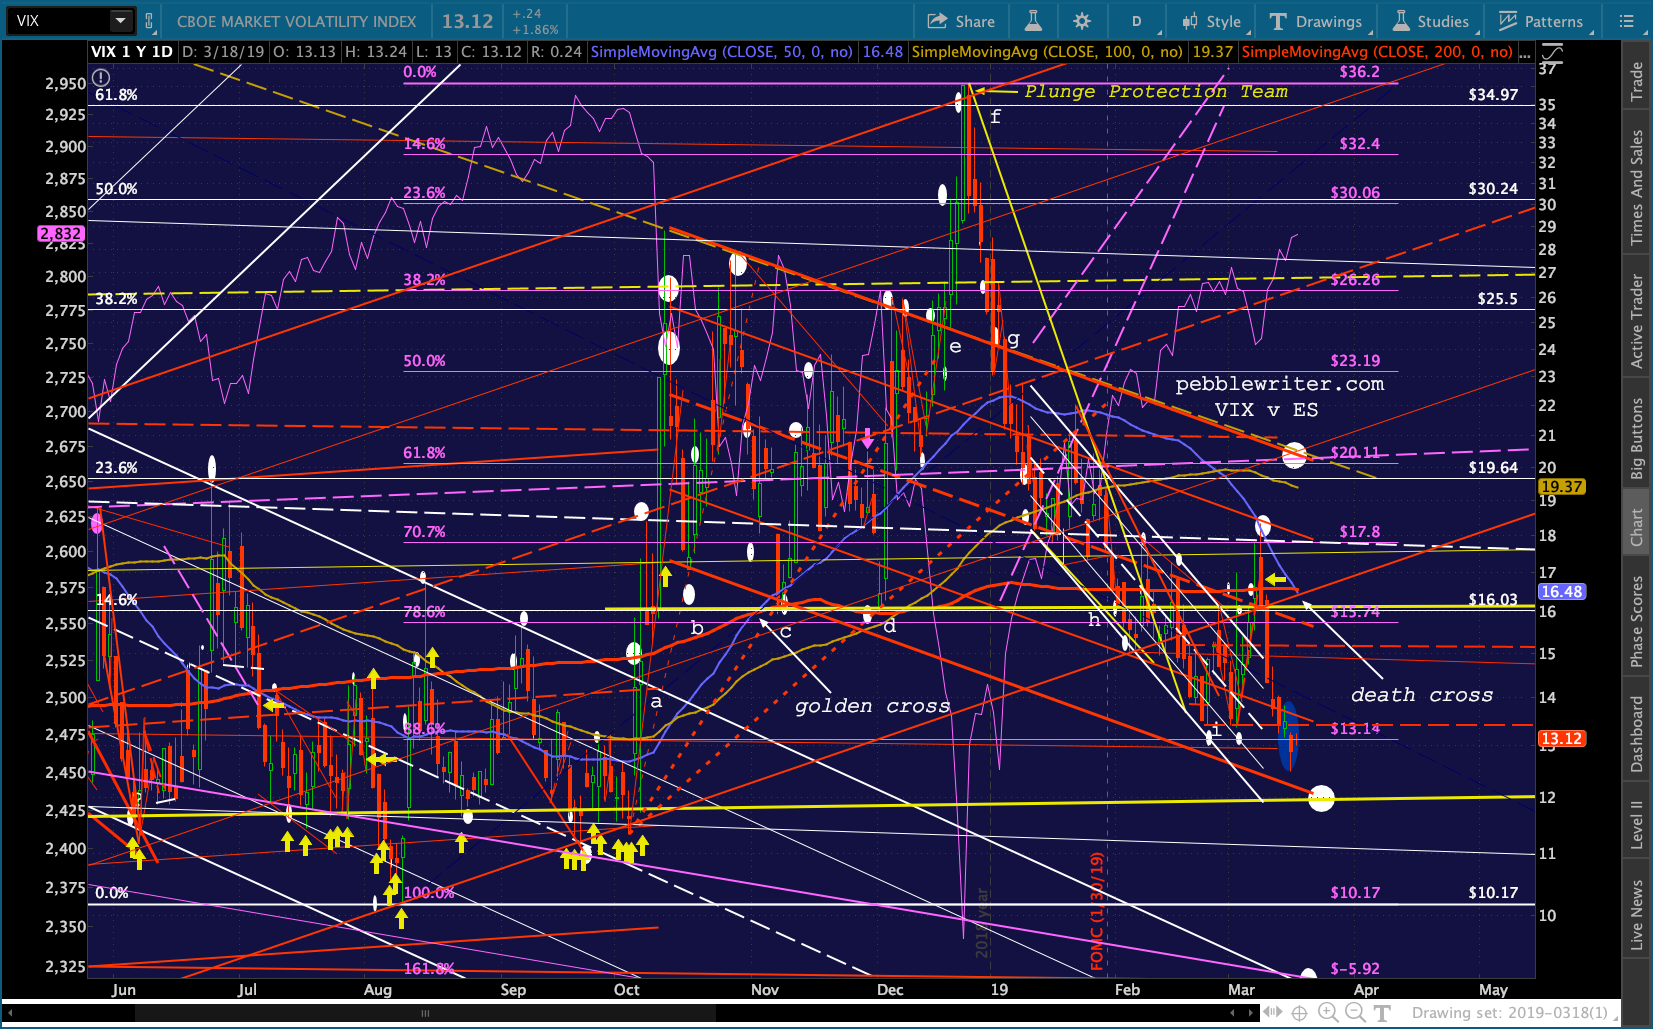
This morning, VIX’s 50-DMA passed below its 200-DMA — a death cross. If it holds, this marks the end of the period following the golden cross on Nov 1. For the uninitiated, a death cross is typically bearish for VIX, bullish for stocks.
We must use a qualifier because death and golden crosses in VIX are notoriously susceptible to head fakes. Of all the times the 50-DMA (blue line) dropped below the 200-DMA (red line) in the chart below, every single one resulted in a continuation of the bullish trend. But, not all resulted in immediate spikes higher.
Contrast that with golden crosses, where the 50-DMA rose up through the 200-DMA. Every one was followed by a sharp and rather immediate drop in stocks, usually resulting in an important bottom within a few days. The head fakes are labeled with white arrows — with the most notable being the period following the US presidential election in Nov 2016 when (among other actions) VIX was hammered in the midst of a 4.5% selloff in futures in order to prevent a correction. The ruse resulted in a class melt-up that lasted until Feb 2018.
There was one notable head fake which resulted in stocks dropping. In December 2015, the spread narrowed to as little as 0.12 over the last several weeks of the year. When the two finally diverged again, SPX plunged 271 points (13%.) Interestingly, the plunge occurred after SPX experienced its own golden cross head fake beginning Dec 24.
Investors have been looking for a sign as to whether or not the bounce which began with the PPT’s latest maneuver on Dec 24 can continue. VIX’s death cross is as good a signal as we’ll find — certainly more important than BA.
Although it represents about 11% of the Dow, all it’s doing right now is signalling the algos to try harder to prop up the rest of the market.  continued for members…
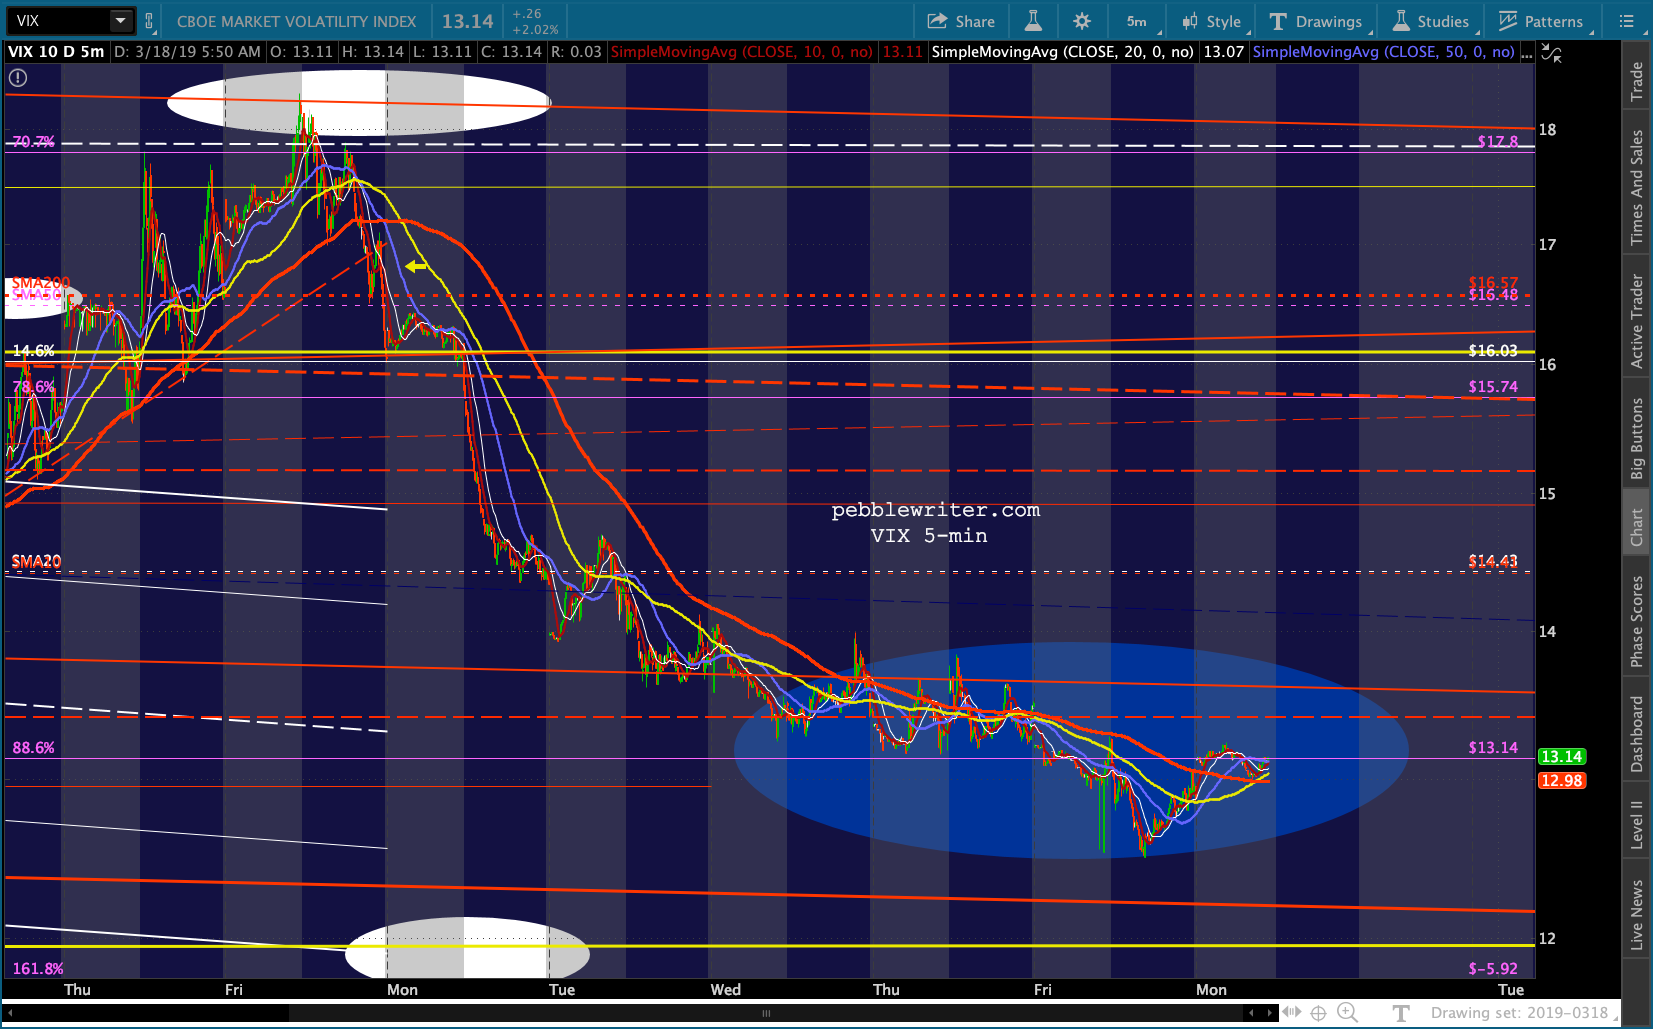
The detailed VIX charts: Note that VIX is sitting just below the latest “bullish” line in the sand – the .886.
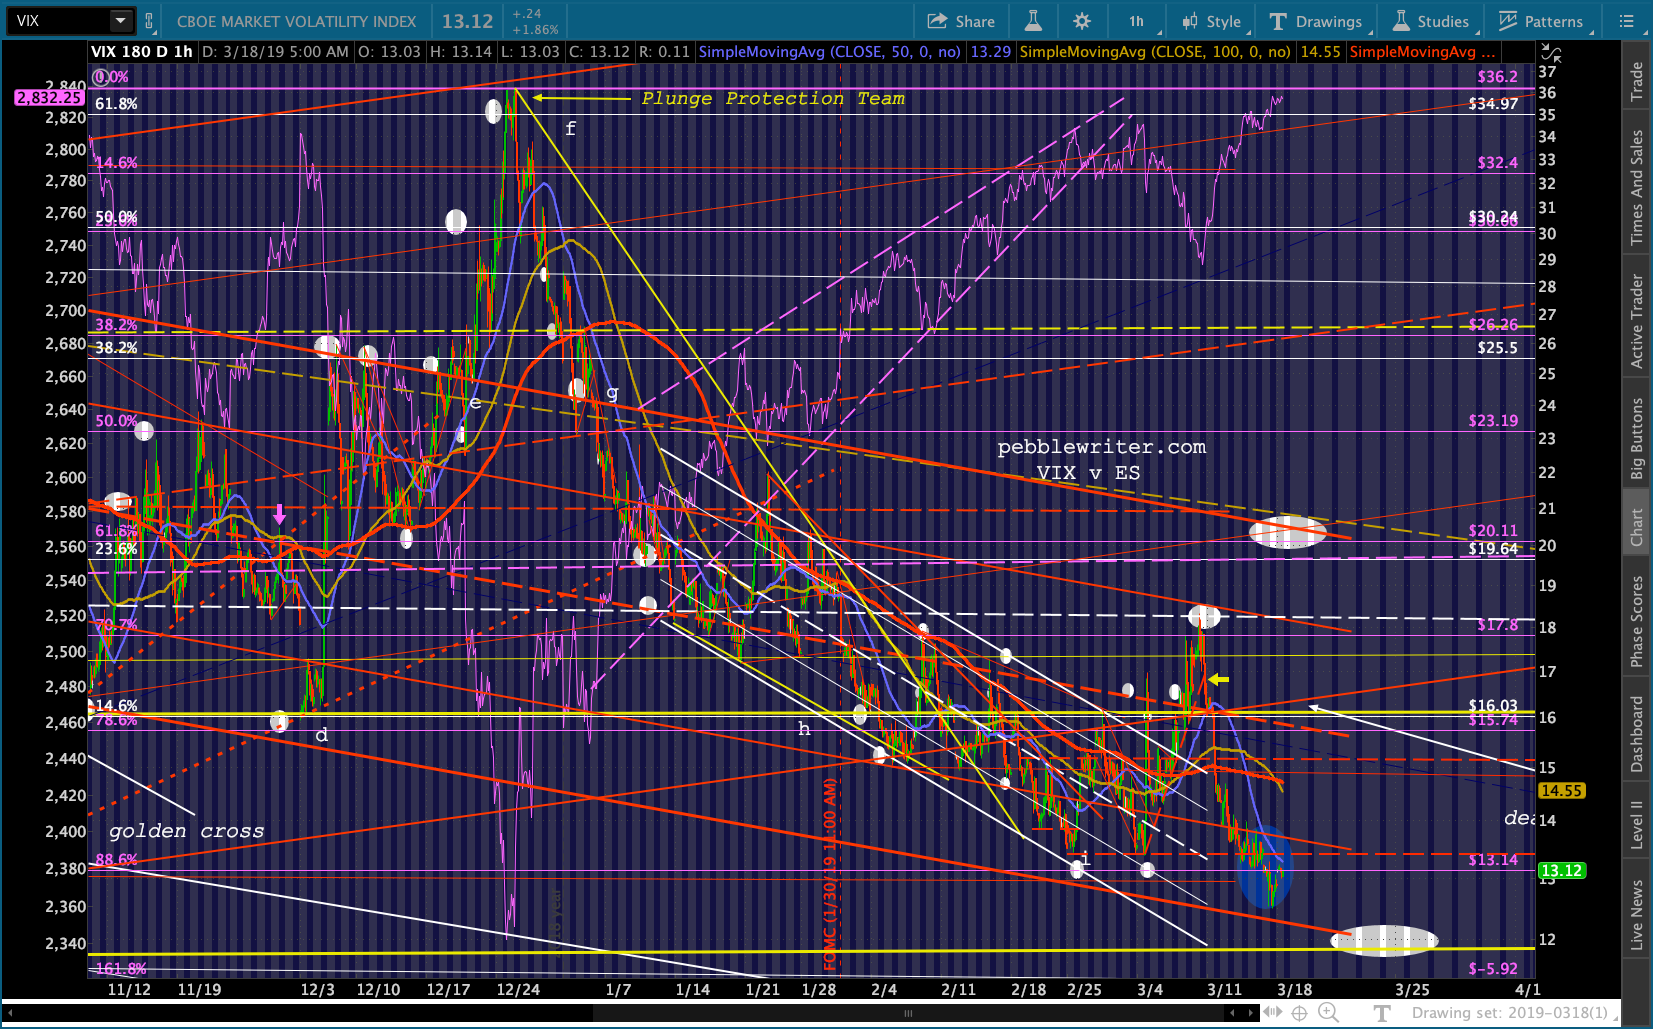
 And, SPX/ES… VIX turned the channel breakdowns into higher highs — with the logical upside target being the .886s, but with interim channel and fib targets in the way.
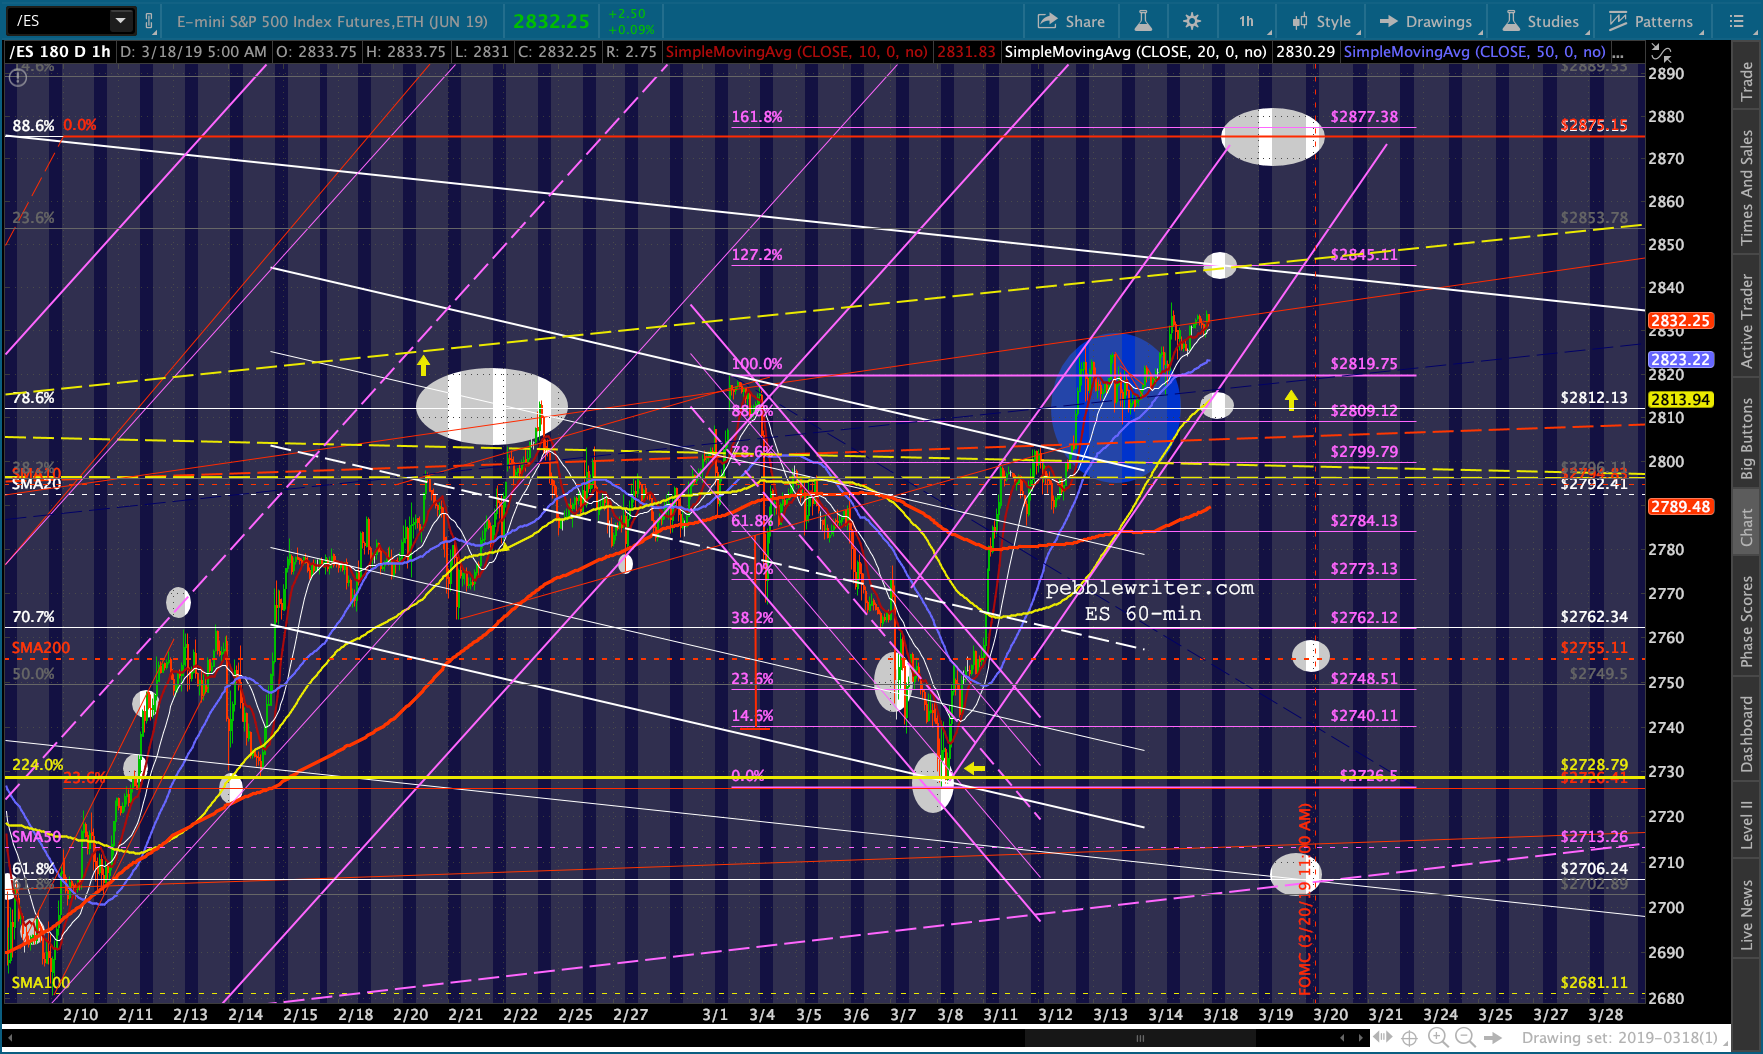
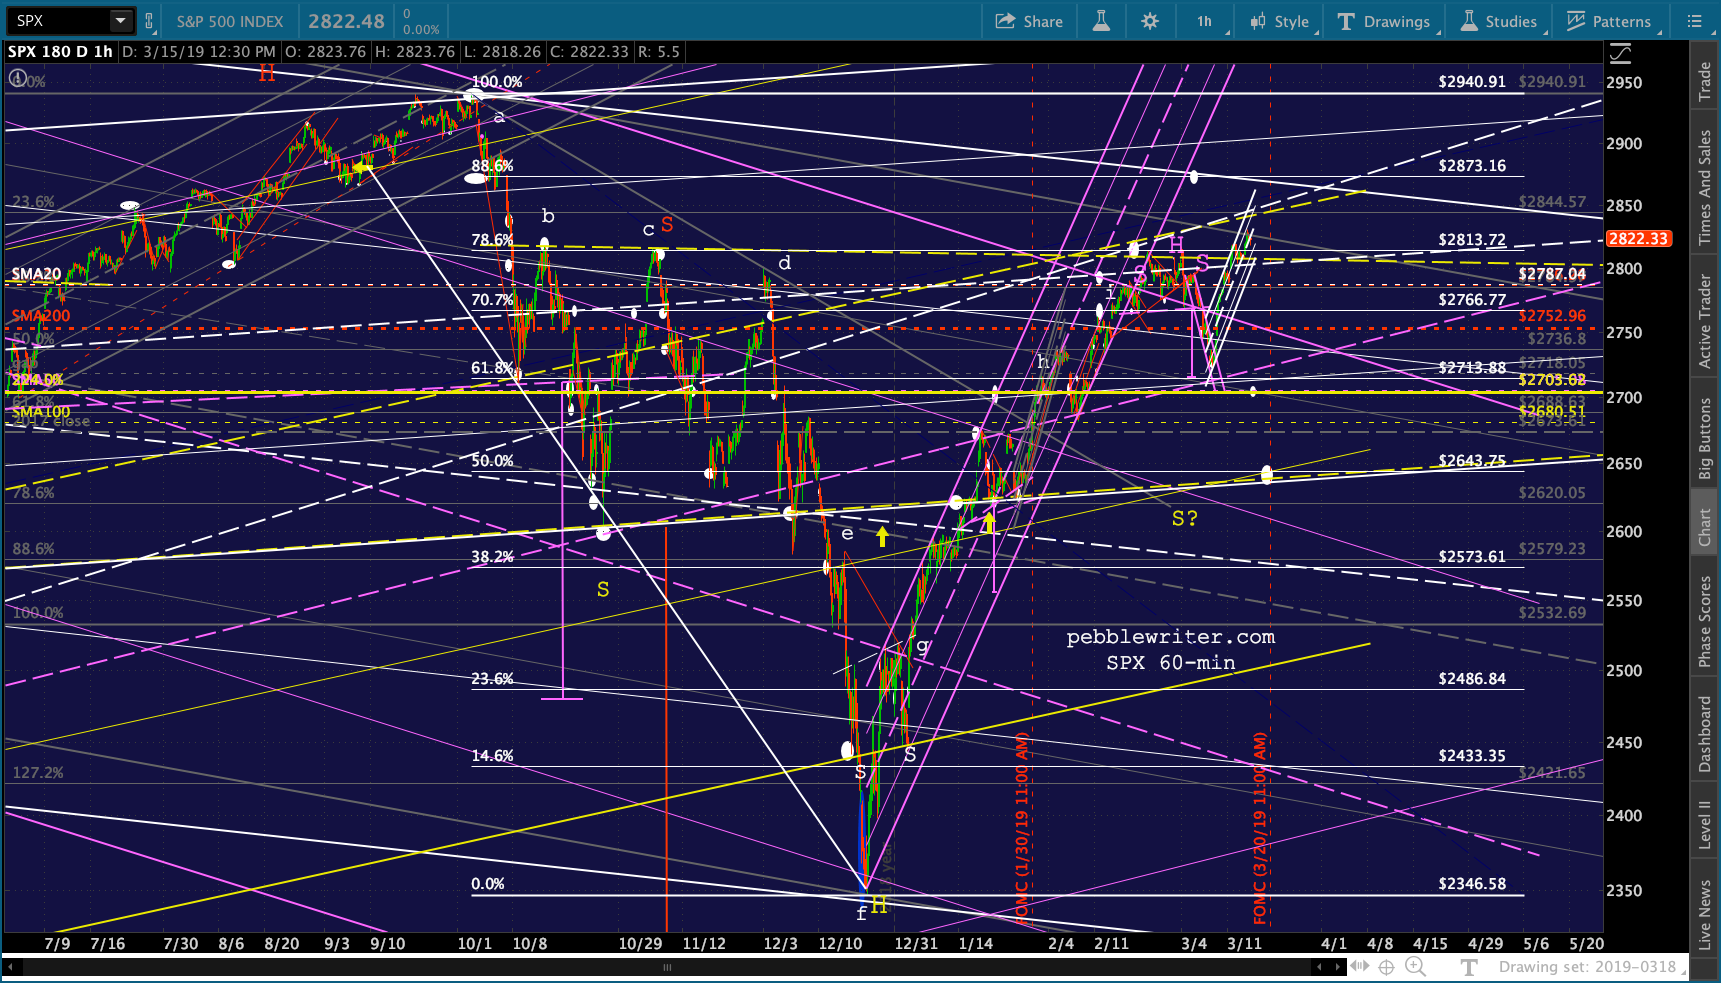 Been a while since I posted this chart. The thing that pops out the most to me is that the Feb push above 2703 might have been a mistake. If SPX had reversed at 2703, it would have meant a drop from the .786 channel line to the .236 channel line at 2138 — a normal reversal.
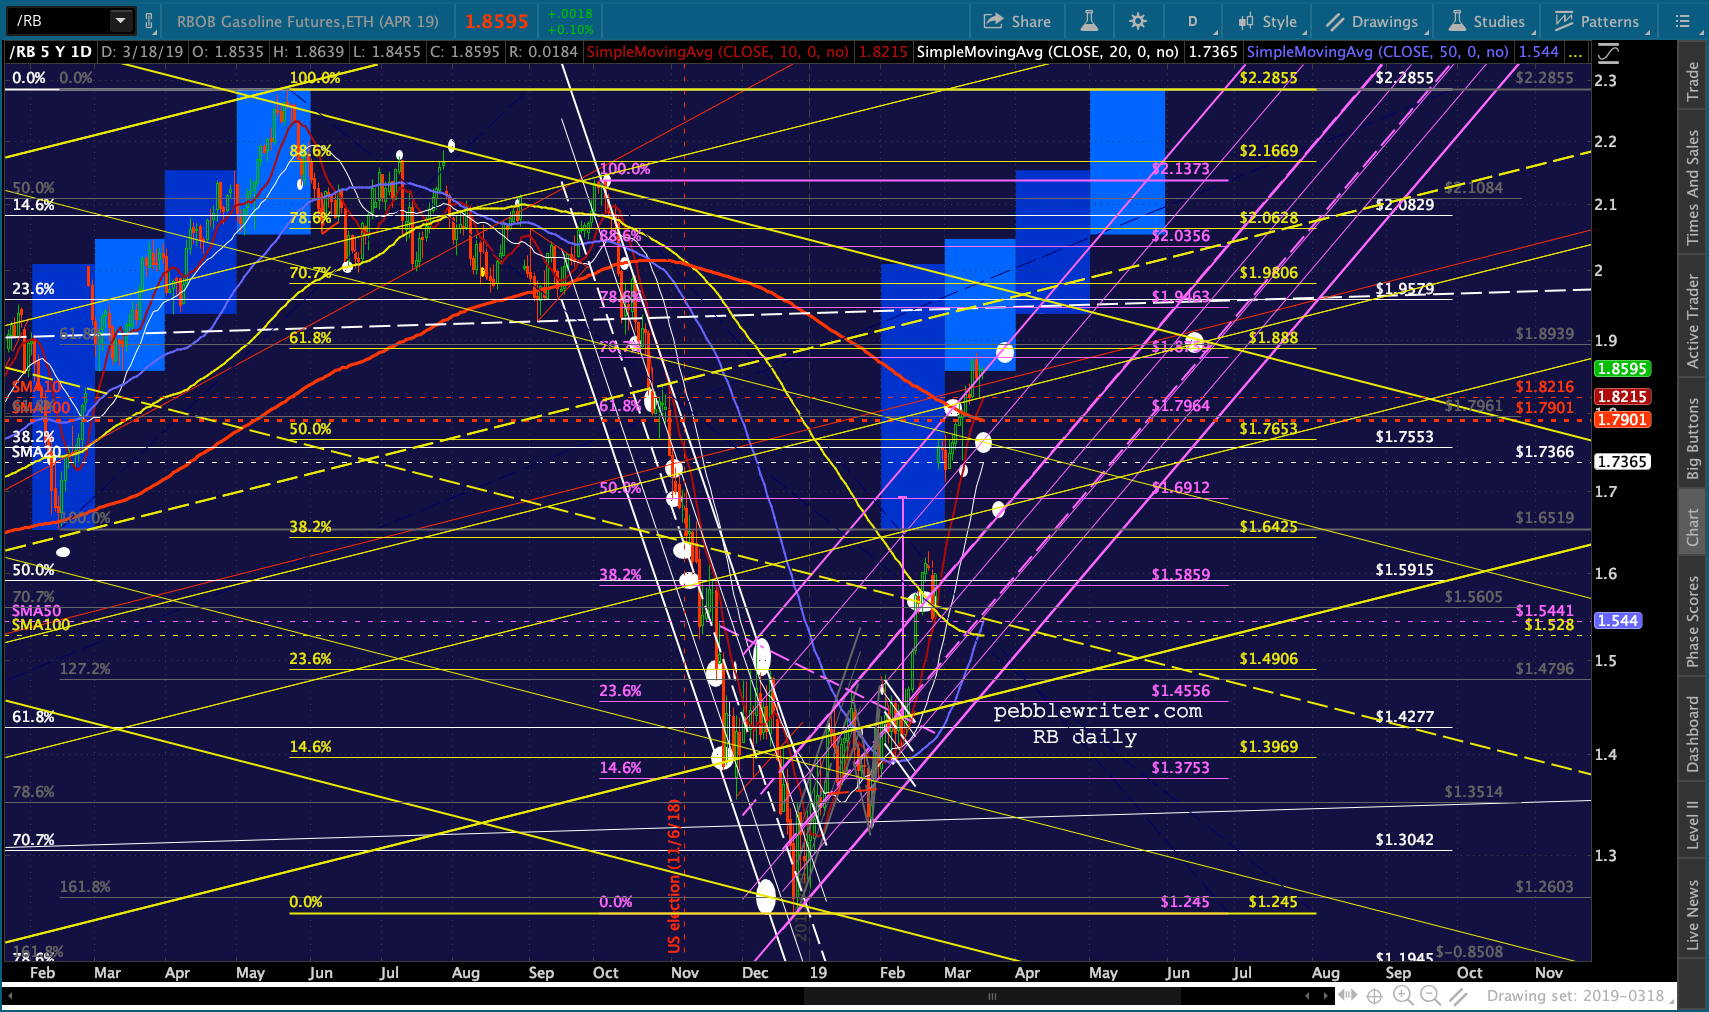
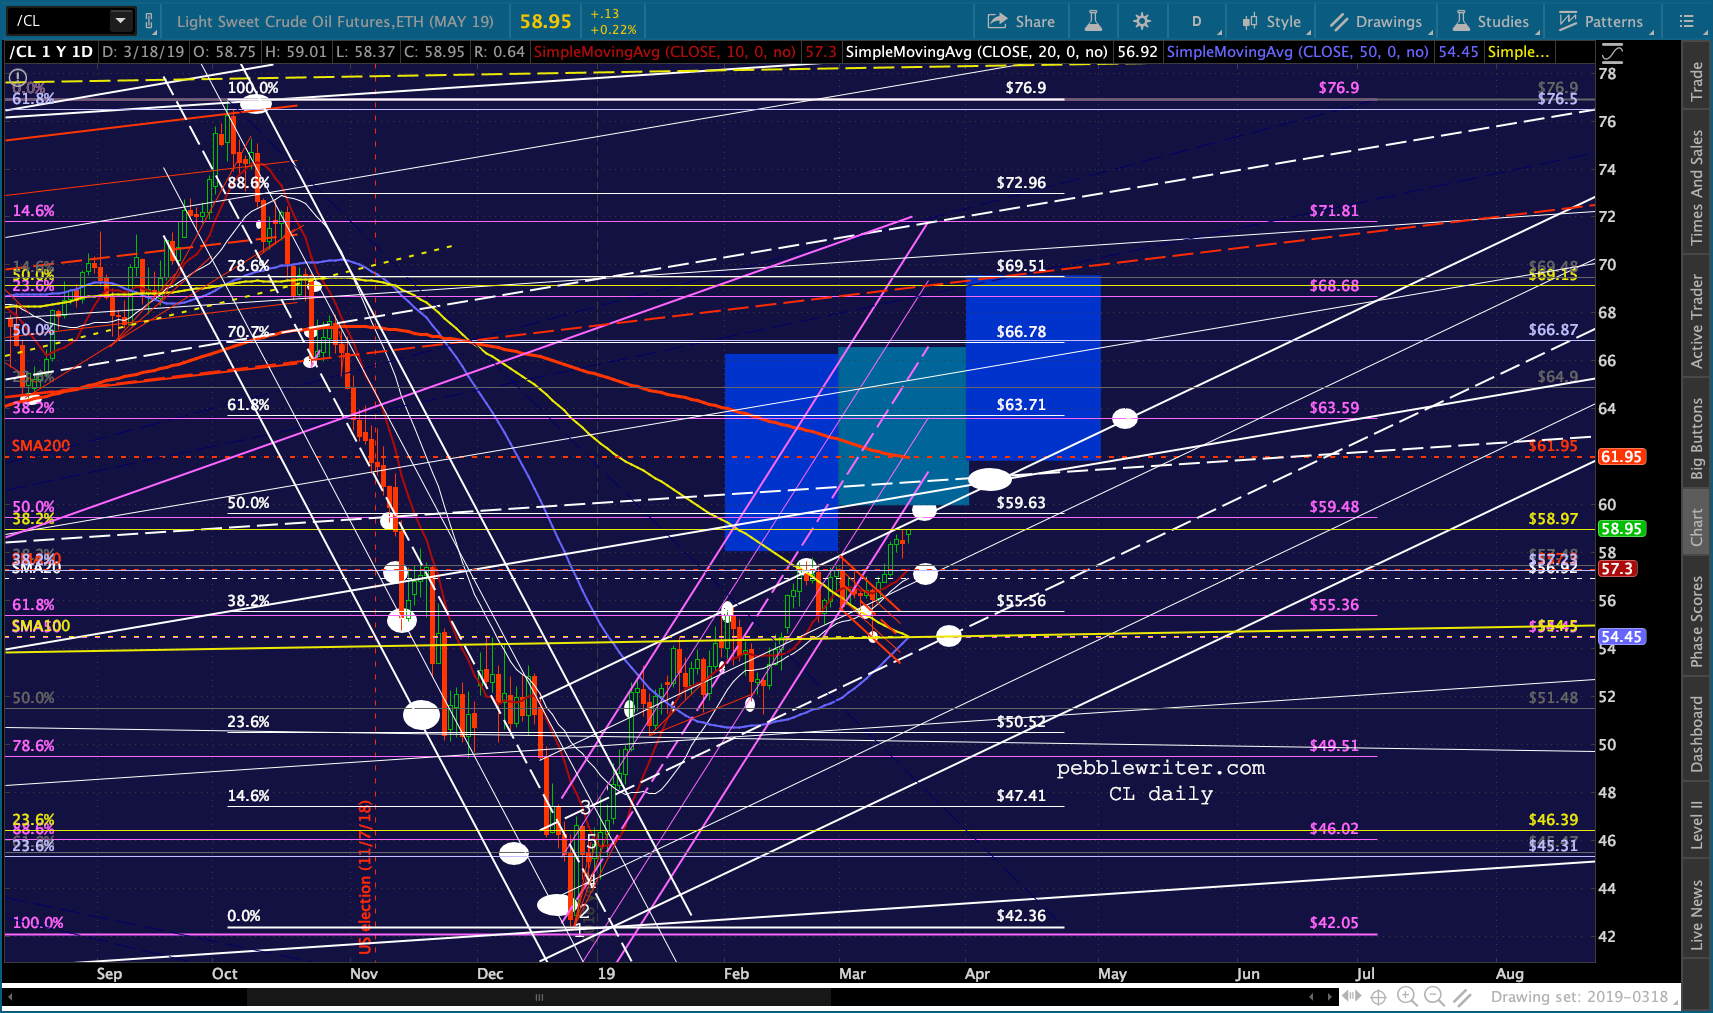
Interestingly, the points it did end up shedding would have been almost exactly the drop from 2703 to 2138. It makes me wonder if the script was rewritten by oil’s sudden pop out of its rising channel.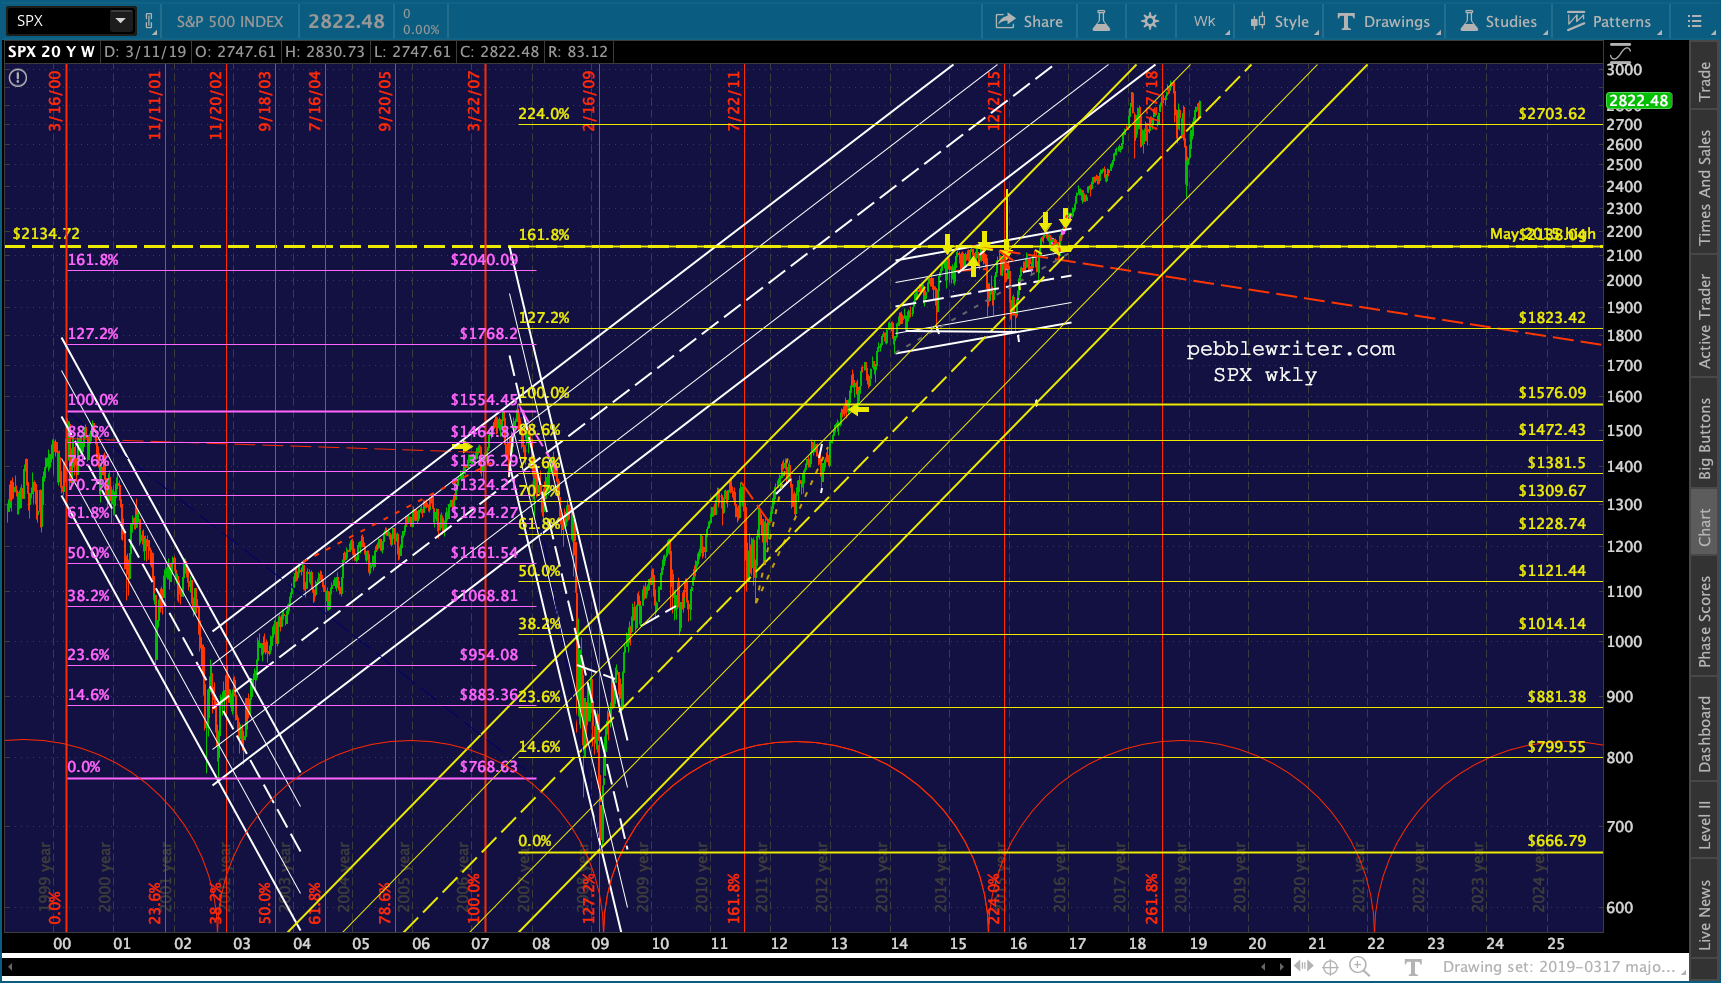 Today, oil and gas are still inching higher even as they bump against their channel tops.
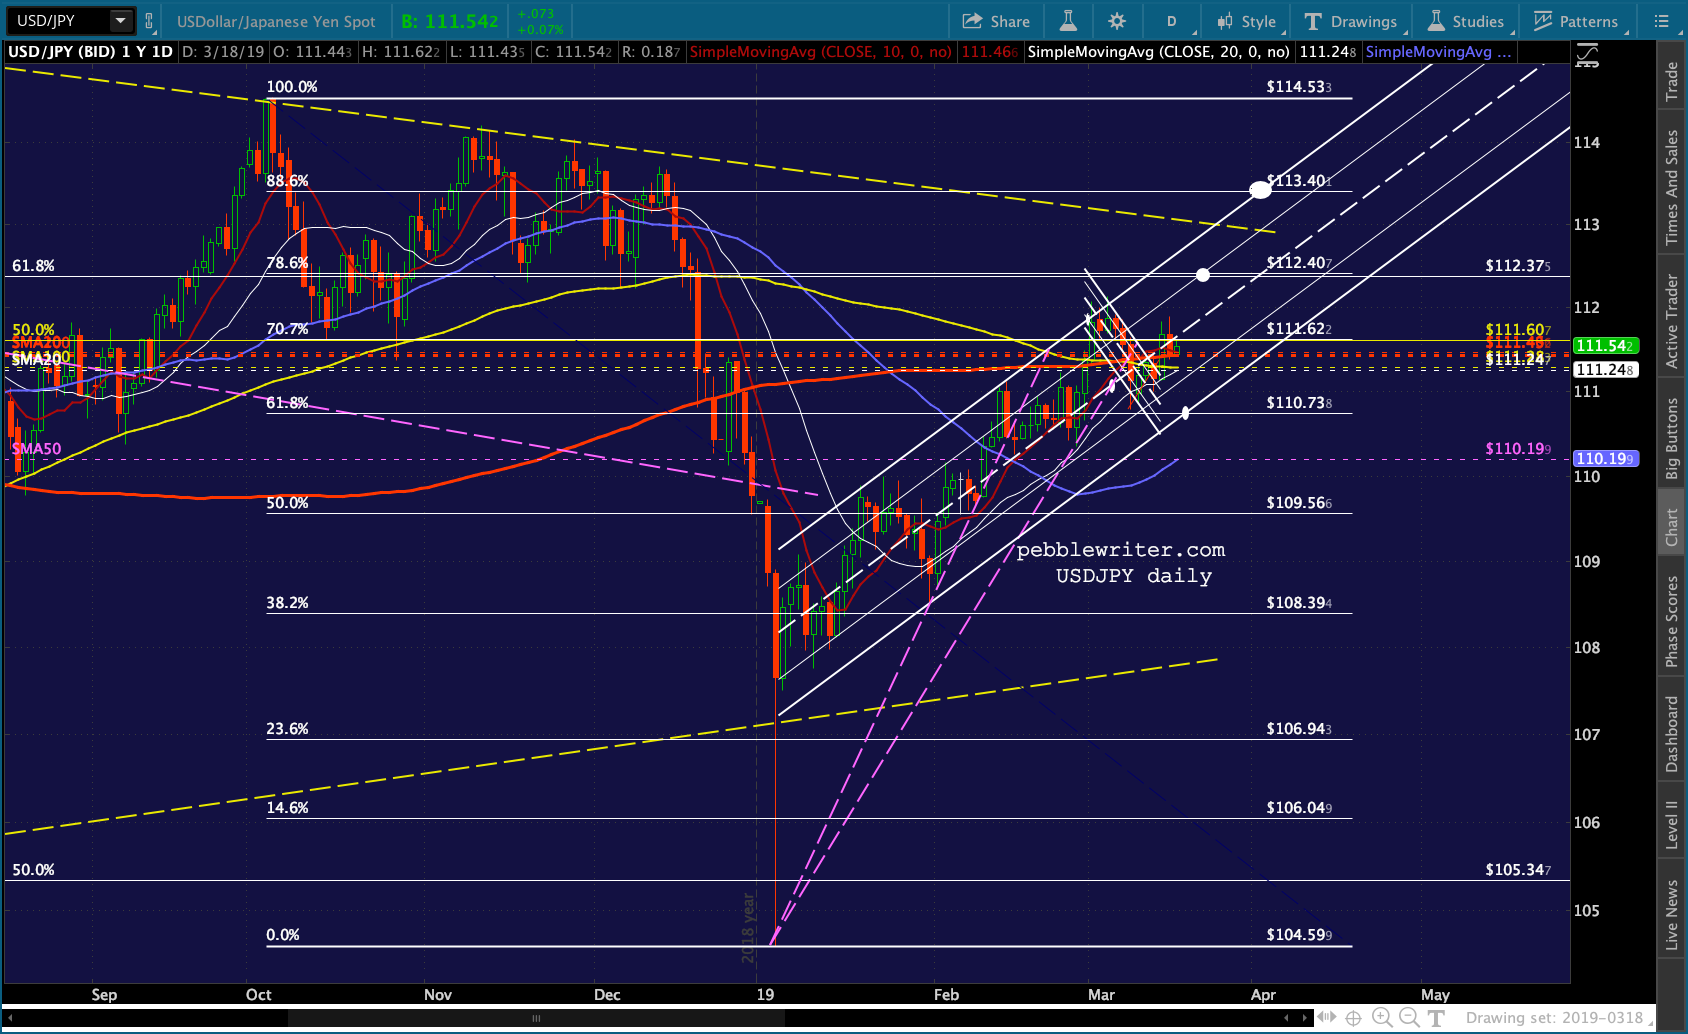
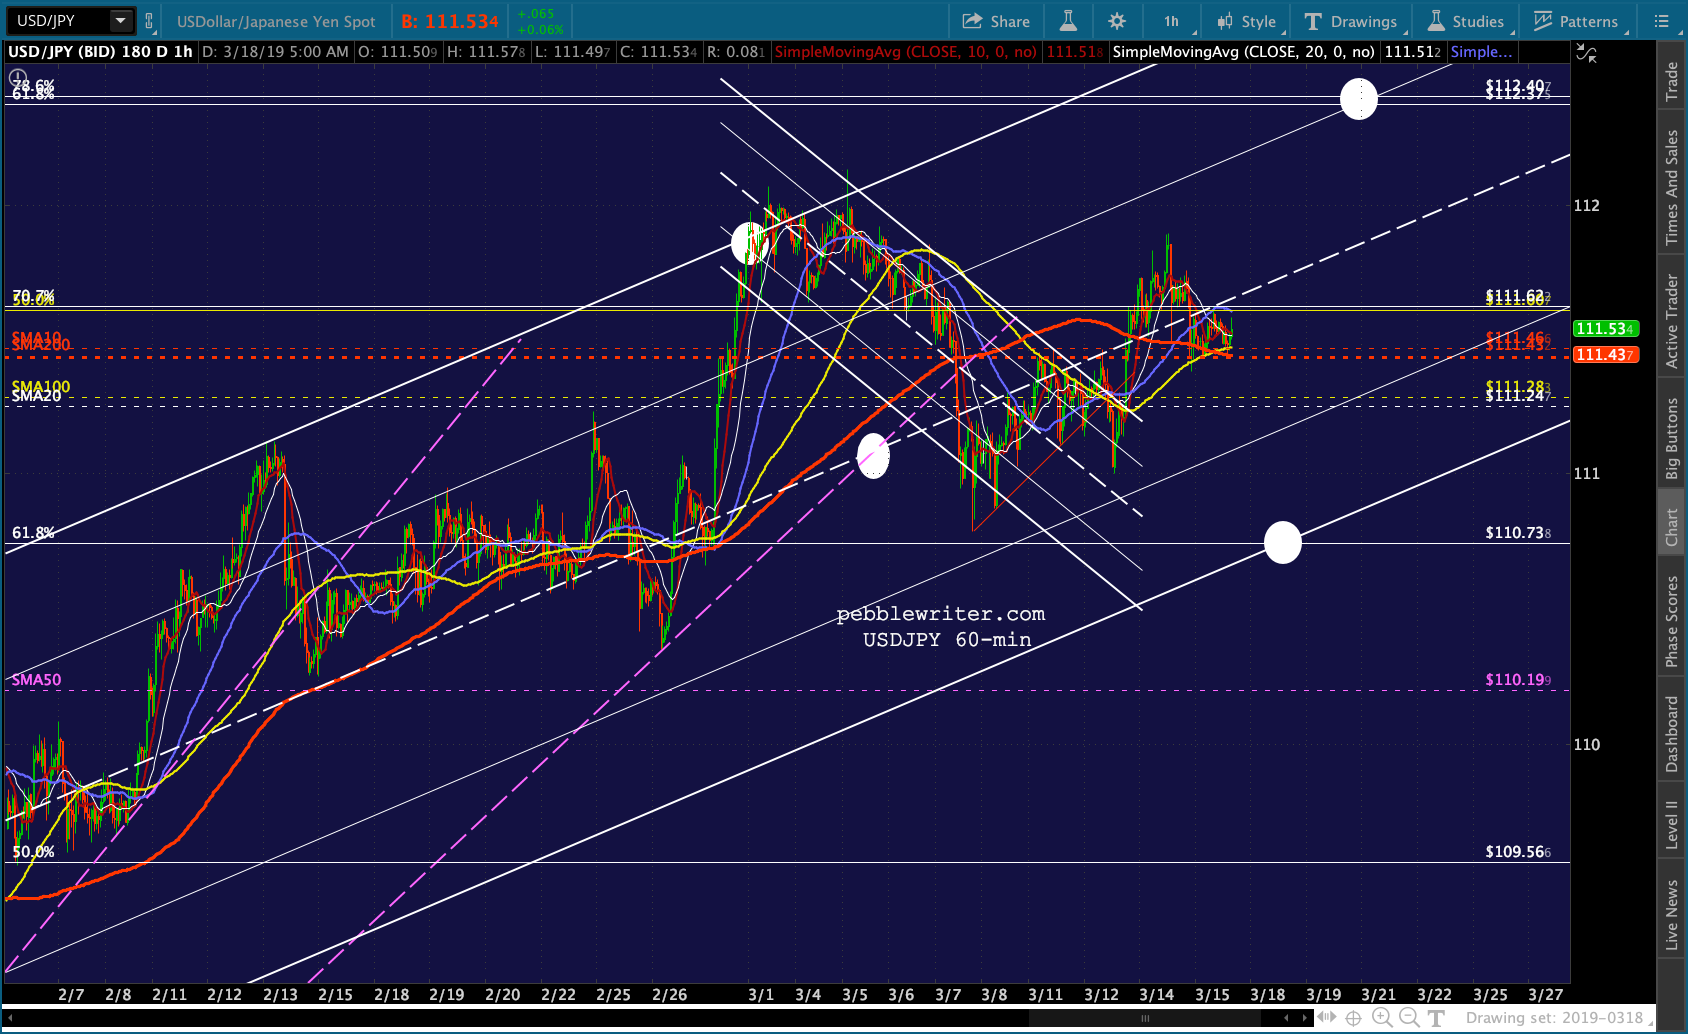
 The currency picture… though the dollar is weaker against the euro this morning (another backtest) the USDJPY is holding its SMA200.
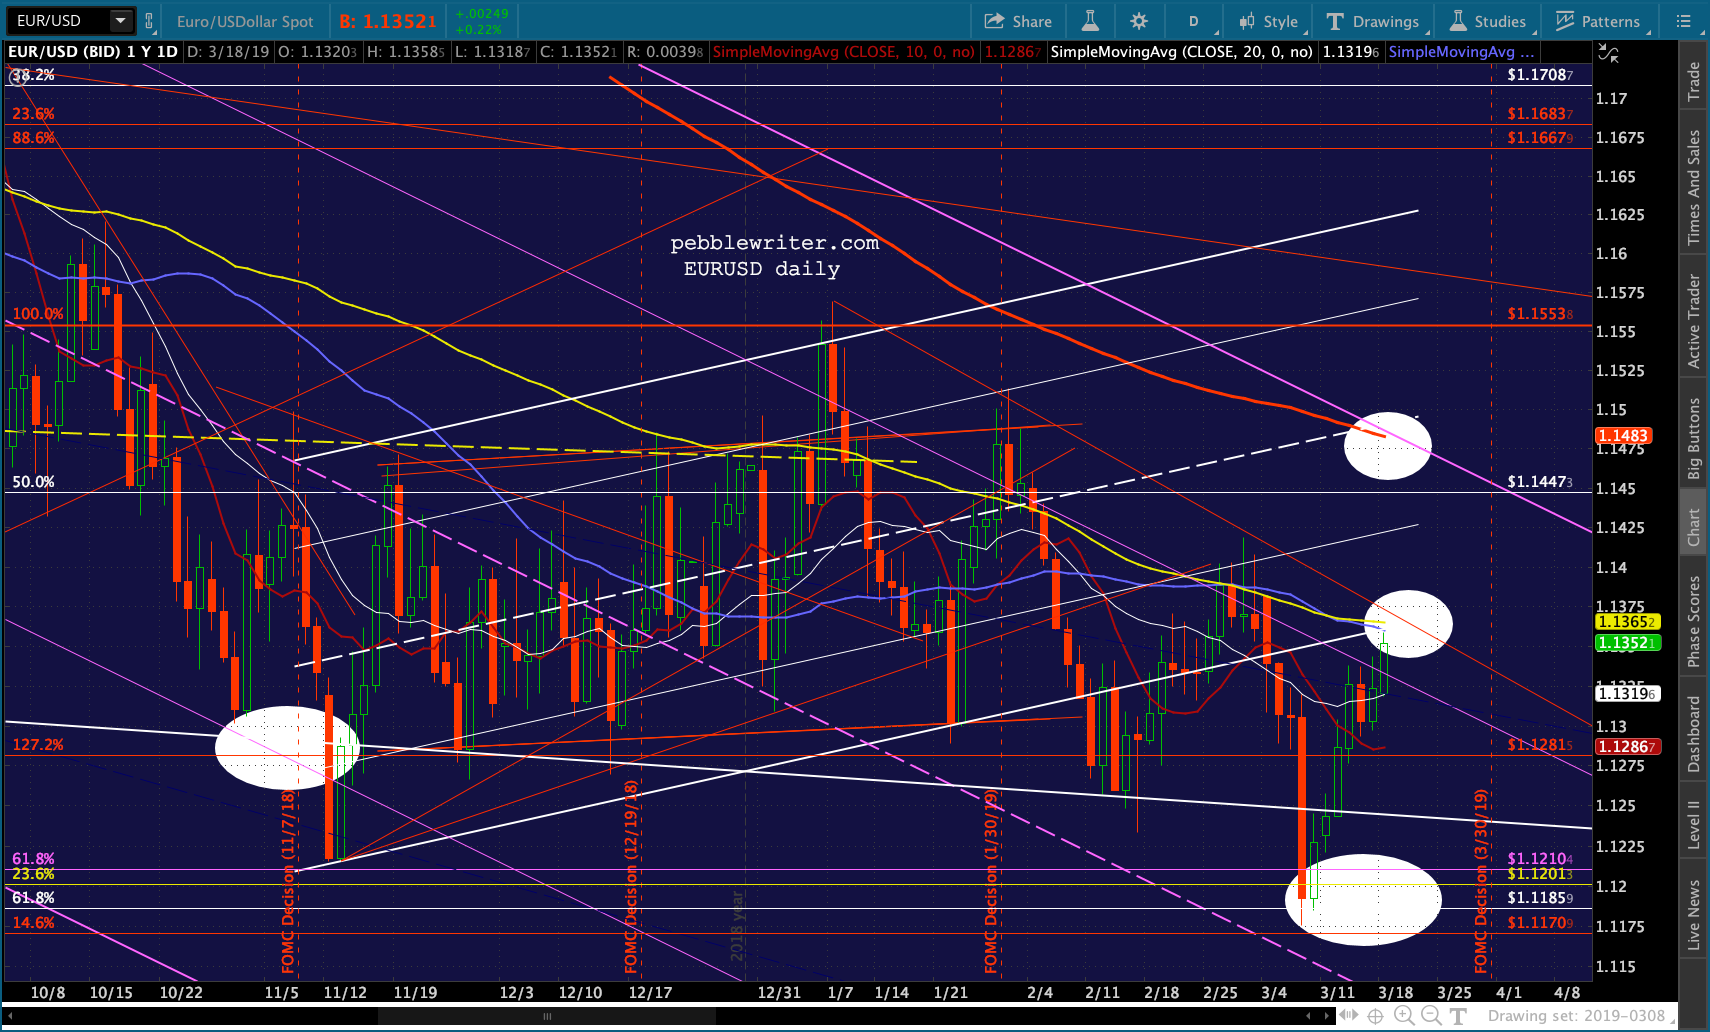
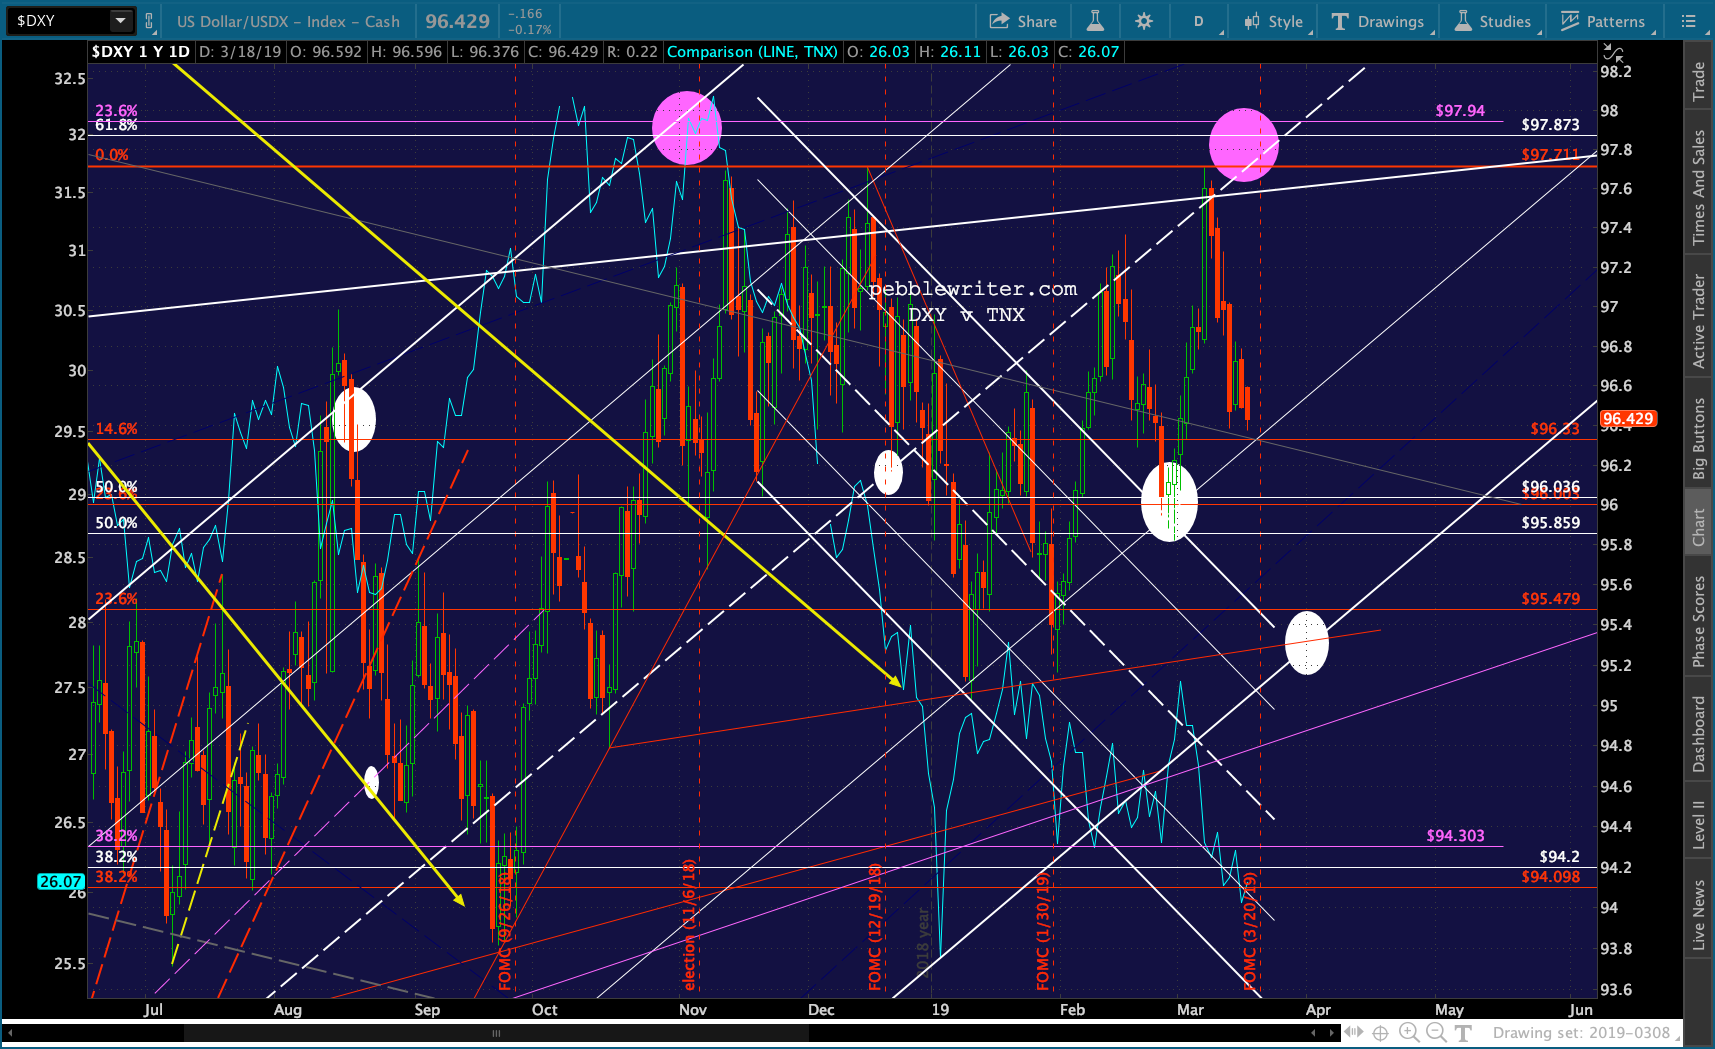
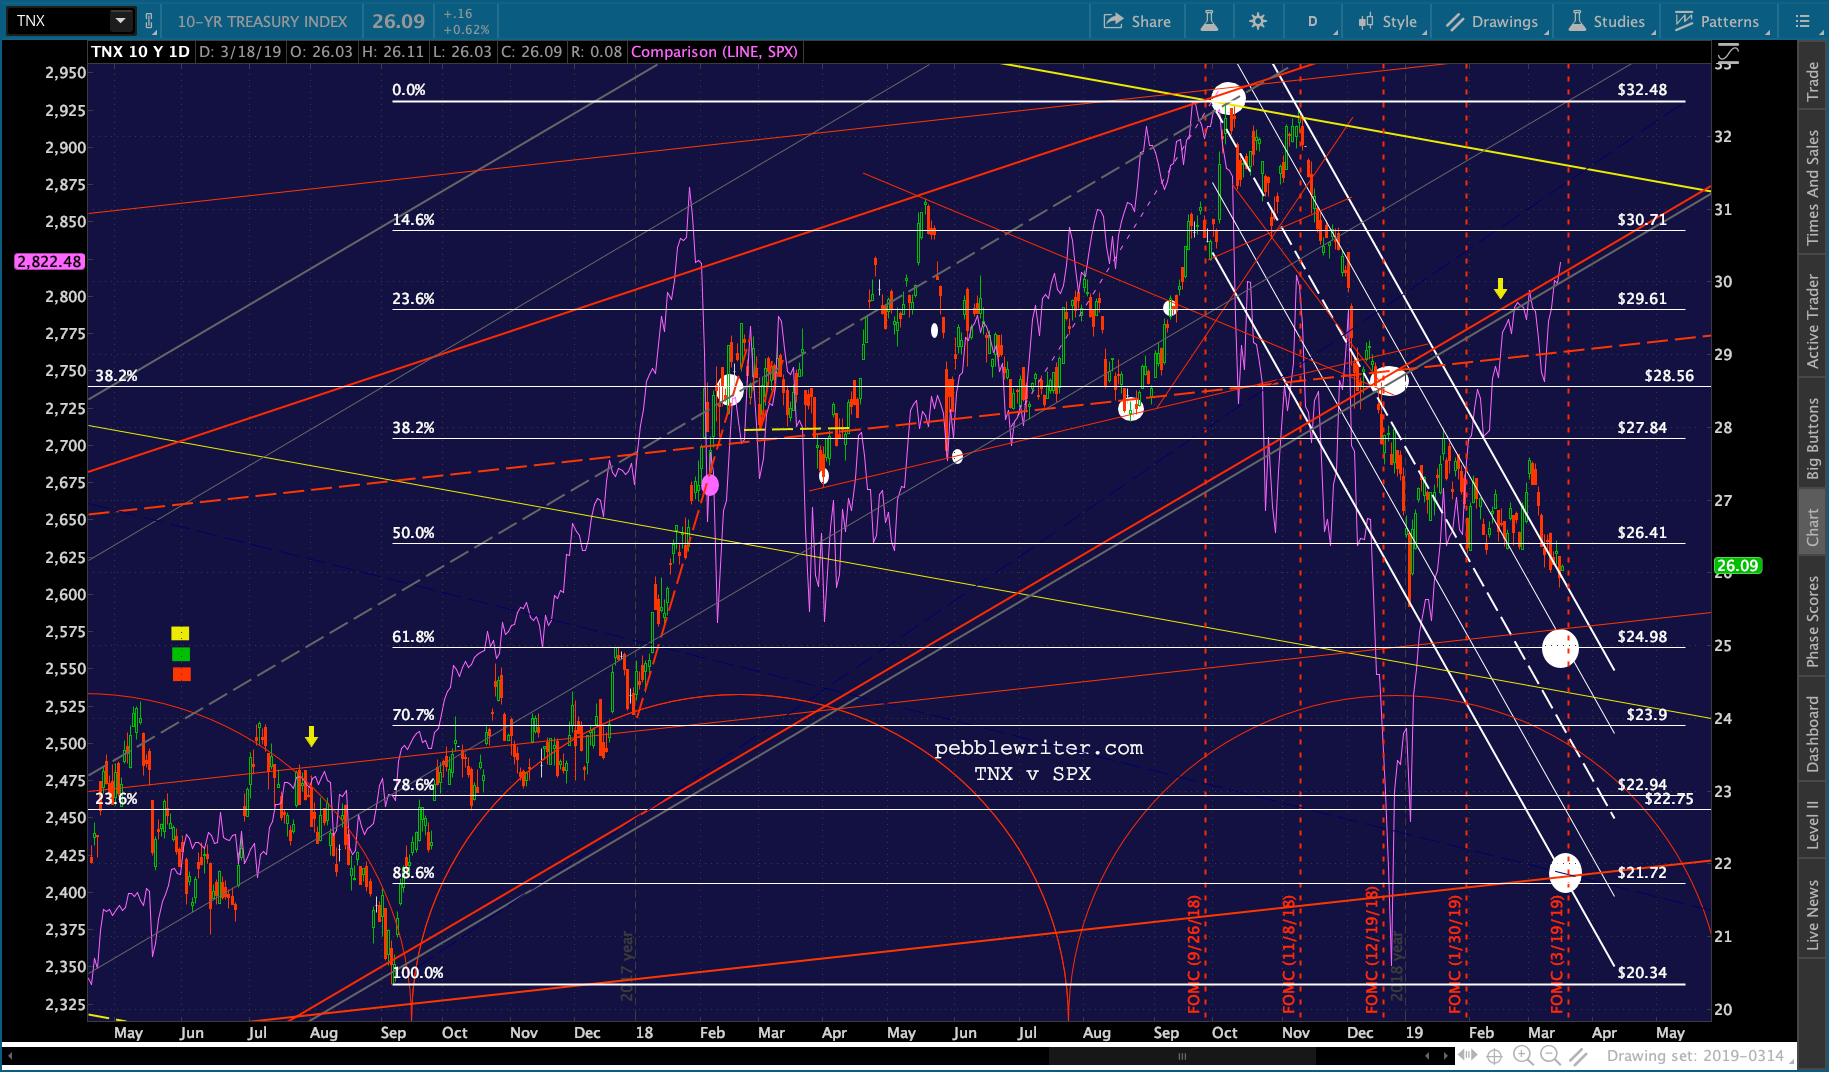
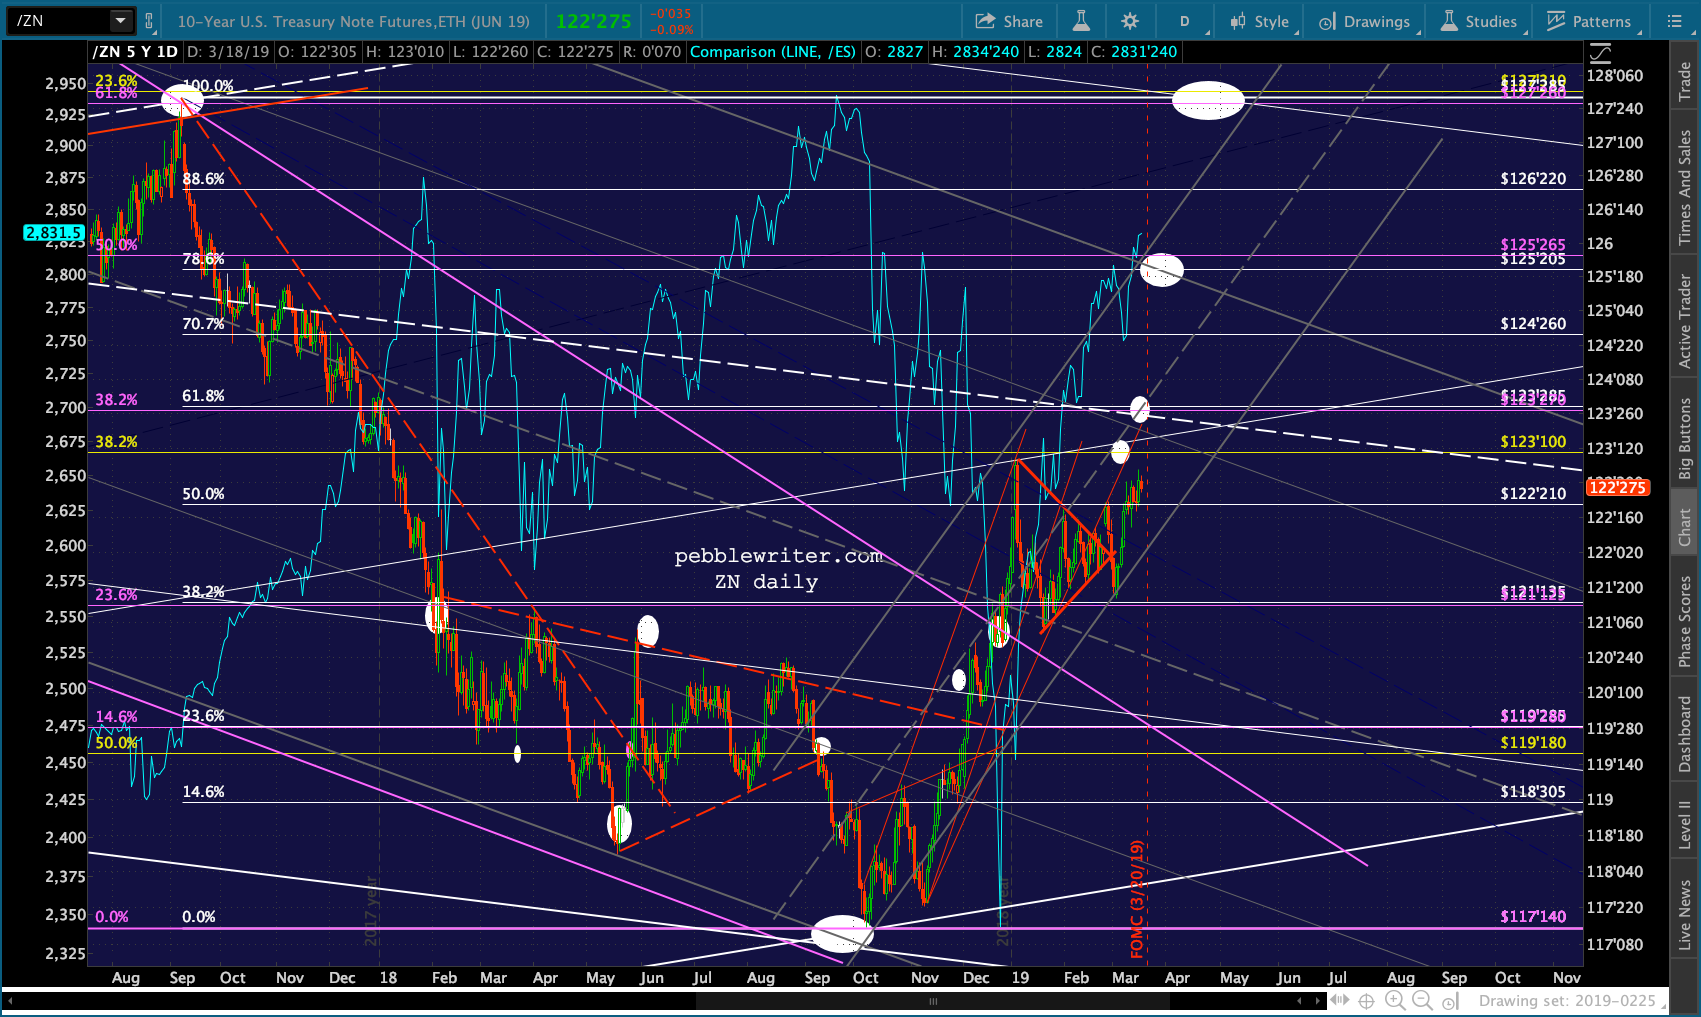
 The bond market is still not buying the equity meltup. With the FOMC rate decision and presser coming up Wednesday, will we finally see rates reach our downside target(s)?
 A few other odds and ends… COMP just missed its .786 on Friday.
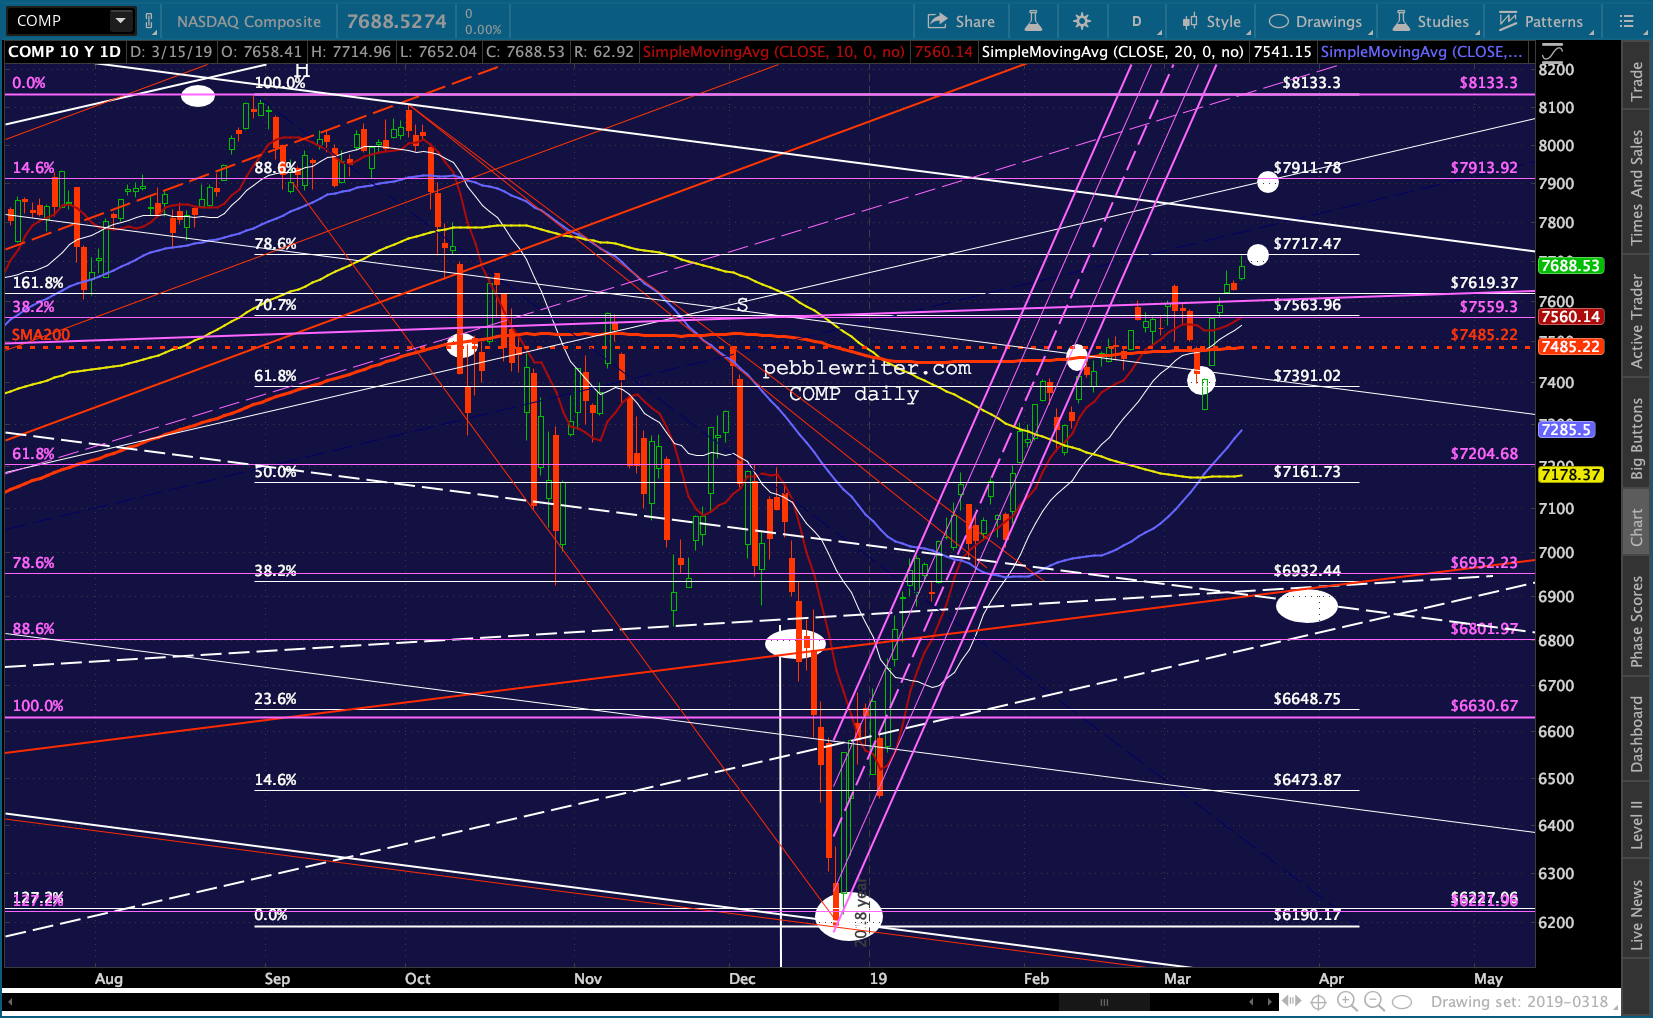 …while AAPL is trying to reach its SMA200.
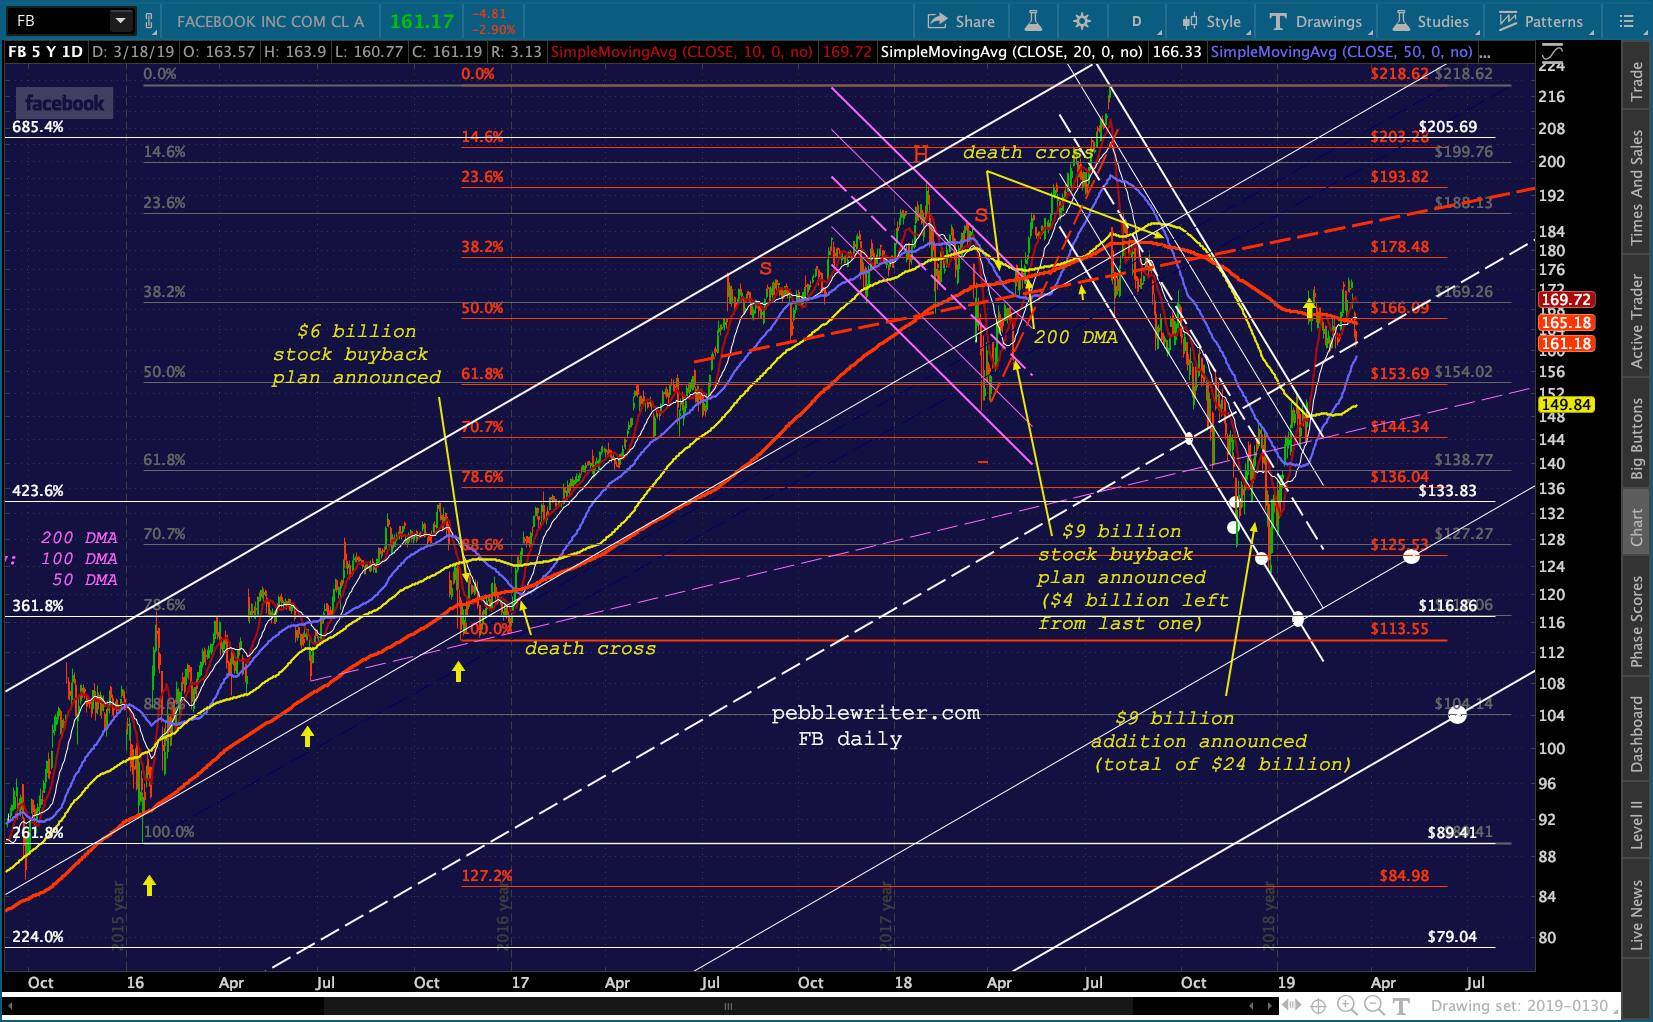
 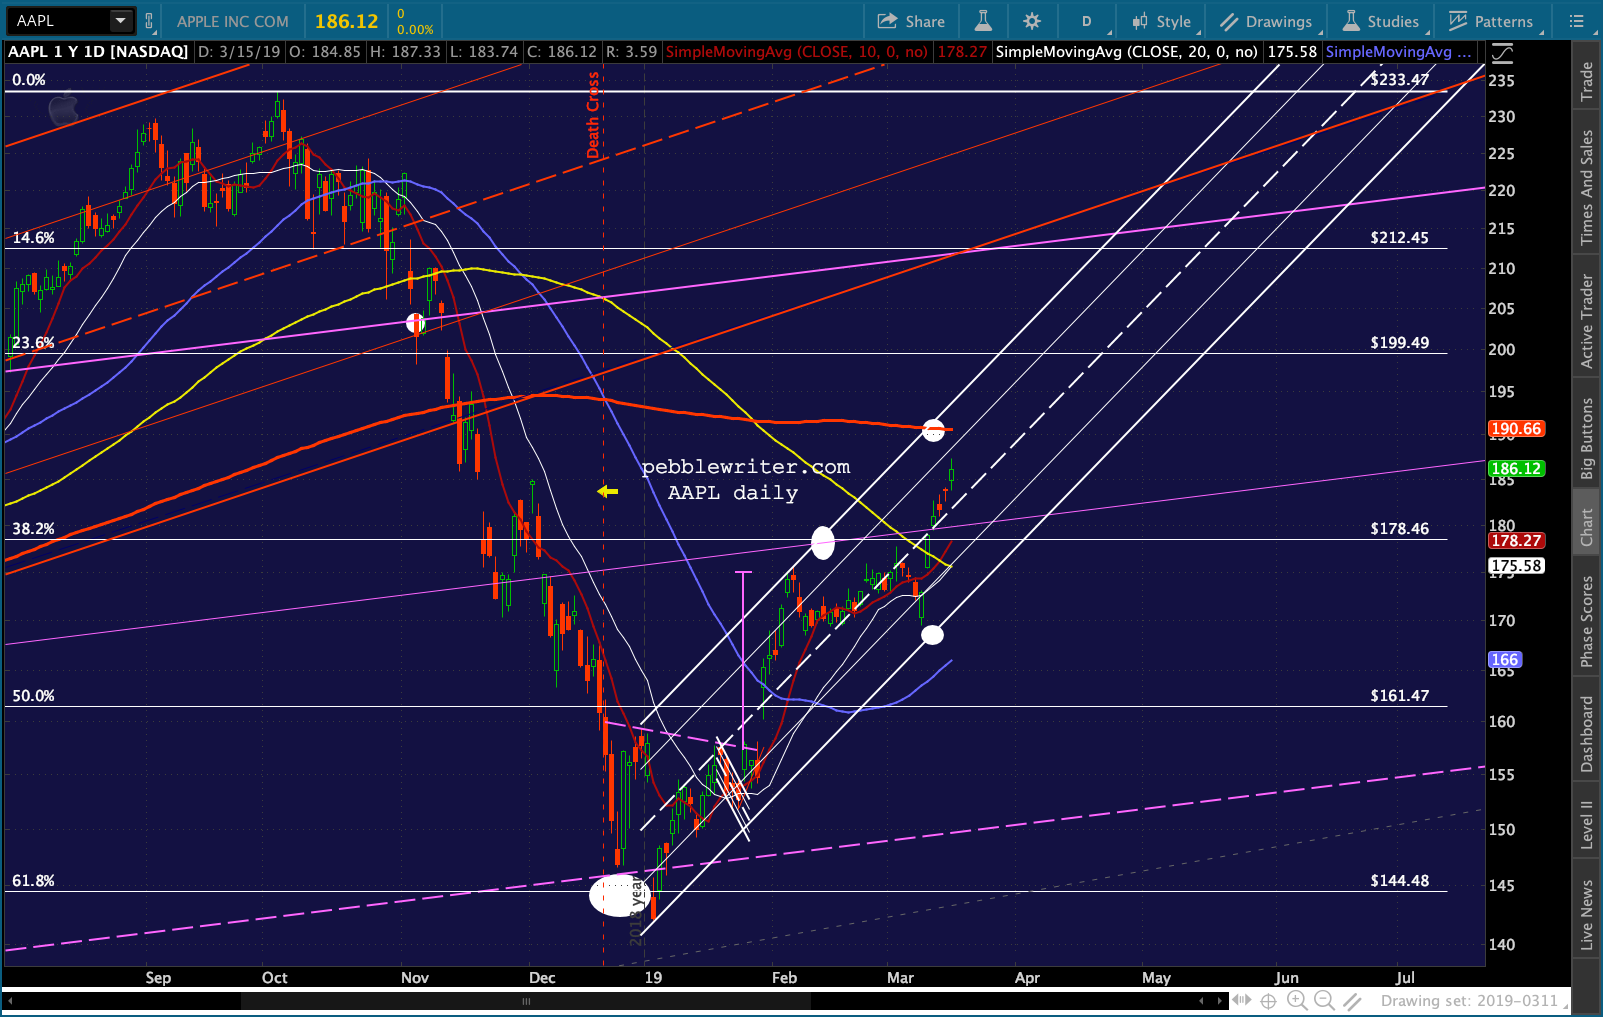 FB is struggling to hold its channel midline — maybe announce another $9 billion in buybacks?
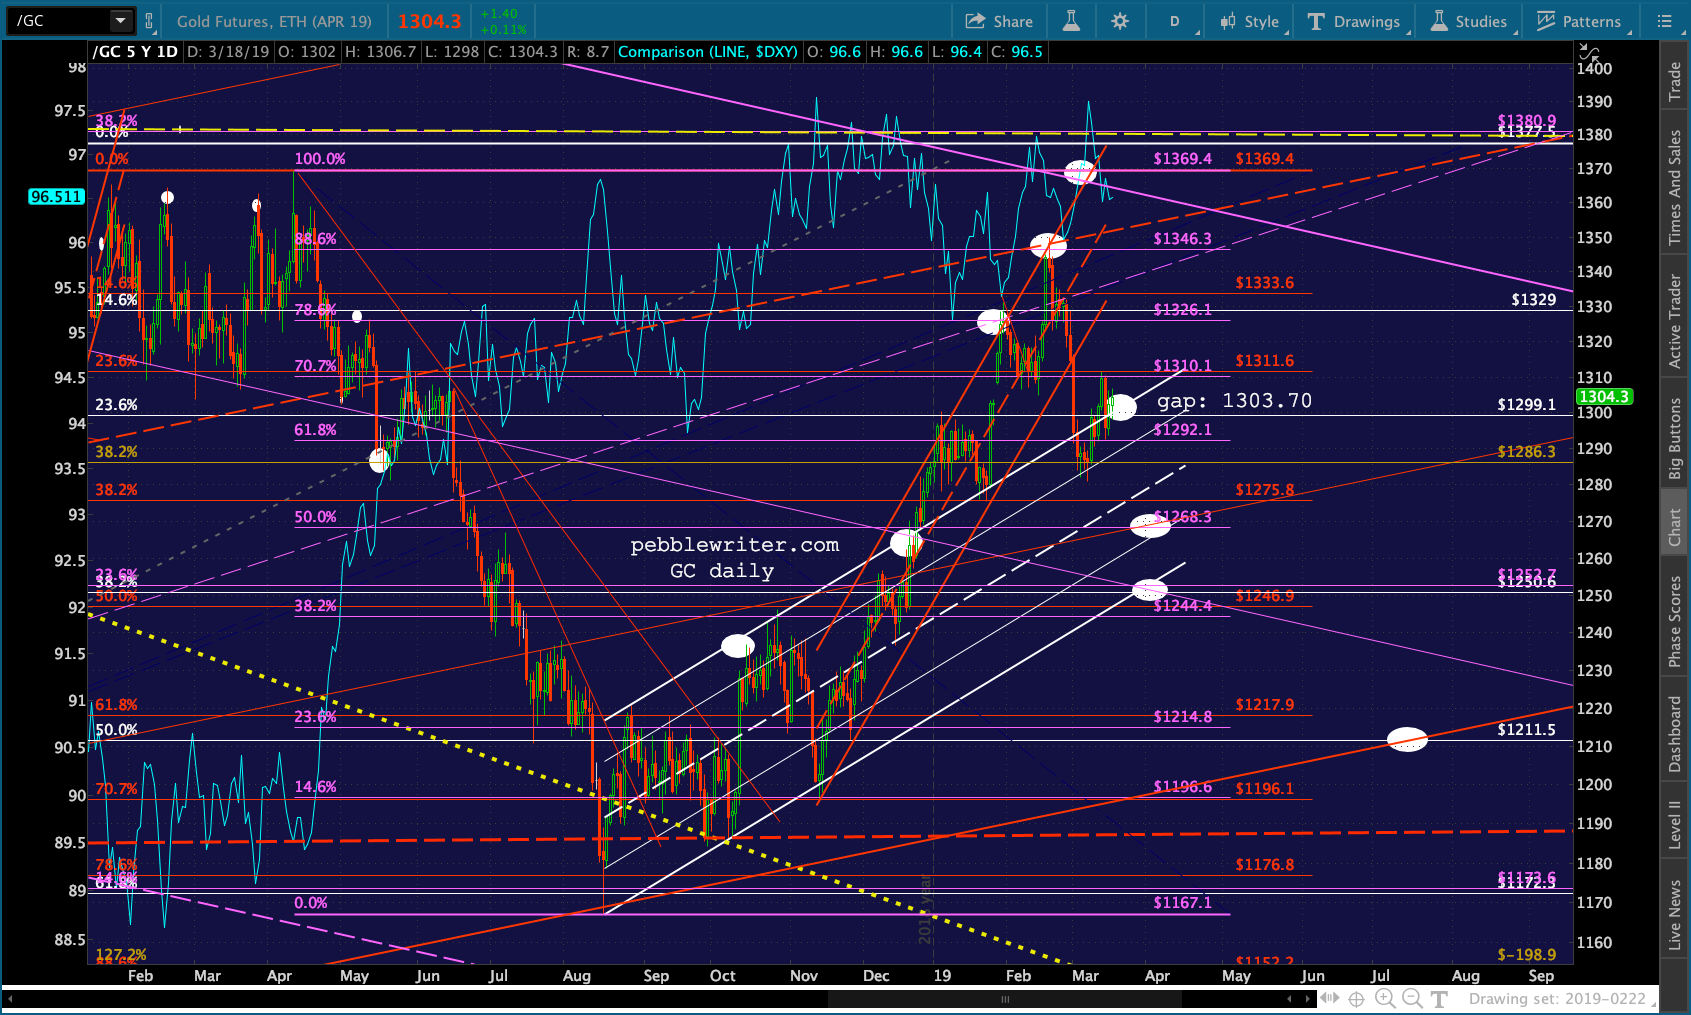
 And, gold is climbing back above our first downside target – a backtest of the broken small white channel. It it continues falling, the next support is at the purple .500 and red channel .236 line. If that doesn’t hold, the purple channel .786 line and tangle of Fibs at 1250.
 I’m going to take a break and then start posting the study I’ve been working on. It’ll probably take the rest of the day.