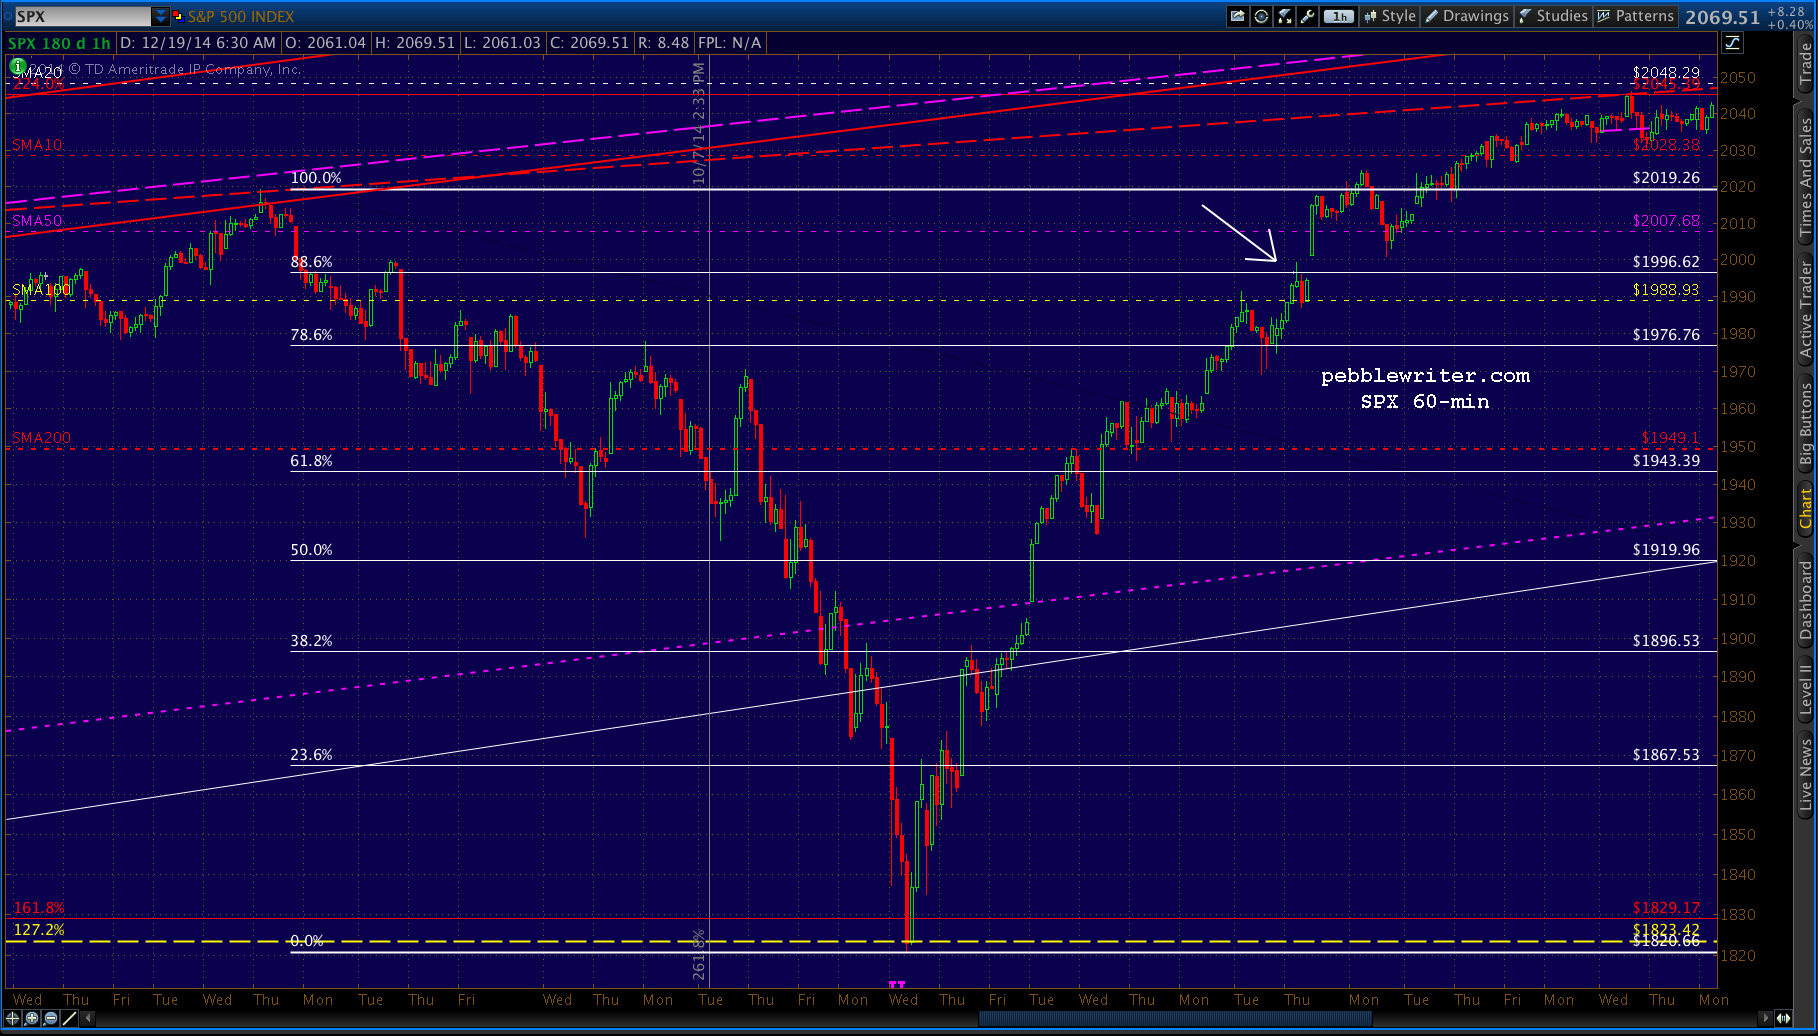
SPX reversed as expected at the SMA20, but didn’t quite reach the optimal backtest of the megaphone pattern (2033 v 2026.) From Tuesday’s update:
As for key levels, look for resistance at the SMA10 (2040, also the purple .618) and SMA20 (2050.) The more important level is probably the red TL — currently around 2060 — and then the former high and white neckline.
And, as updated yesterday morning:
So, we’ll look for a reversal at the SMA20 (currently 2046.84) and count the .618 and SMA10 as support for the first pullback.
 We’ll tag the red TL on the opening. The only question is whether SPX will take a breather there or run on up and tag the .886 (2067) before taking a breather. The key, as usual, is USDJPY — which just reached the .618 on its white grid.
 It’s reversing, but should remain in the rising red channel — which would mean not too much of a reversal here for it or for SPX.
UPDATE: 09:40
SPX just reached 2066, close enough for government work. Should see it settle back from here. Targets coming up.
 continued for members…
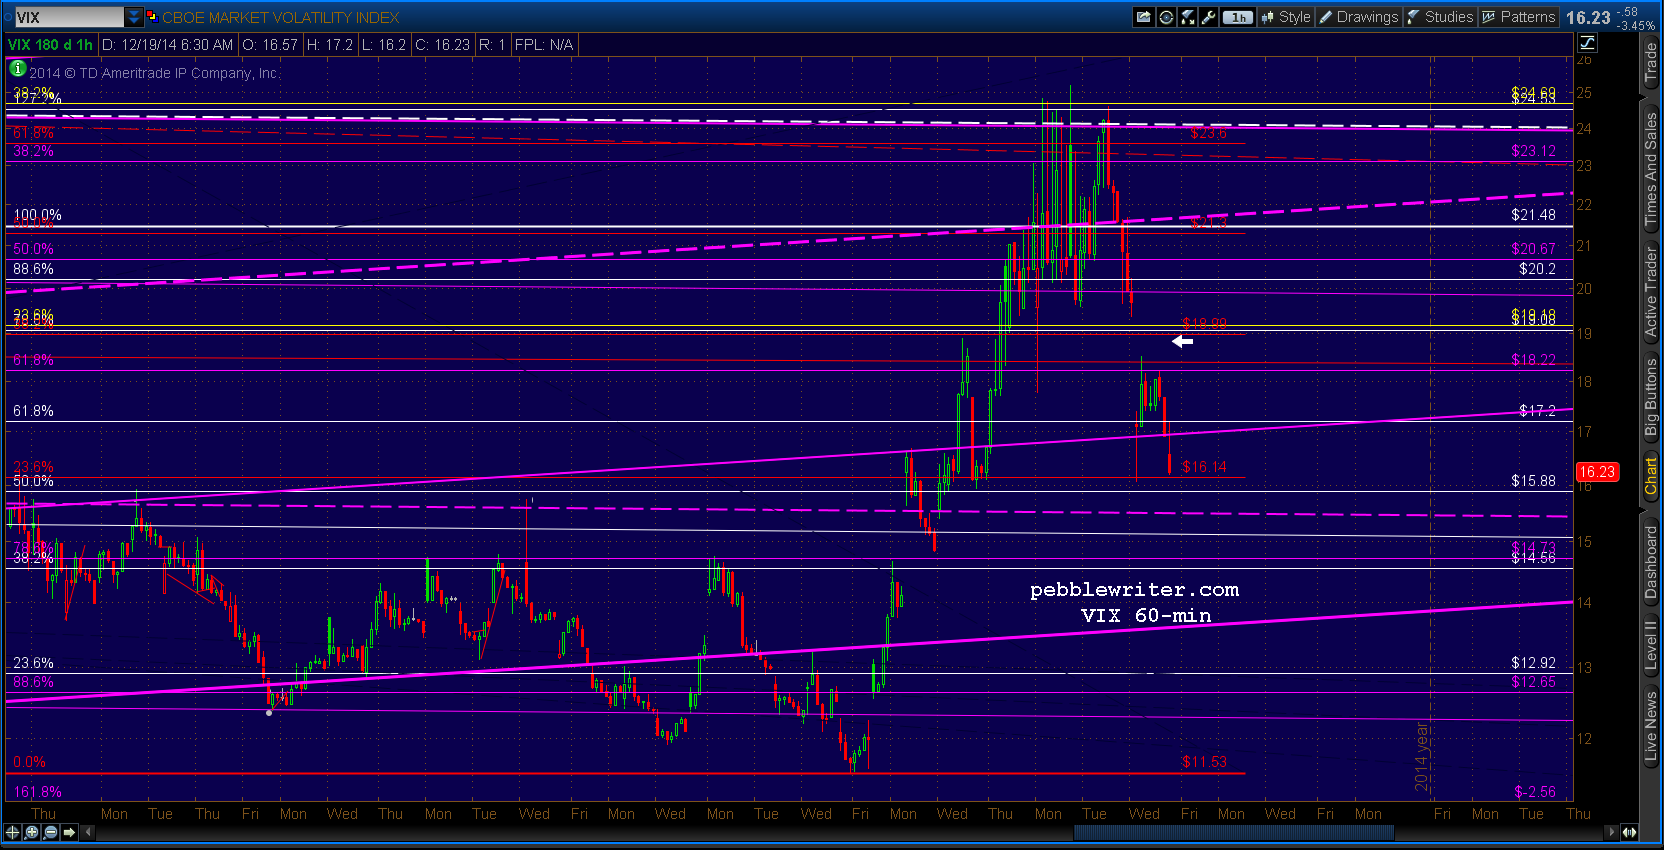
TNX, which also reached its small scale .618 yesterday, continued to back off this morning. But, it will run into support at either the white or red channel midlines at 21.81 and 21.57 respectively. So, like USDJPY, it doesn’t argue for much of a pullback. 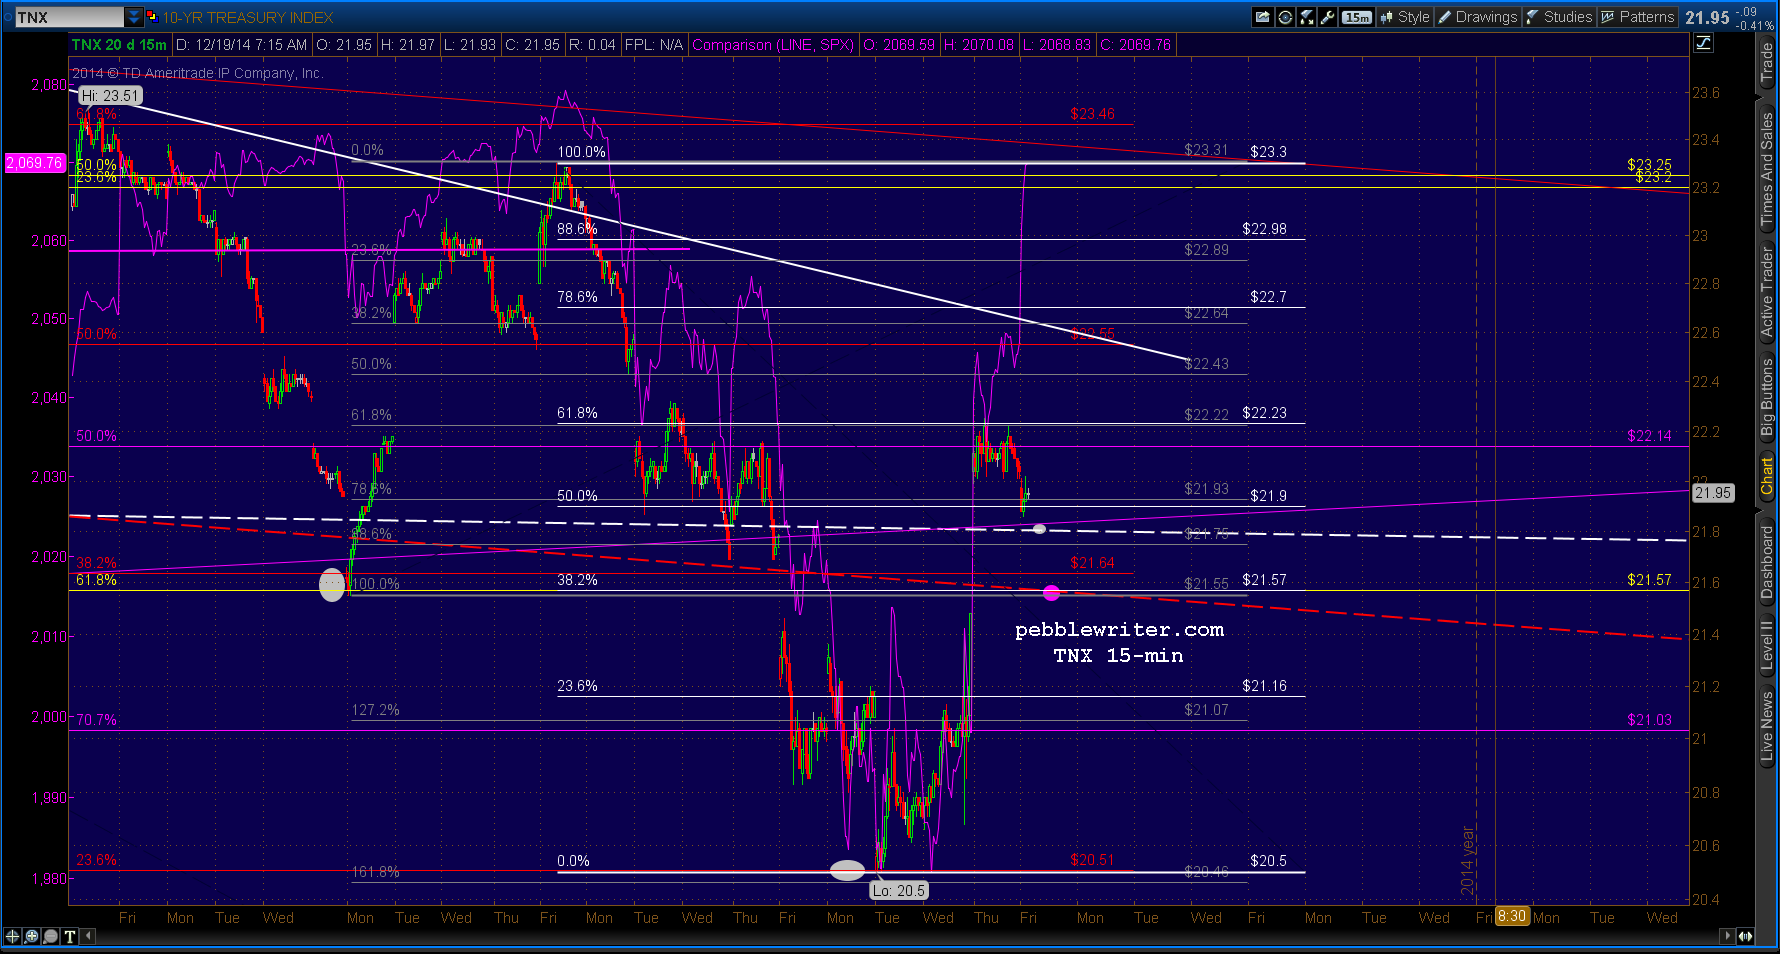 Conversely, VIX (currently 16.93) still has a big gap open from 18.51 to 19.26 — which would argue for a more significant one.
 I’m going to go with USDJPY, TNX and the October analog, which suggests very little pullback. It’s quadruple witching day, and the momentum seems quite strong. If there’s a pullback, it’ll most likely ape Oct 30 and do so in a way that humbles chartists like yours truly (as if we needed any more…)
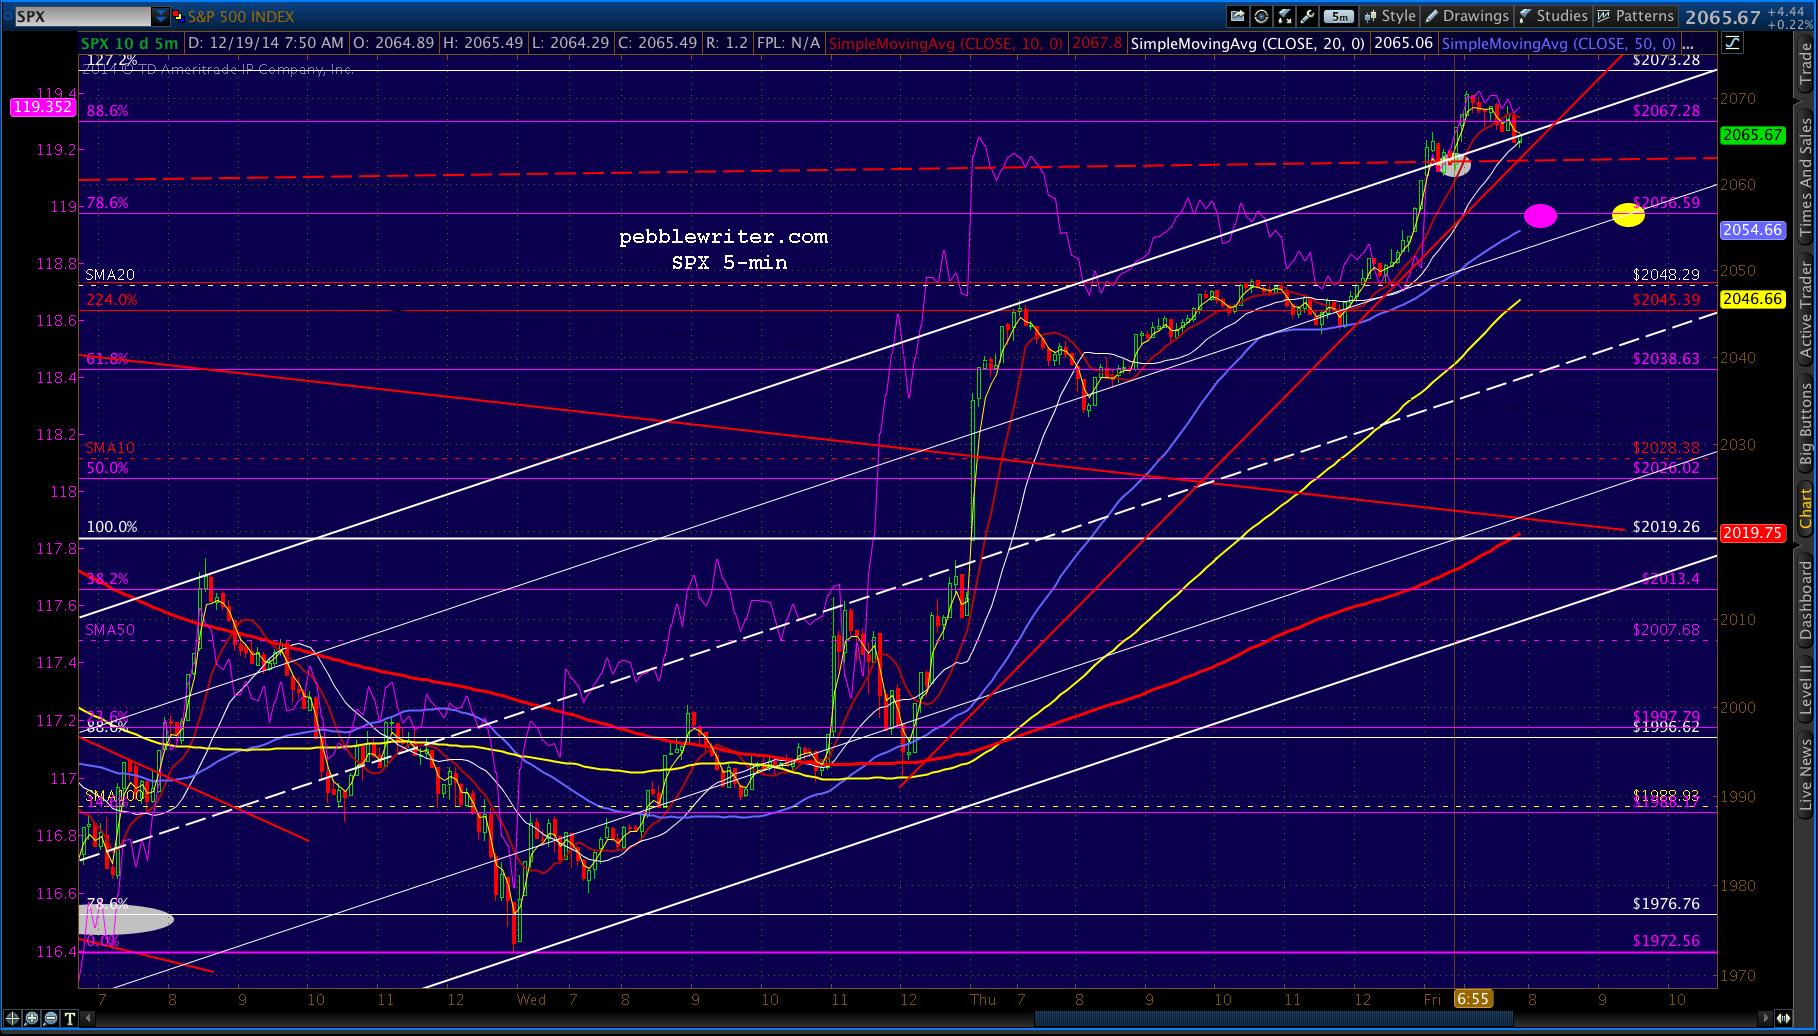
Note that back then, it actually overshot the target, then reversed only 12 points. That would put it in the range of the current purple .786 at 2056.59.
 An even more conservative pullback would be the broken red TL at around 2062. And, if the algos really want to screw traders around, it’ll be more like the SMA20 at 2048 right at the close (followed by a gap up Monday morning, of course.)
UPDATE: 10:50 AM
Quick update…SPX overshot the .886 and appears headed for either the red TL or the purple .786. Note the direction of both the 50- and 100-period SMAs on the 5-min chart (purple and yellow, respectively) straight toward that Fib. Both are pretty good intra-day support. Personally, I like the yellow dot as it also intersects with a channel line.
Also note, however, the solid red TL that goes back to yesterday afternoon. SPX might just decide to follow it on up to the moon and disregard the need for any pullback.
SPX has, at the moment, broken out of the rising white channel. At the very least, you’d want to see it back inside before taking a shot on the downside (you’d also want to have your head examined and/or polish those brass cajones first.)