

Note: I will be on the road Wednesday and Thursday and will have a tough time posting throughout the day. The best I’ll probably be able to do is to post after hours, but I will look for opportunities to sneak in a comment here or there. GLTA.
* * * * *
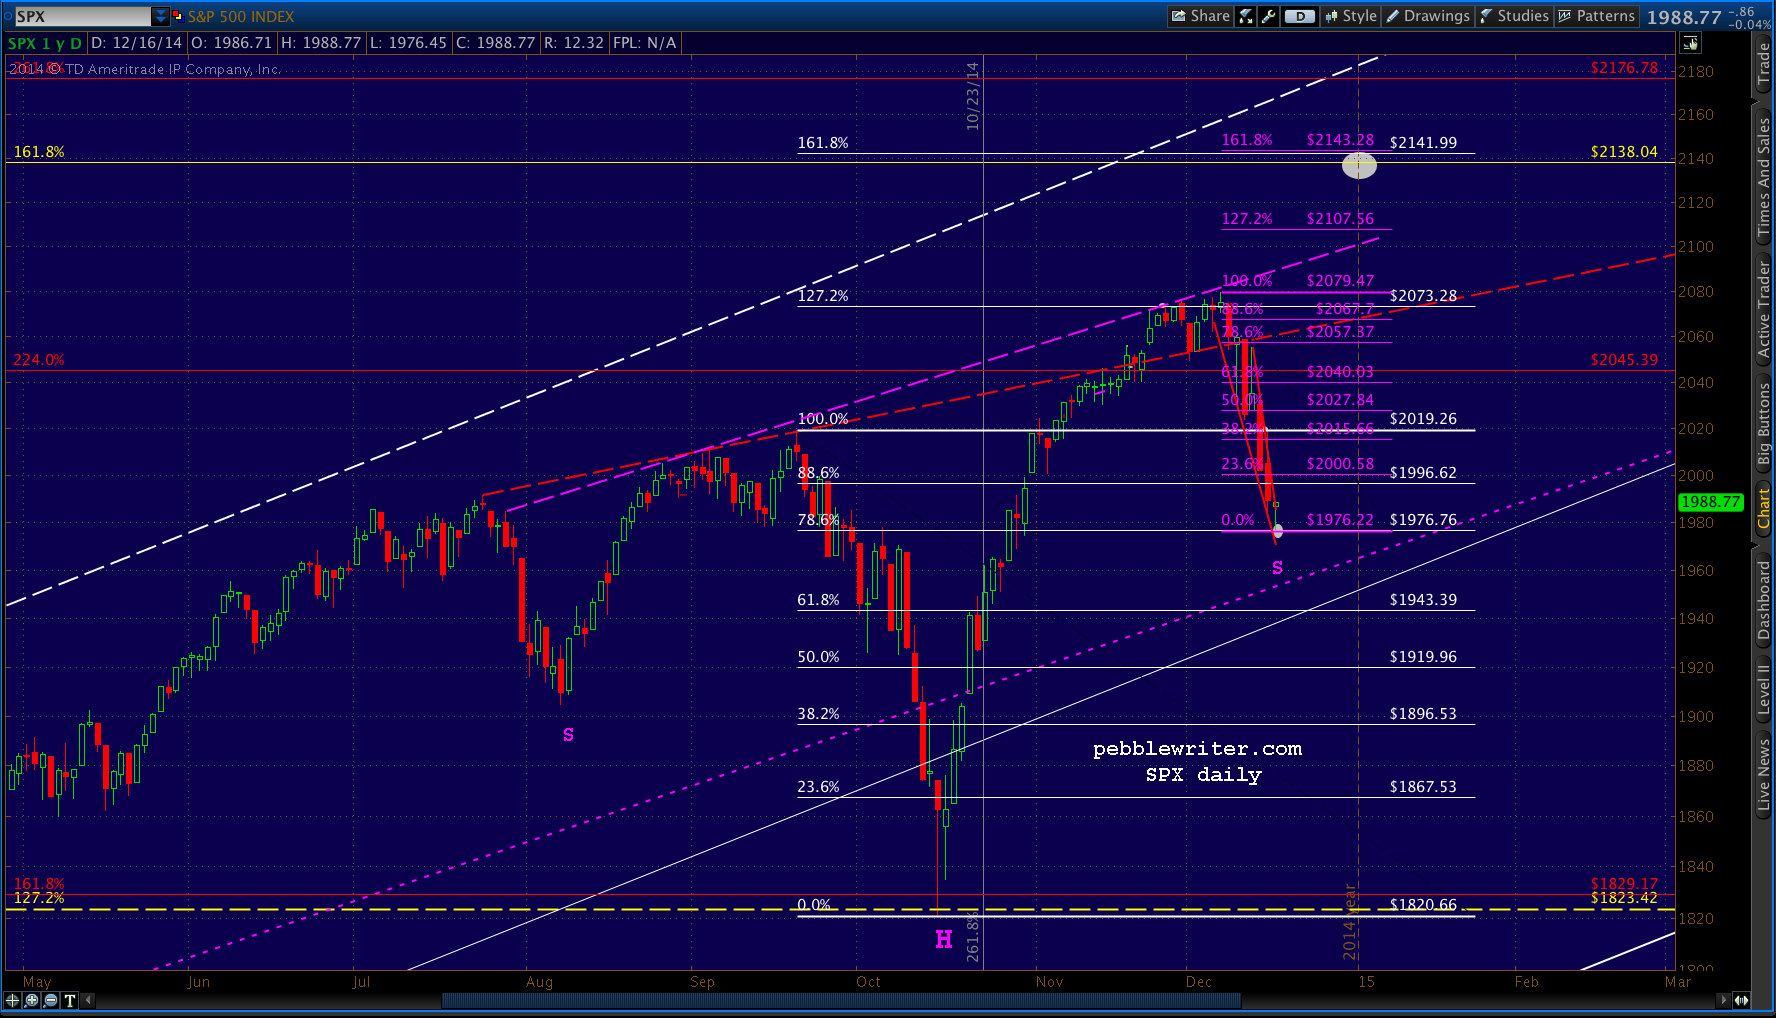
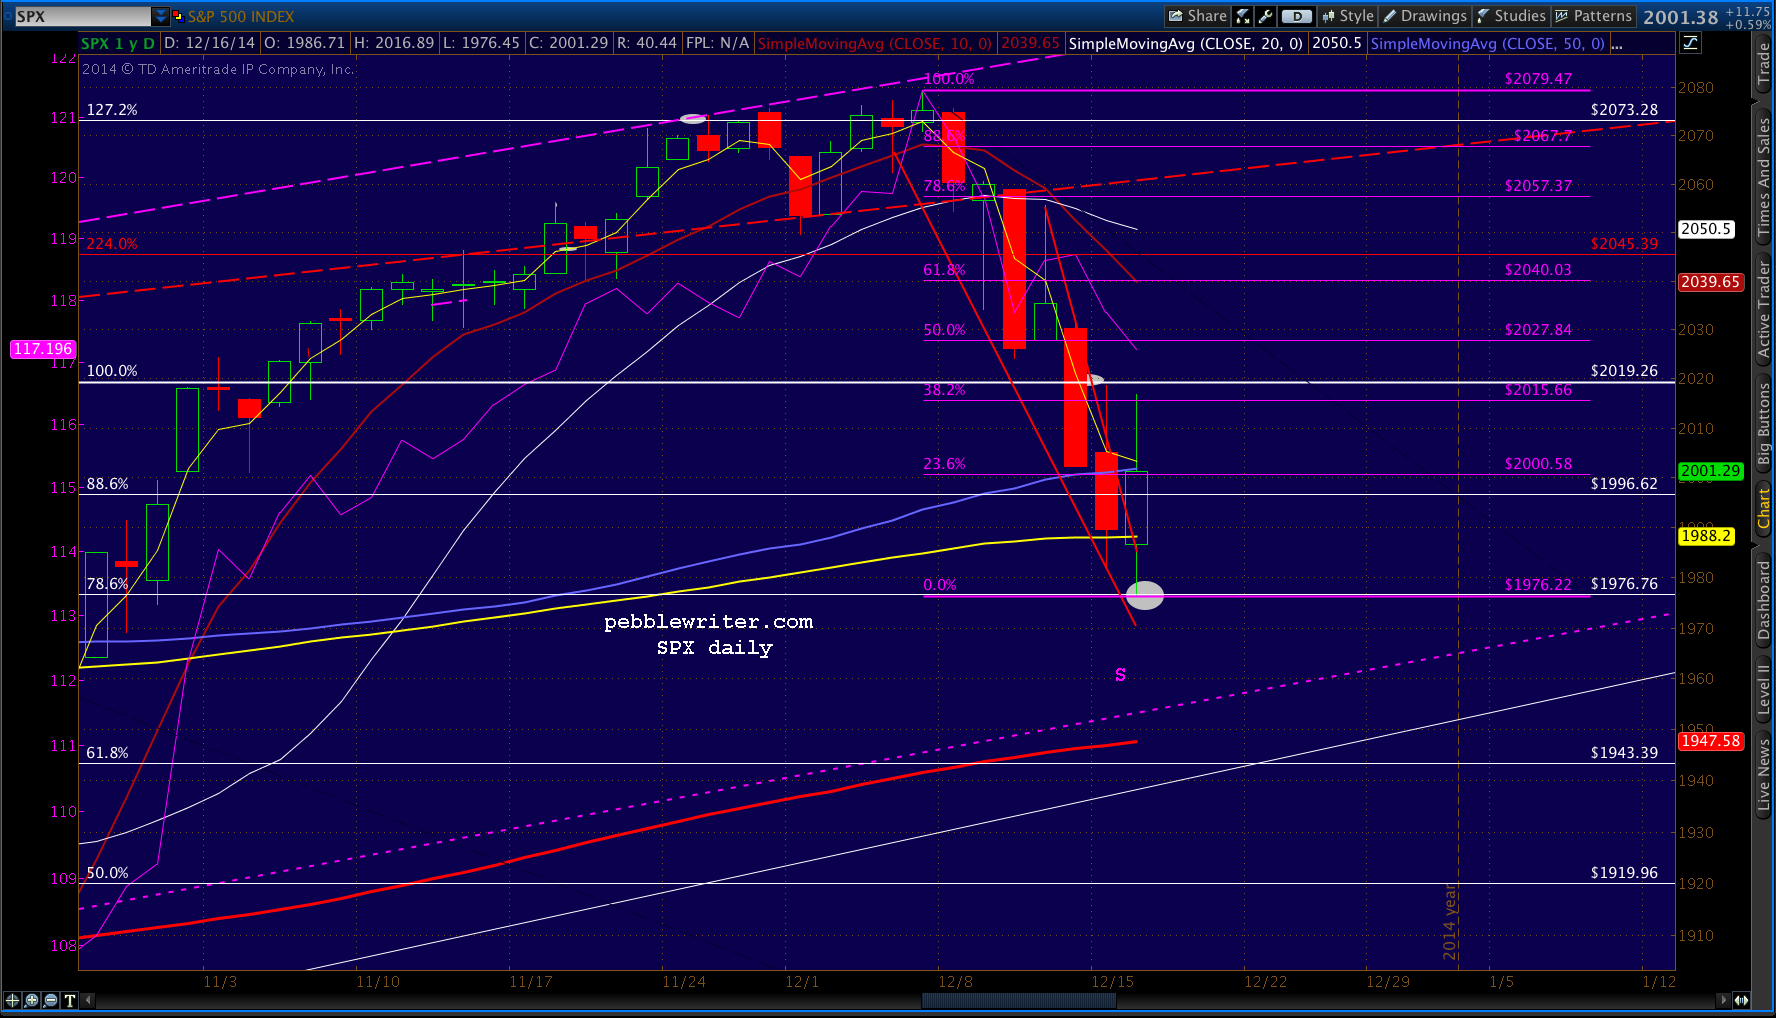
SPX maxed out at our 2019 target yesterday, and appears headed for our downside target of the .786 Fib. From yesterday’s post:
SPX should test 2019 — the previous high and the red channel top. I’d be mildly surprised if we didn’t get a reversal there — whether or not it eventually breaks out… Assuming we get a reversal at 2019, what next? It’s entirely plausible that SPX drops lower and actually tags the .886 at 1996 or even the .786 at 1976. The 50-day and 100-day moving averages are currently around 2002 and 1988, so that’s a nice cluster of support.
 After reversing, SPX went down and dutifully tagged the SMA100. From there, it bounced to the SMA50 as we expected. From the 11:30 update:
I think it would be worth trying a long position here (1989) for a good-sized bounce, but with tight stops. Just watch for ping-ponging, as the SMA50 at 2001.37 is now resistance.
 After SPX reversed at 2002, we took a shot at the next leg. From the 3:20 update:
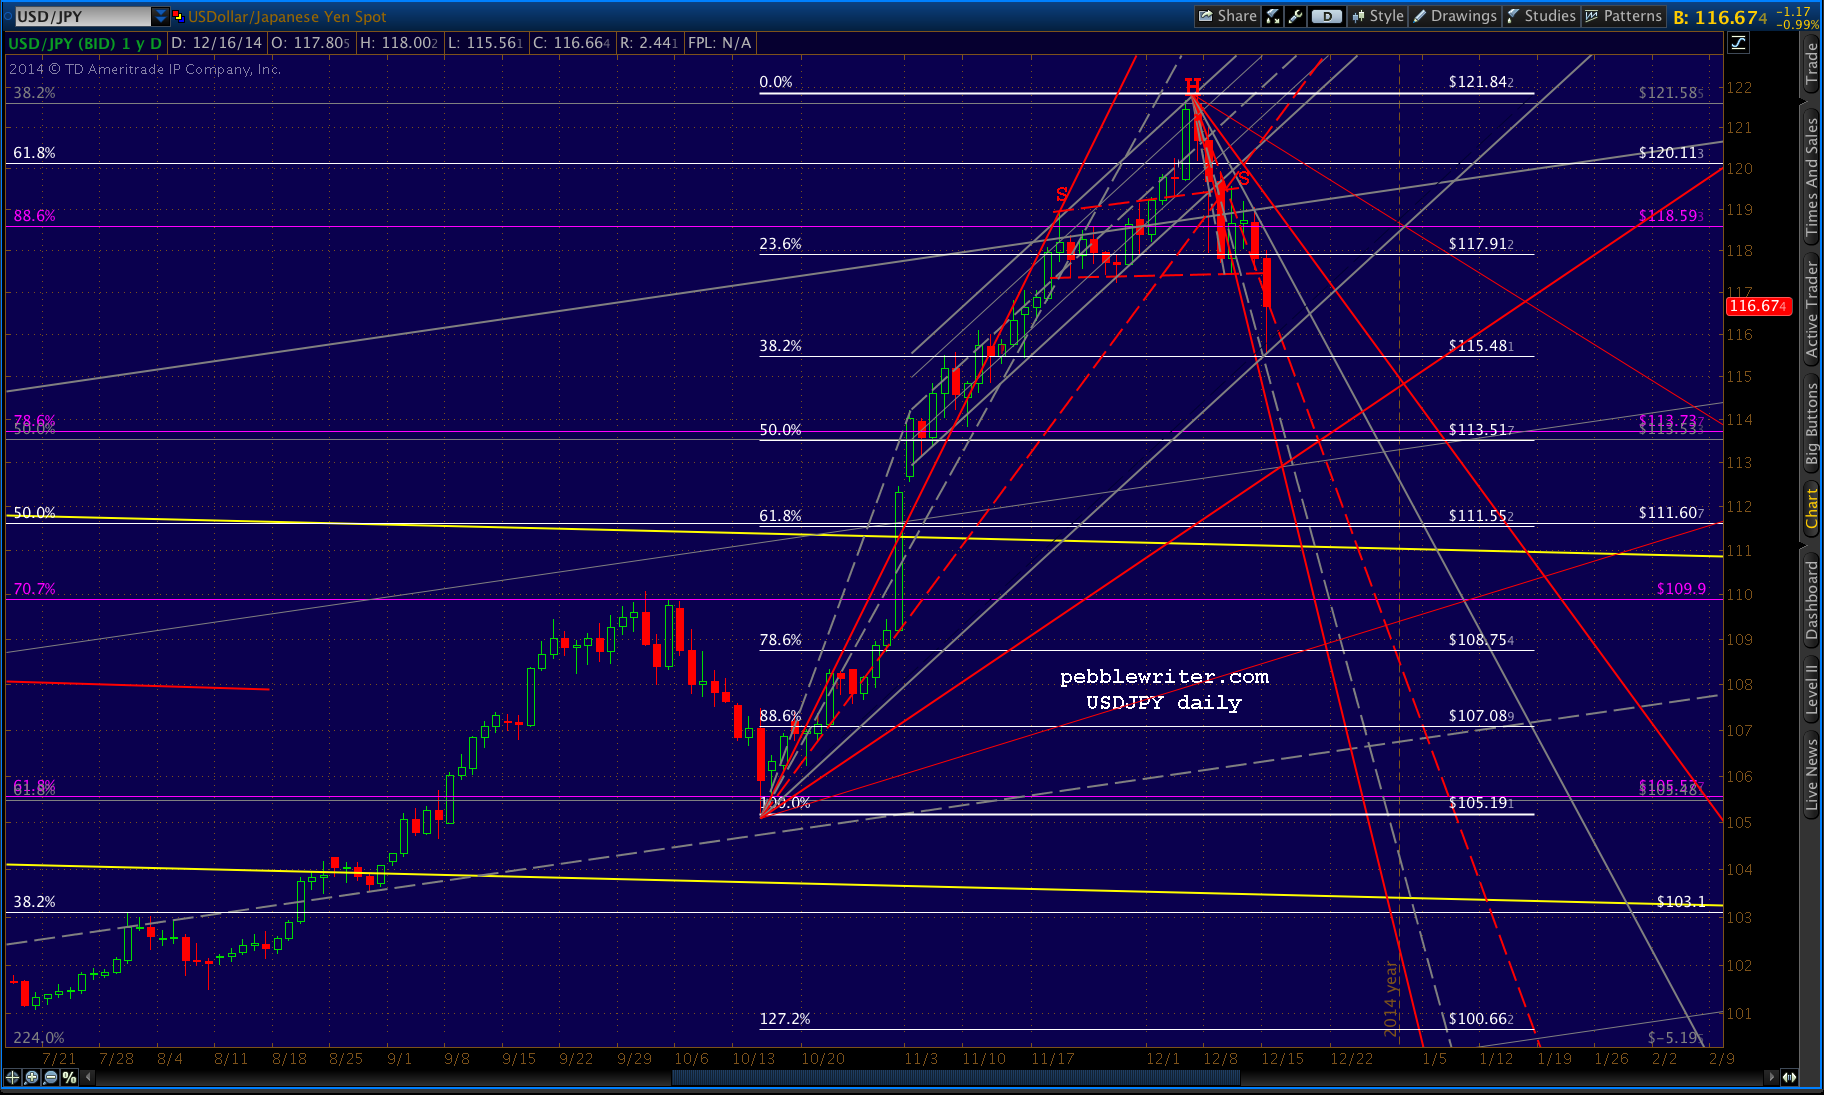
My best guess is it goes down and tags the .786 to coincide with 10-yr yields slipping a little further (2.05%) and maybe even a dip to or below 117.45 for USDJPY.
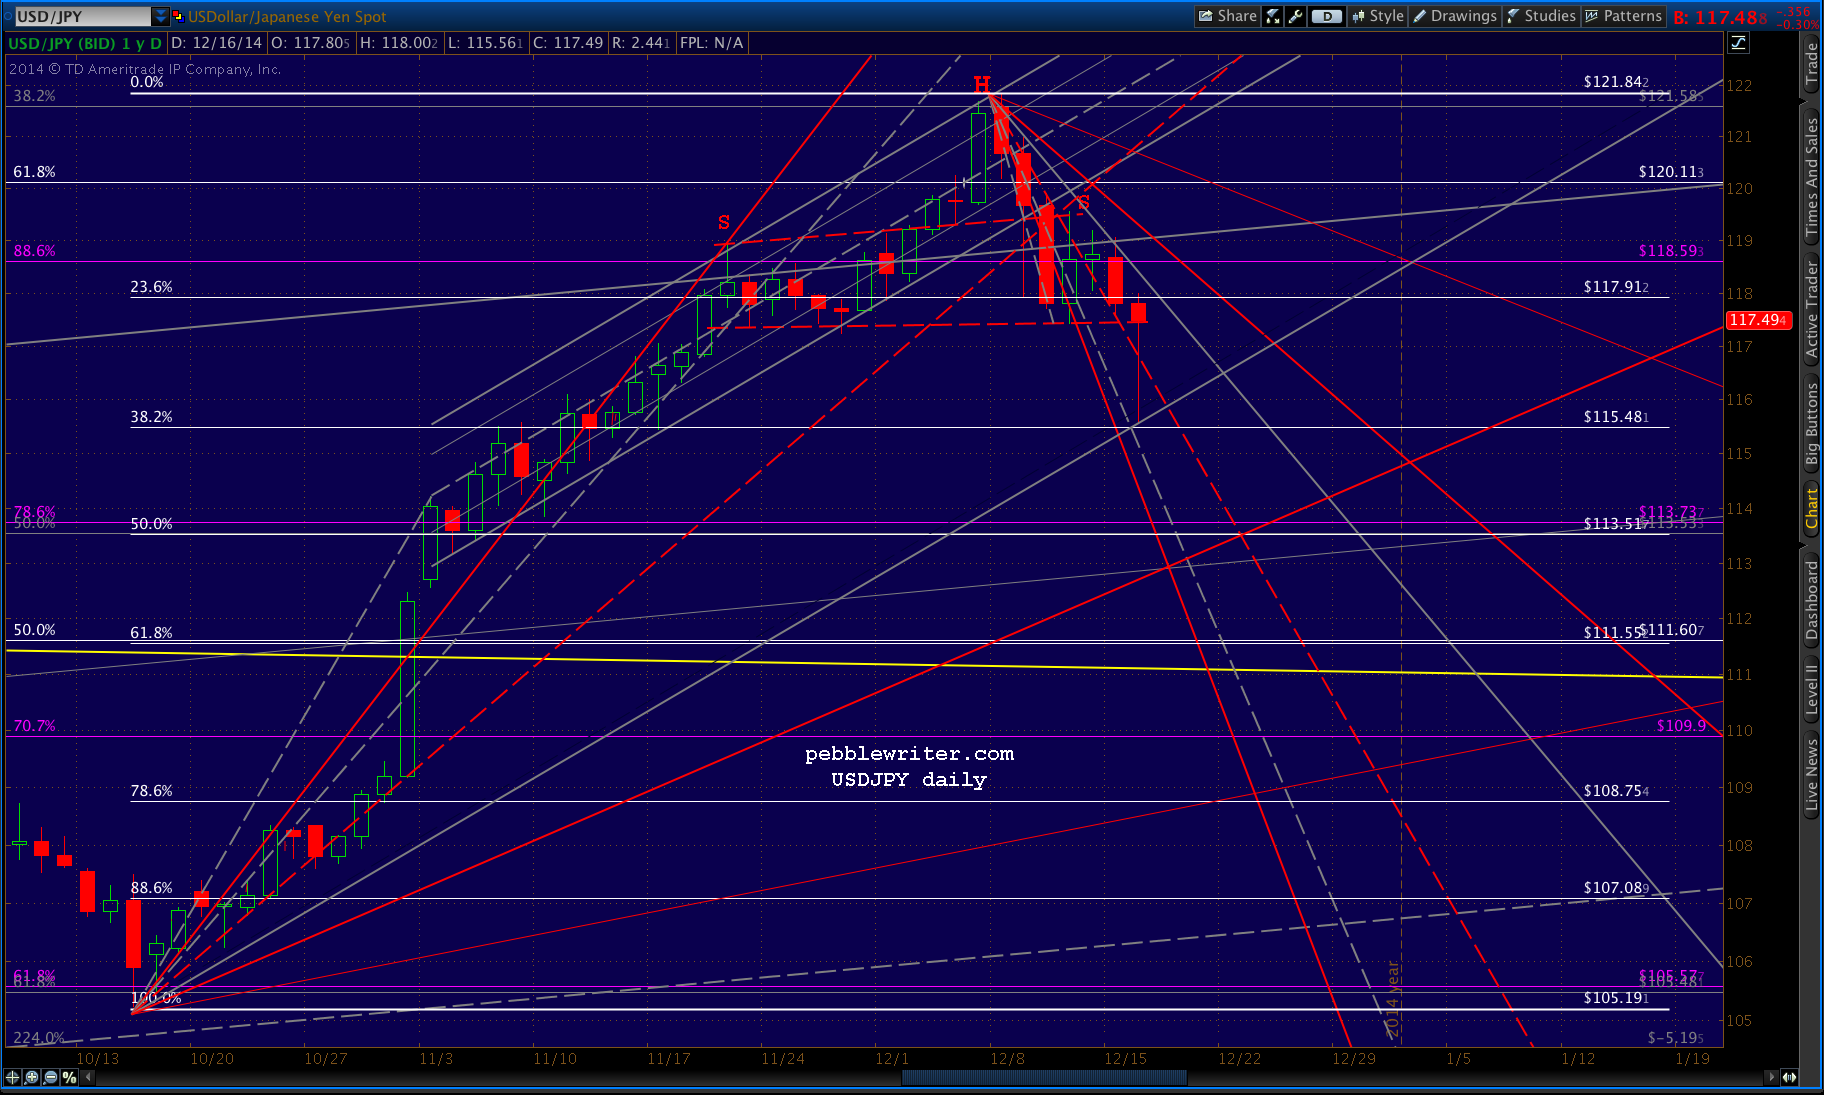
The 10-yr note nailed 2.05% this morning. USDJPY has certainly broken 117.45. If SPX is to hold, USDJPY should get busy backtesting or pushing back above the H&S neckline.
 And, the futures have accommodated with a .786 tag. We’ll see if the cash market follows suit.
 UPDATE: 9:32 AM
SPX was right on the money, tagging the .786 in the opening minute of trading. From here we should get a nice bounce, as long as USDJPY plays along and scurries back to the neckline of the newly completed H&S Pattern (see chart above.)
 If there’s one thing I’ve learned from the past year, it’s that chart patterns and Fibonacci levels have been much more effective when the market is being allowed to run. That is to say, when the “market” isn’t being propped up or forced higher.
And, as I’ve learned the hard way, any serious decline that comes along is only occurring because TPTB have decided to allow it to occur (after they’ve positioned themselves accordingly, of course.)
It won’t always be this way. Eventually, things will get out of hand as they did in the summer of 2011 (to a point.) The timing of such an event will be tough to predict — but hopefully not impossible.
When I start nailing downside and intra-day targets as I have the past two weeks, it’s probably time to expect a massive rally that defies traditional patterns and technical analysis. New targets coming up shortly.
continued for members…
For starters, my leading scenario is that this morning’s low will not be broken until 2015. We’re now 154 points south of my 2138 target. So, I’m not sure we’ll make it all the way there by year end — only 10 trading days away.
But, we now have three Fibonacci patterns that agree wholeheartedly that 2138-2143 is the next upside target. A lower low certainly isn’t out of the question. But, TPTB have gone to a lot of trouble to lay the groundwork, reinforcing 2138 as a legitimate target. I suspect they’ll follow through on it.
 How would it happen? There are several key ingredients.
First, it simply can’t be done without the USDJPY’s cooperation. Everyone’s talking about the ruble, but it’s the plunging yen that got stocks to these levels. And, the fact that USDJPY is back below a key Fib level (the .618 at 120.11) has carry trade investors rightfully freaked out.
Note, however, that this morning’s low was a .382 retracement of the rise from mid-October. It’s not an enormously important Fib level, but a bounce back above the H&S neckline and .236 would go a long way to erasing stocks’ losses. And, a move back above the white .618 at 120.11 would esentially guarantee new highs.
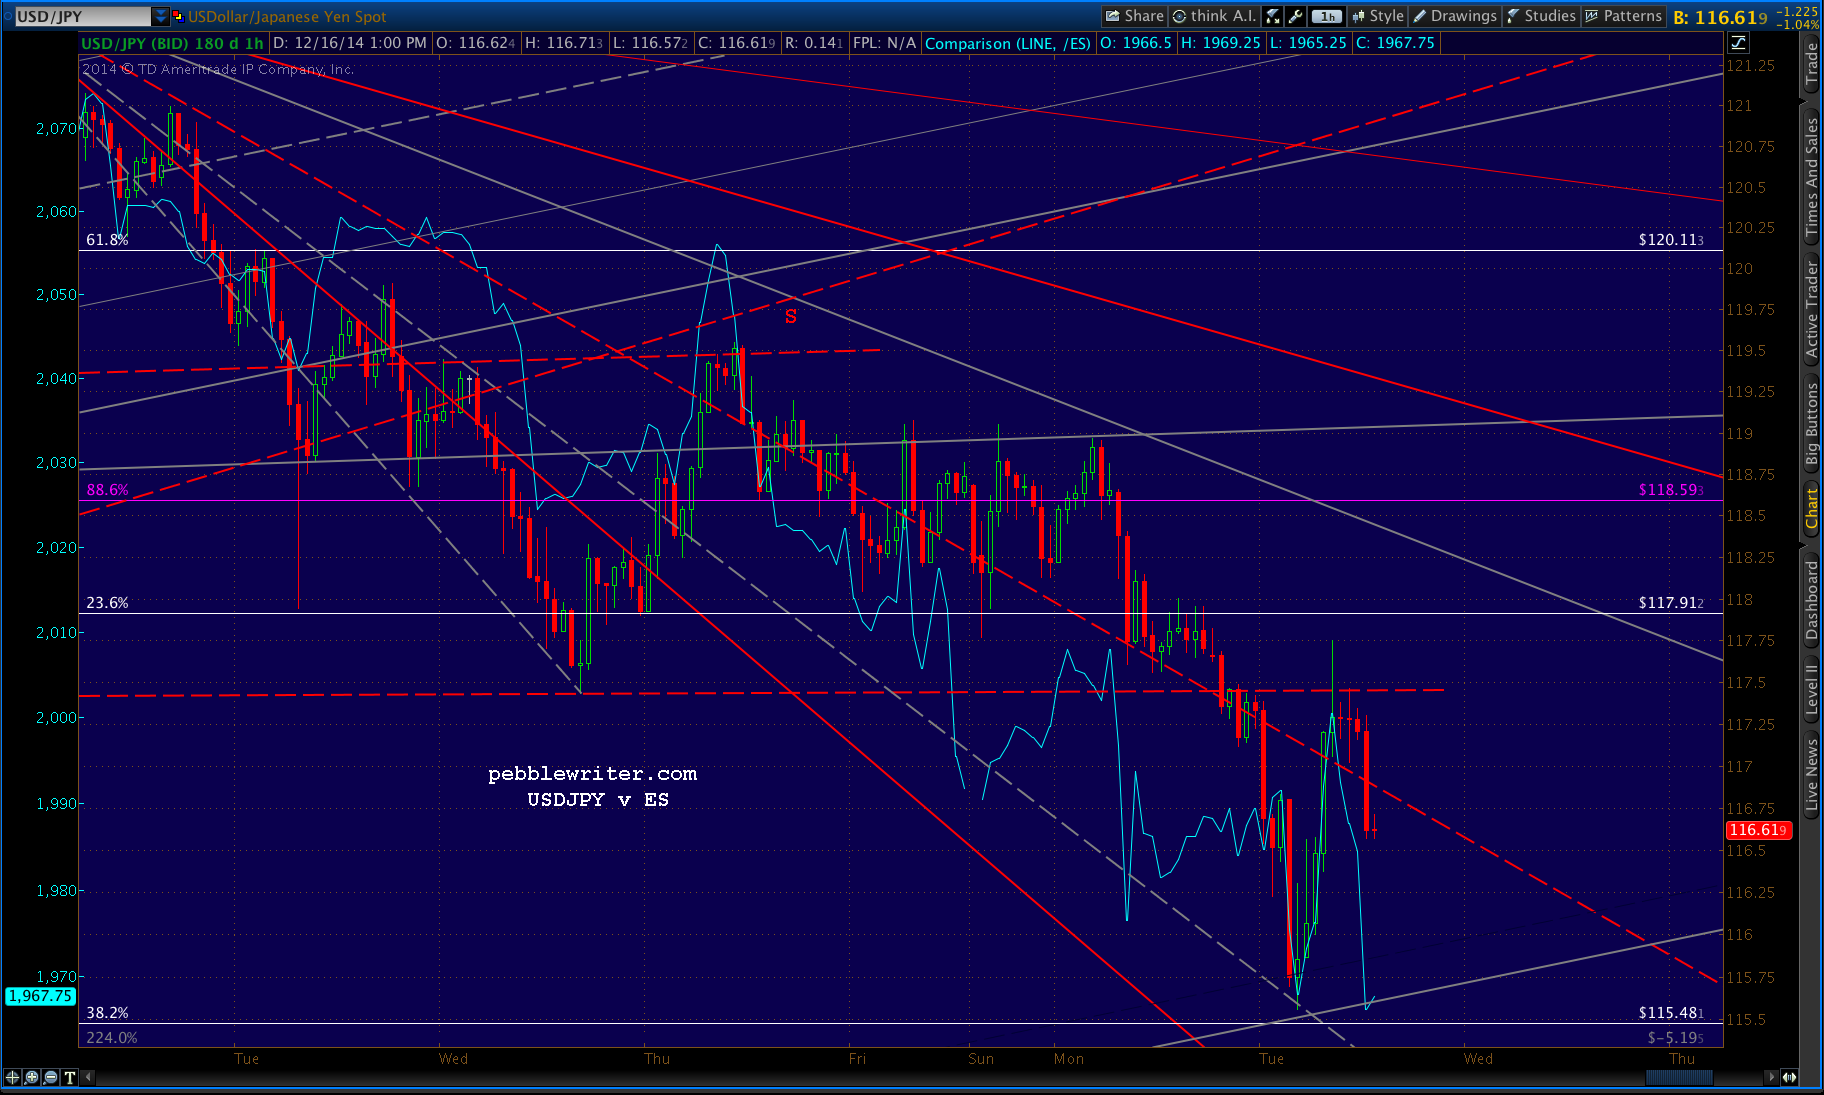
 Second, rates need to rise. I know this is somewhat counterintuitive, but stocks have been positively correlated with 10-yr note rates for most of the past year. At no time was this more obvious than in mid-October, when the plunge in SPX (thin purple line below) mirrored the plunge in rates.
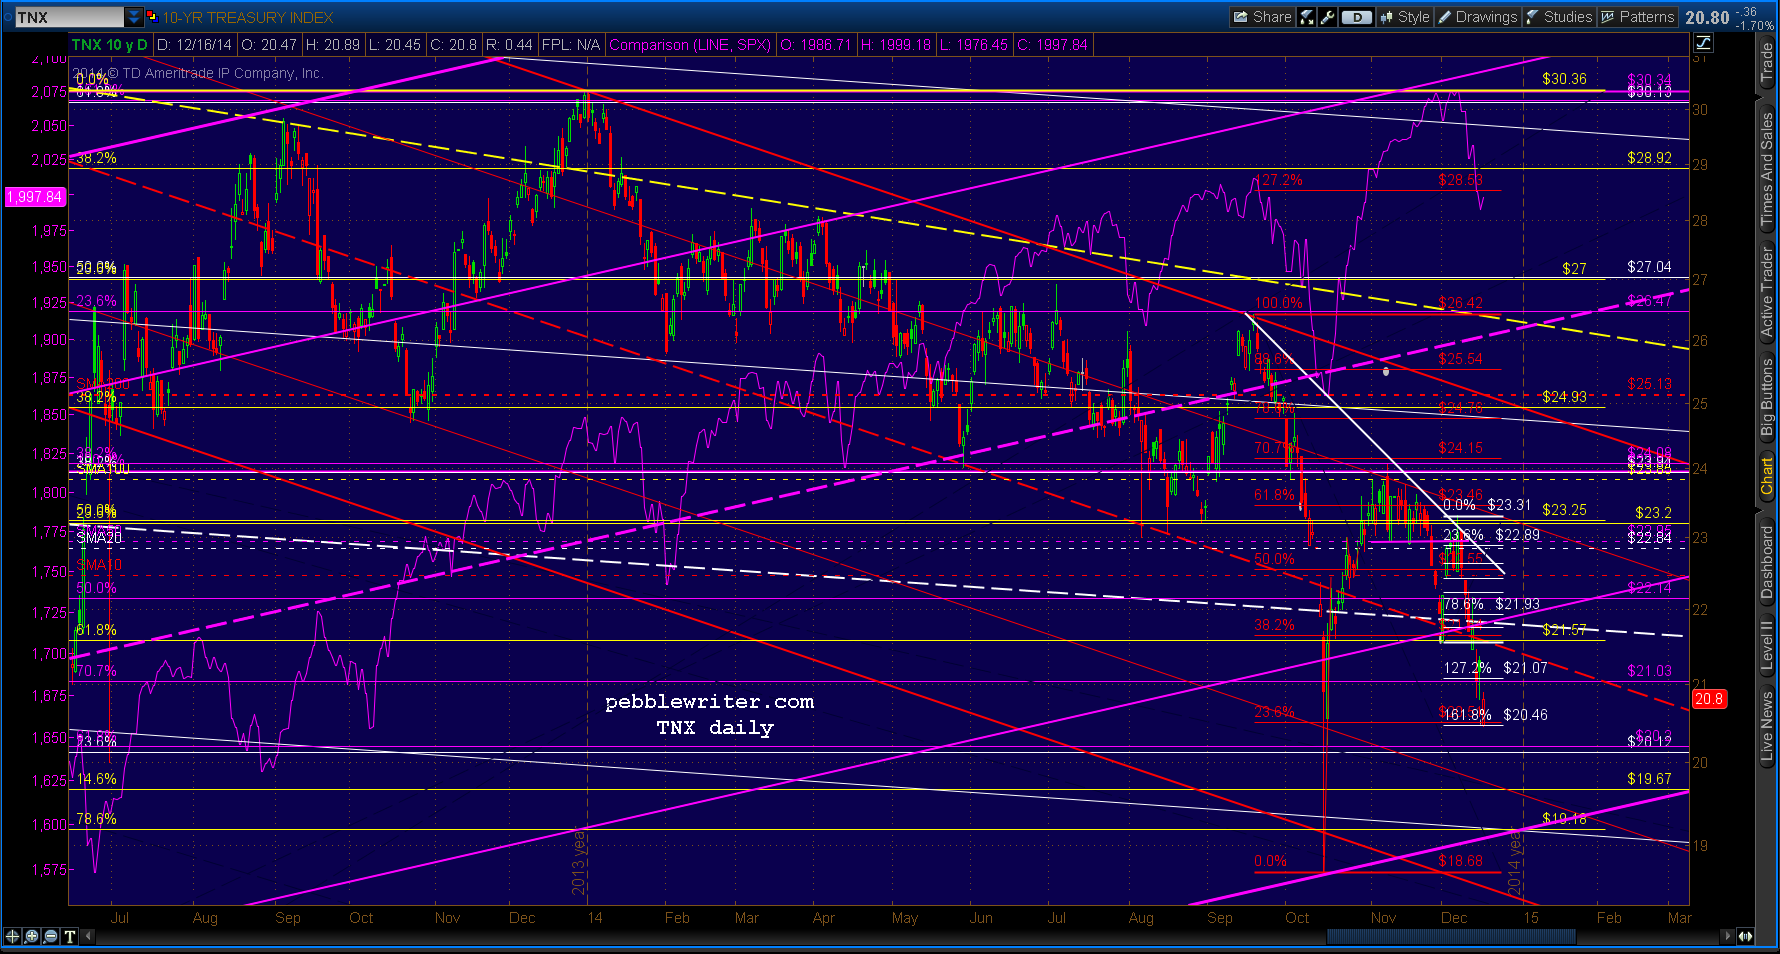 The mechanism is straightforward: higher rates = higher dollar = higher USDJPY = higher stock prices. It’s the secret sauce in the carry trade.
Sure, in the longer run, higher rates will undermine corporate profits and the nation’s economy — both of which have counted on ZIRP to balance their books. But, that’s something to worry about tomorrow, not today.
The somewhat tricky part here is that if the Fed simply raises short term rates, stocks will plummet. So, they’ll work to steepen the yield curve as they’ve done many times in the past. Bottom line, the Fed will need to do their part — starting with tomorrow’s statements which I expect will strongly boost stock prices.
One side note, while TNX should rebound to backtest the broken white channel midline or higher, the charts still suggest a large drop shortly after year-end: the yellow .786 at 1.92 or even the .886 at 1.78 (further out into late Feb or March.)
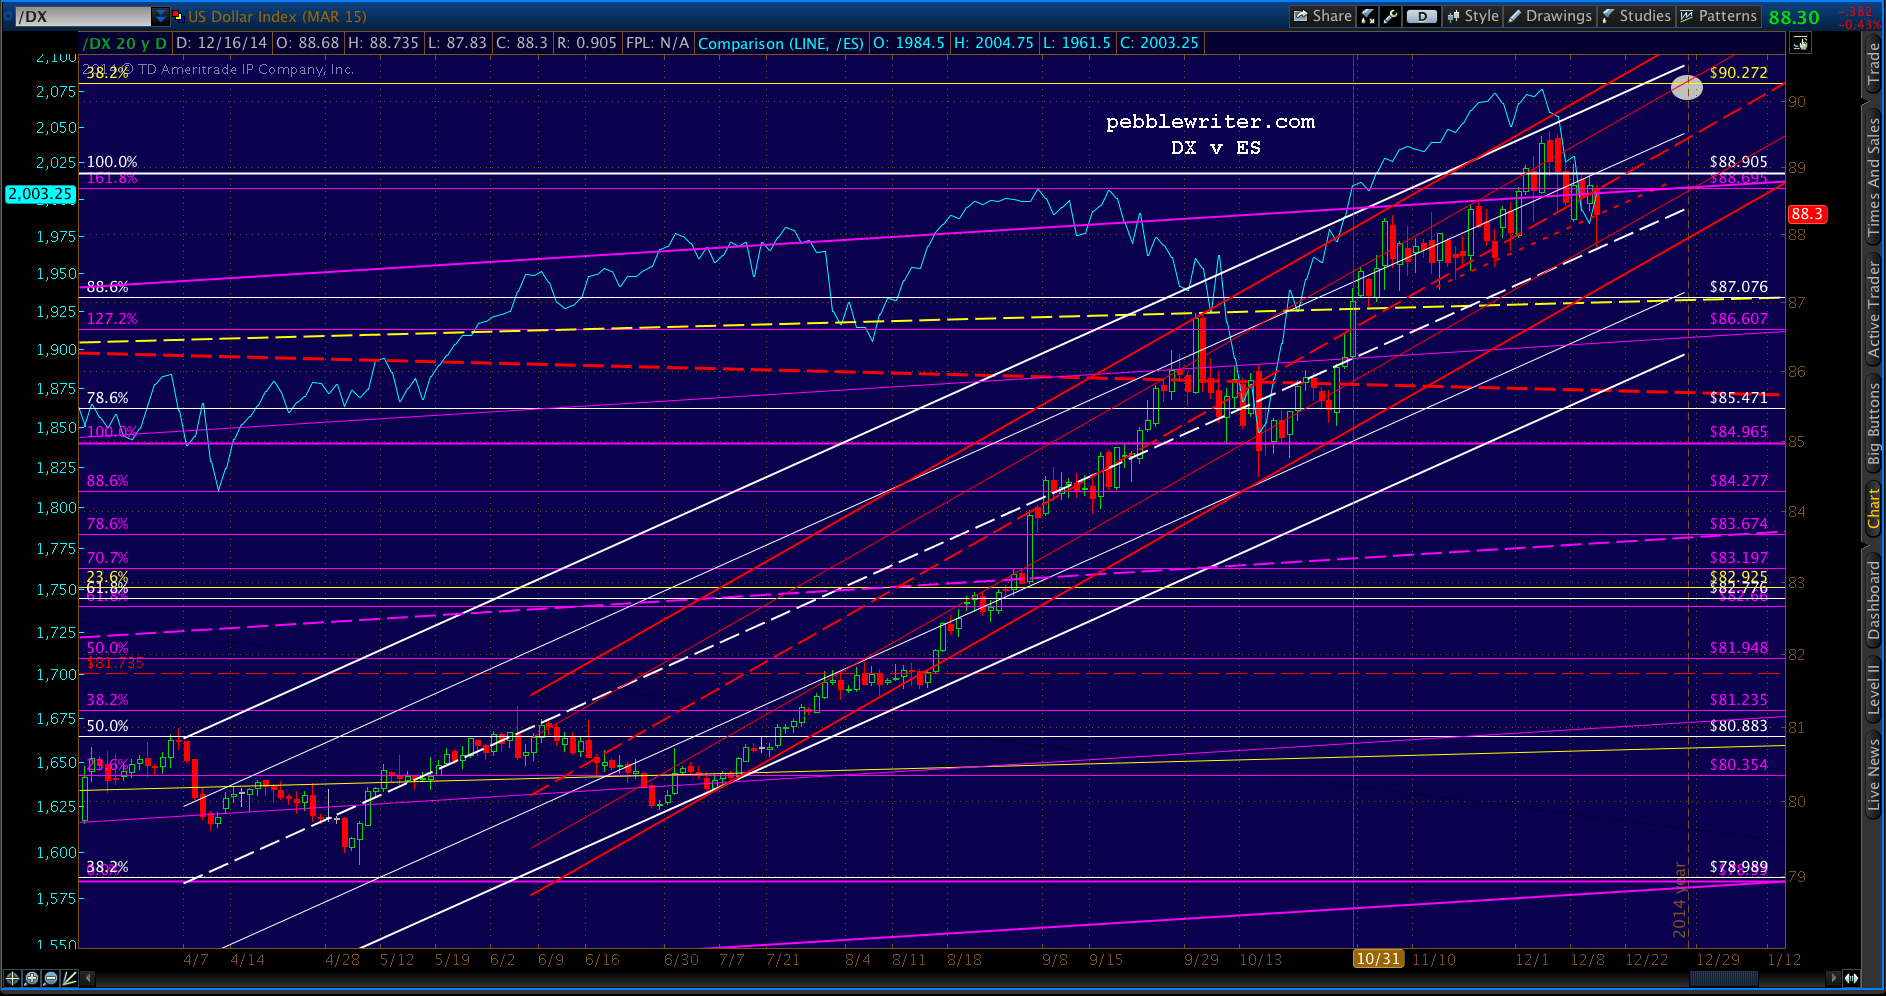
I expect this will also boost DX to our year-end target of 90.272 [see: Dec 3 Update on Currencies.] A reversal to flesh out either the red or white channel bottom looks likely at that point.
The other target from our Dec 3 year-end forecast will also no doubt aid in the coming rally. VIX just reversed hard at the white channel midline (25.2) and make its way back toward the November lows in the next 10 days.
UPDATE: 11:40 AM
USDJPY is back above the neckline as we expected. SPX is up 40 points from this morning’s lows, so we’ve probably seen the highs for the day here at 2016.89. Look for SPX to digest the gains and settle back to SMA50 at 2002ish as USDJPY settles a bit.
 UPDATE: 12:45 PM
SPX just reached our 2002 target. Time to cash out and wait for whatever the Fed is going to do. Brave souls might wish to hold here, as the results should be positive.
 Just know that we’re likely to see even more whipsawing in the next 24 hours. SPX usually forms a triangle going into Fed announcements. The triangle typically breaks sharply lower, and is followed by a melt-up to new highs. As I’ve learned from experience, it’s an extremely tough pattern to trade.
So, unless you’re a very nimble trader, this would be a great time to sit on the past few days’ profits and enjoy the view from the sidelines — at least until the melt-up has commenced. That way, if the Fed disappoints and prices flop further, no harm done.
As for key levels, look for resistance at the SMA10 (2040, also the purple .618) and SMA20 (2050.) The more important level is probably the red TL — currently around 2060 — and then the former high and white neckline.
UPDATE: 4:00 PM
What a day! After 80 points in intra-day swings, it still comes back to USDJPY — which reversed at the H&S neckline, and sold off from there. I could discuss where it might go for hours, but suffice it to say it needs to get back over that neckline for bulls to have a shot at new highs.
 I will be on the road tomorrow and Thursday and will have a tough time posting throughout the day. The best I’ll probably be able to do is to post after hours, but I might get to sneak in a comment here or there.
GLTA.