

Yesterday’s Fedstravaganza went off as expected, with all the key algo-stoking language left in and no hints of tightening anytime soon. Key points from our Dec 16 post:
When I start nailing downside and intra-day targets as I have the past two weeks, it’s probably time to expect a massive rally that defies traditional patterns and technical analysis.
First, it simply can’t be done without the USDJPY’s cooperation… a bounce back above the H&S neckline and .236 would go a long way to erasing stocks’ losses. And, a move back above the white .618 at 120.11 would essentially guarantee new highs.
Second, rates need to rise. I know this is somewhat counterintuitive, but stocks have been positively correlated with 10-yr note rates for most of the past year. At no time was this more obvious than in mid-October, when the plunge in SPX (thin purple line below) mirrored the plunge in rates.
Sure, in the longer run, higher rates will undermine corporate profits and the nation’s economy — both of which have counted on ZIRP to balance their books. But, that’s something to worry about tomorrow, not today.
The somewhat tricky part here is that if the Fed simply raises short term rates, stocks will plummet. So, they’ll work to steepen the yield curve as they’ve done many times in the past. Bottom line, the Fed will need to do its part — starting with tomorrow’s statements which I expect will strongly boost stock prices.
Sure enough, USDJPY did it’s part, scurrying back (well) above the H&S neckline.
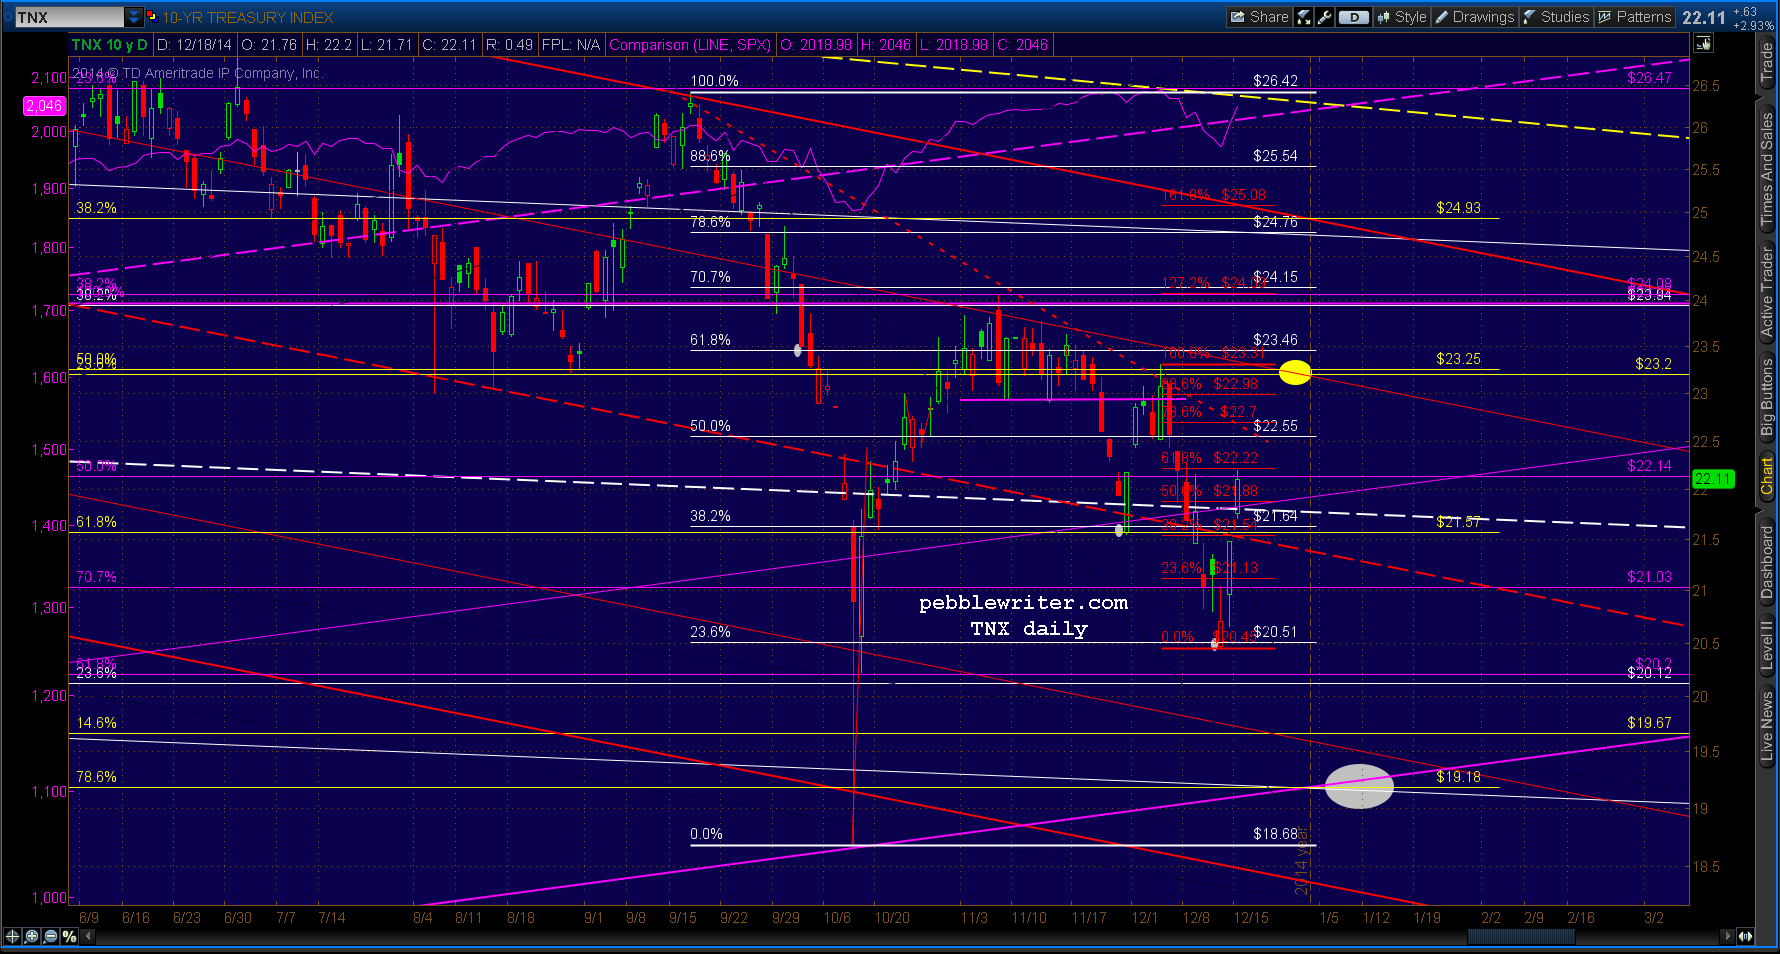
 And the bond market behaved as expected. Short rates remained steady or even dropped a bit, while rates on the long end of the curved ended up higher. The 10-yr, having bottomed out at our 2.05 target the day before, jumped up to 2.15 and is approaching our first upside target.
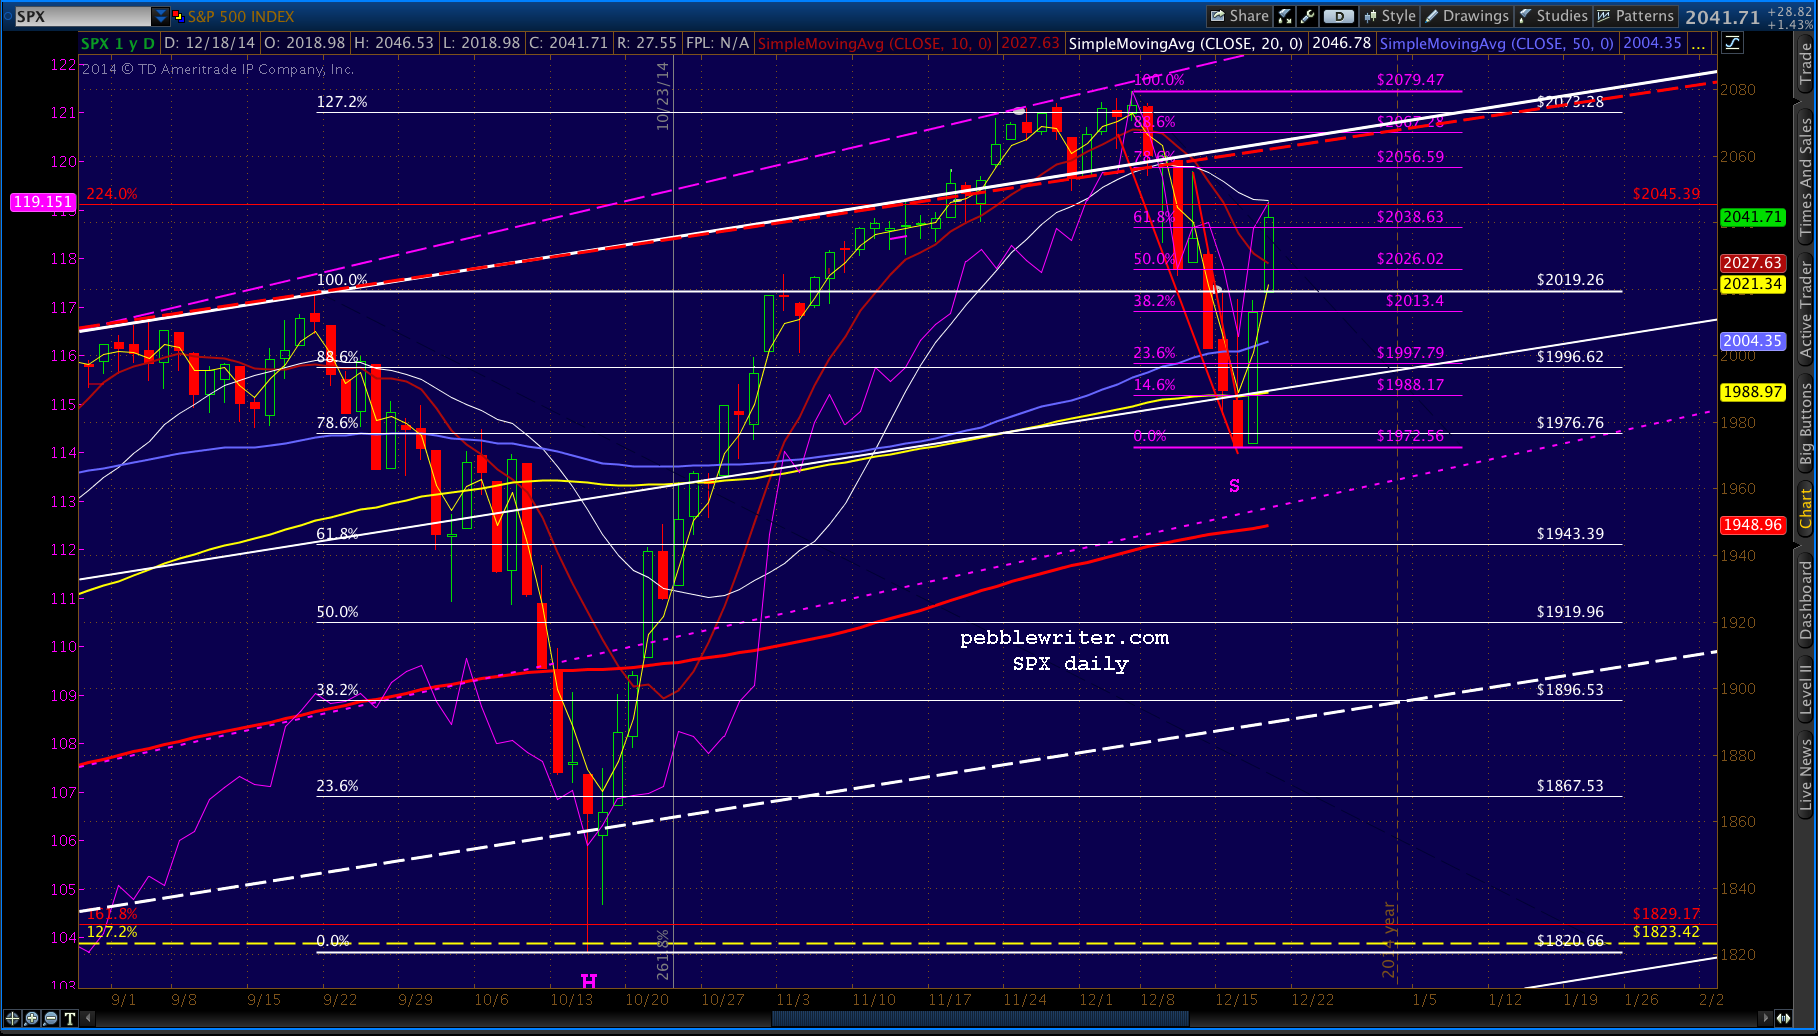
 SPX responded exactly as expected, leaping 44 points before settling back at the .382 Fib (a good start for any “massive rally.”)
 The part we didn’t see coming? The timing of the Swiss central bankers NIRP announcement this morning. The futures are saying 20+ points, so I’d say our .618 Fib target is looking pretty good. From Tuesday:
As for key levels, look for resistance at the SMA10 (2040, also the purple .618) and SMA20 (2050.)
UPDATE: 10:00 AM
SPX barely paused at the .618 (and, didn’t pause at the SMA10). So, we’ll look for a reversal at the SMA20 (currently 2046.84) and count the .618 and SMA10 as support for the first pullback.
 Coming up, our updated forecast. continued for members…
TNX has just about reached the .618 of its last leg down. As we discussed last week, it has broken through the red channel midline and it likely to continue rising into years-end. I’ve placed a tentative target at 23.2 (the yellow dot.)
 USDJPY, on the other hand, is giving slightly mixed signals. The rebound from the .382 was impressive, but it hasn’t quite reached the .618. And, if it does, then there’s the issue of the former shoulder at 119.55 (the red S.)
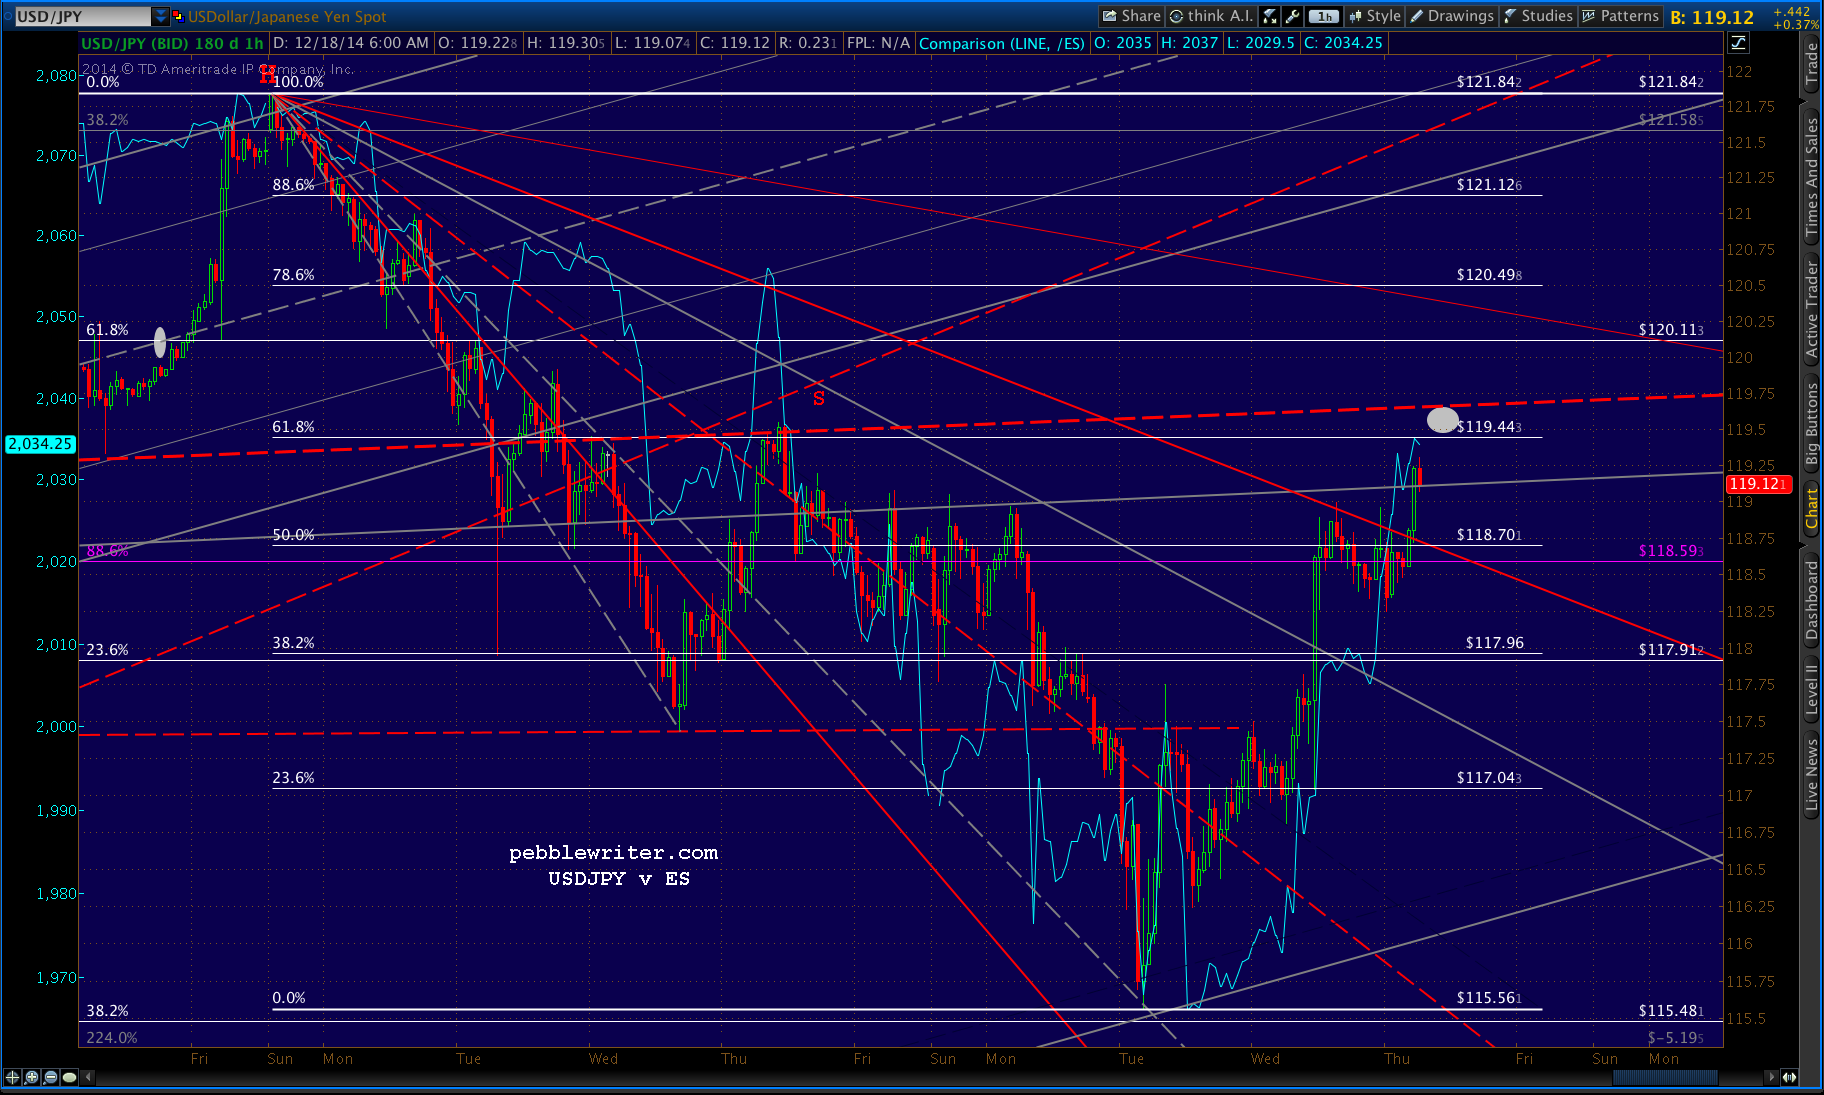 I expect a reversal between here and the .618, and then a push back above the .618 whenever SPX has done whatever backtesting it can muster. As the chart shows, USDJPY could top the .618, but still run into resistance at the .786 or .886s at 120.49 and 121.12 respectively.
Or, it could just as well pop back above the rising wedge lower bound (red, dashed line) and former high at 121.84 if the extra push is needed for stocks at some point. This is my best guess, and it could come as soon as Sunday.
VIX, by the way, sold off significantly yesterday and, today, has bottomed out at the purple channel .236 line. This would be a good opportunity for it to close the gap it left this morning at 19.26. Once the gap is closed, however, look for a return to the channel bottom or lower. 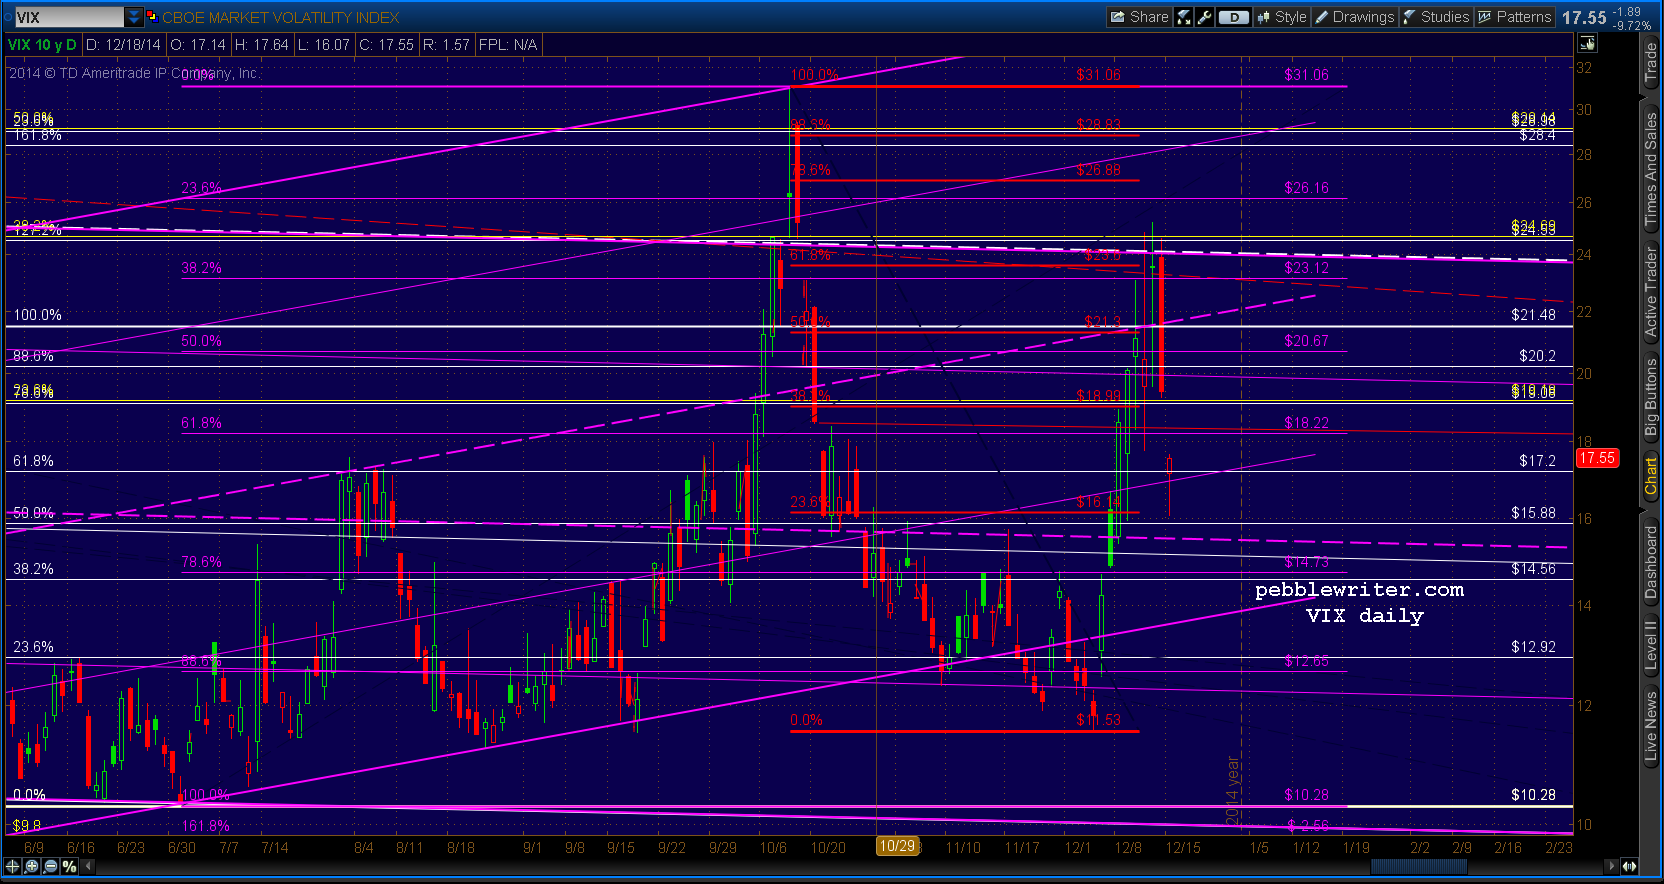 If we get much of a reversal from SPX here, I expect it will be limited to 2019-2026, with a bias toward the upper end of that range. Once the backtest is complete, we should be off to the races again with the next upside target the red, dashed TL connecting the former tops (currently 2062ish.)
 There’s a very good chance it arrives as a gap higher in the morning, a la Oct 23. In fact, I’m using that series of improbable advances off the Oct 15 low as a guide to the next couple of weeks. The pullbacks were very few and far between, came at quite unlikely spots and, more importantly, didn’t come where they normally should have. The 60-min chart below shows more detail.
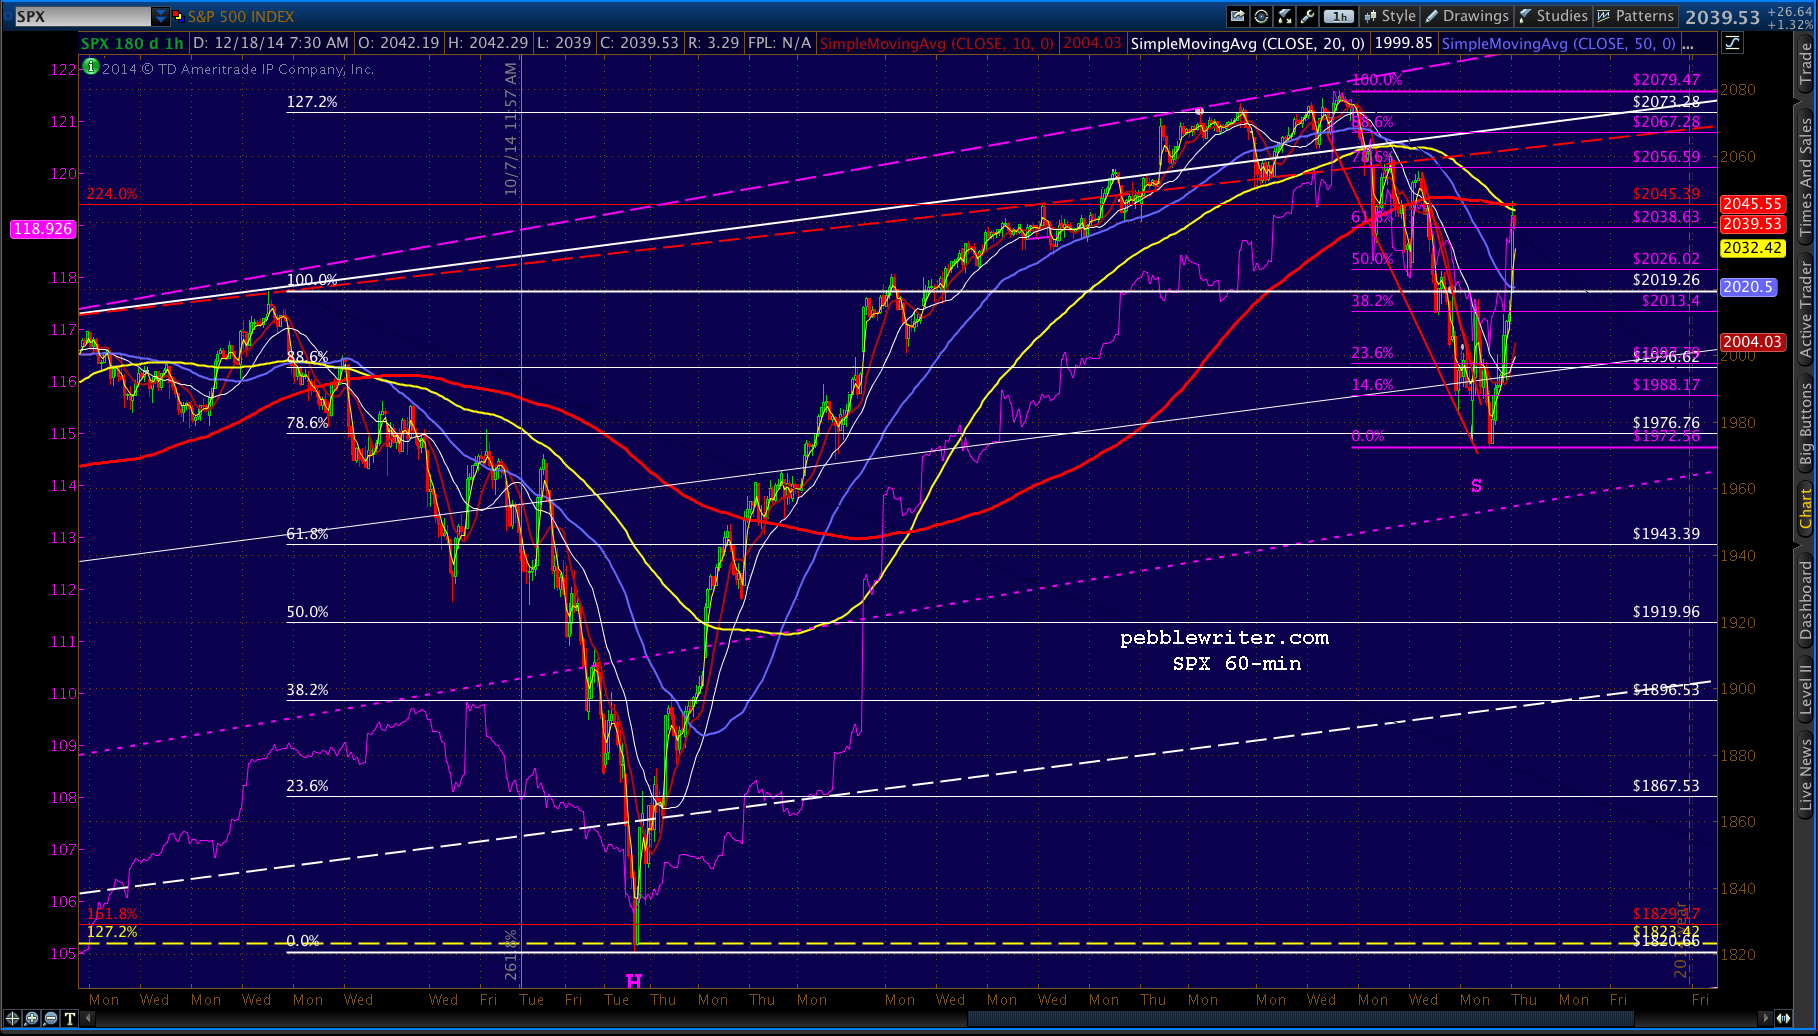
As an aside, note the nifty tag of the SMA10 and SMA100 (60-min period) at this morning’s high. Also, note that the SMA10 is now back above the SMA100, a bullish sign.
As for the next two weeks, our 2138-2145 forecast is still intact. I believe it will either happen in the last week of the year with a push through all that Fib resistance based on central bank intervention (USDJPY ramp, VIX smash, etc.) or in early January, after the 2014 numbers are in the bank.
The chart below shows a potential Inverted H&S Pattern in purple. I realize this is a lousy pattern. The neckline slopes upward, which is a no-no. But, I think TPTB will use a push through the neckline as a means of convincing any remaining bears that they should finally capitulate.
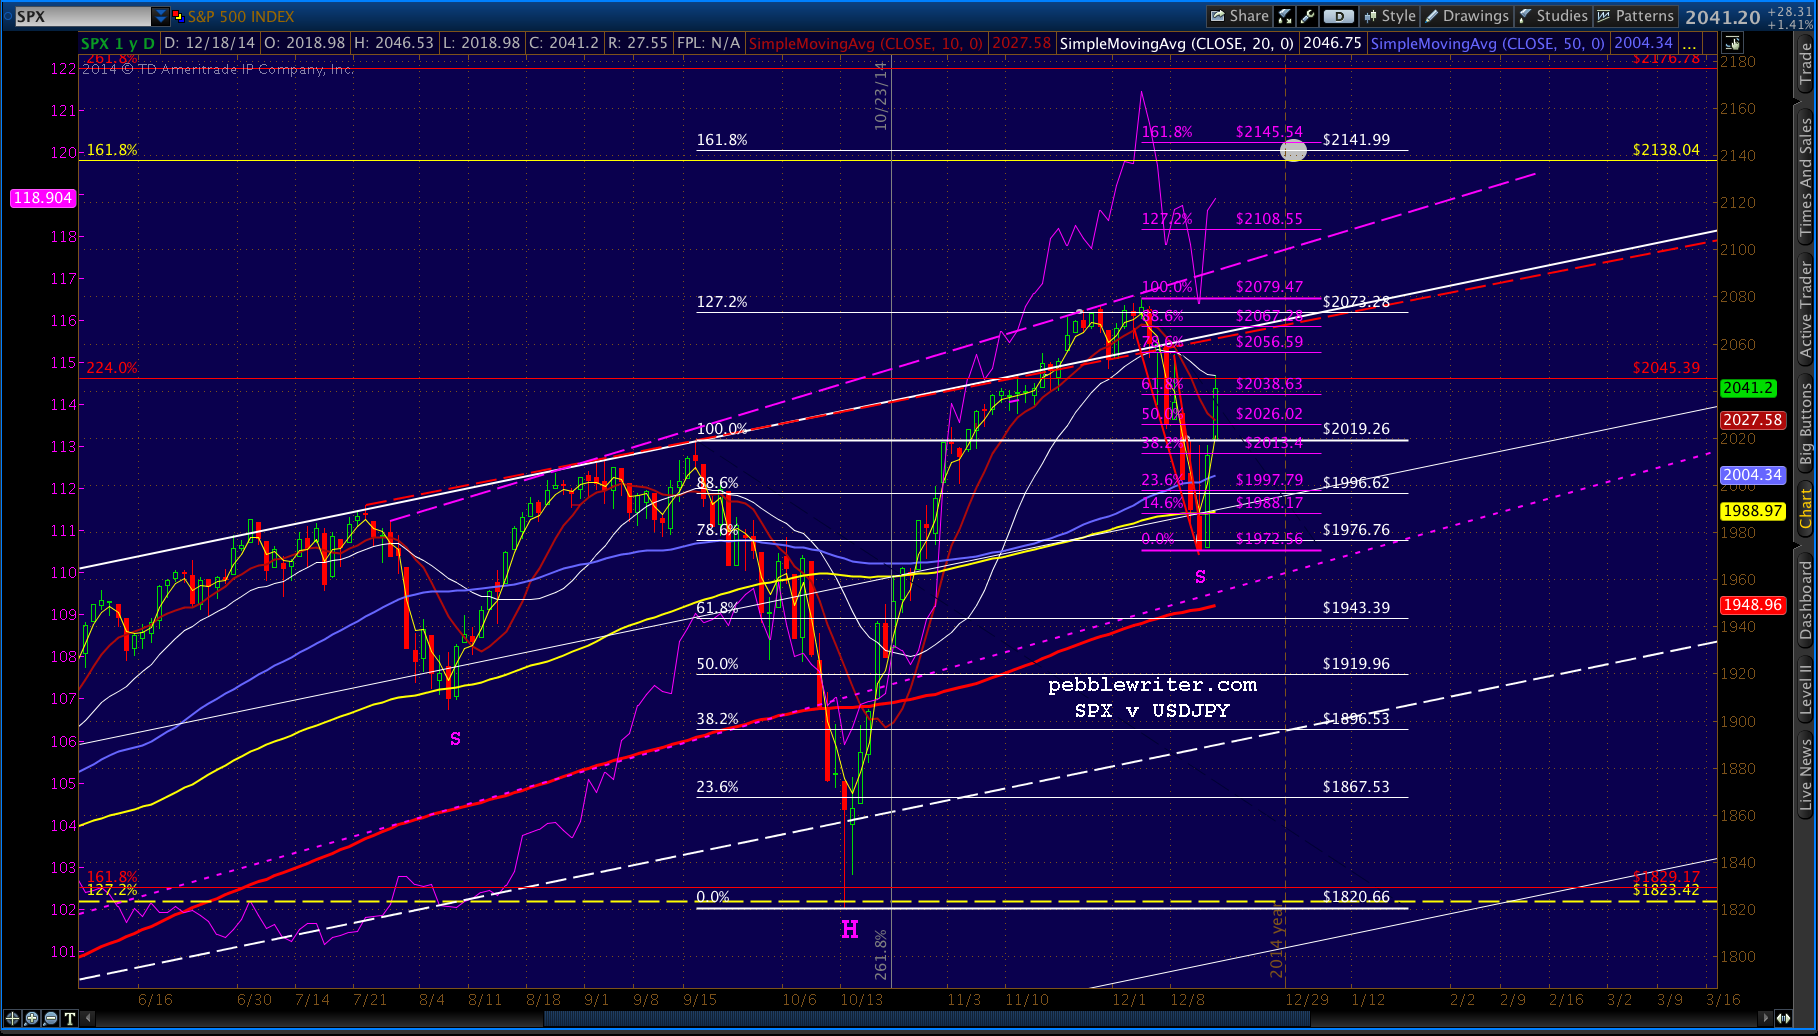 The rally from there should be impressive, but will leave the 2138 Fib level as important resistance. Remember, this is The Big One — the 1.618 extension of the drop from 1576 to 666 between 2007 and 2009. In an unrigged market, it would spell huge trouble for bulls. This, however, is the furthest thing from an unrigged market in our lifetimes. So, look for a great deal of manipulation to occur if the rally is to push through it.
UPDATE: 11:30 AM
SPX’s reversal at the SMA20 was picture perfect. The only question is how much of a reversal we’ll get. My best guess — and, it’s only that — is 2026ish which would represent a backtest of the red TL (a megaphone pattern), the purple .500 Fib and the SMA10. And, it might just come at today’s closing bell in order to set up a gap higher in the morning.
The road map for the next couple of days is indicated with the white dots. We can also see the potential for a promising bullish white channel.
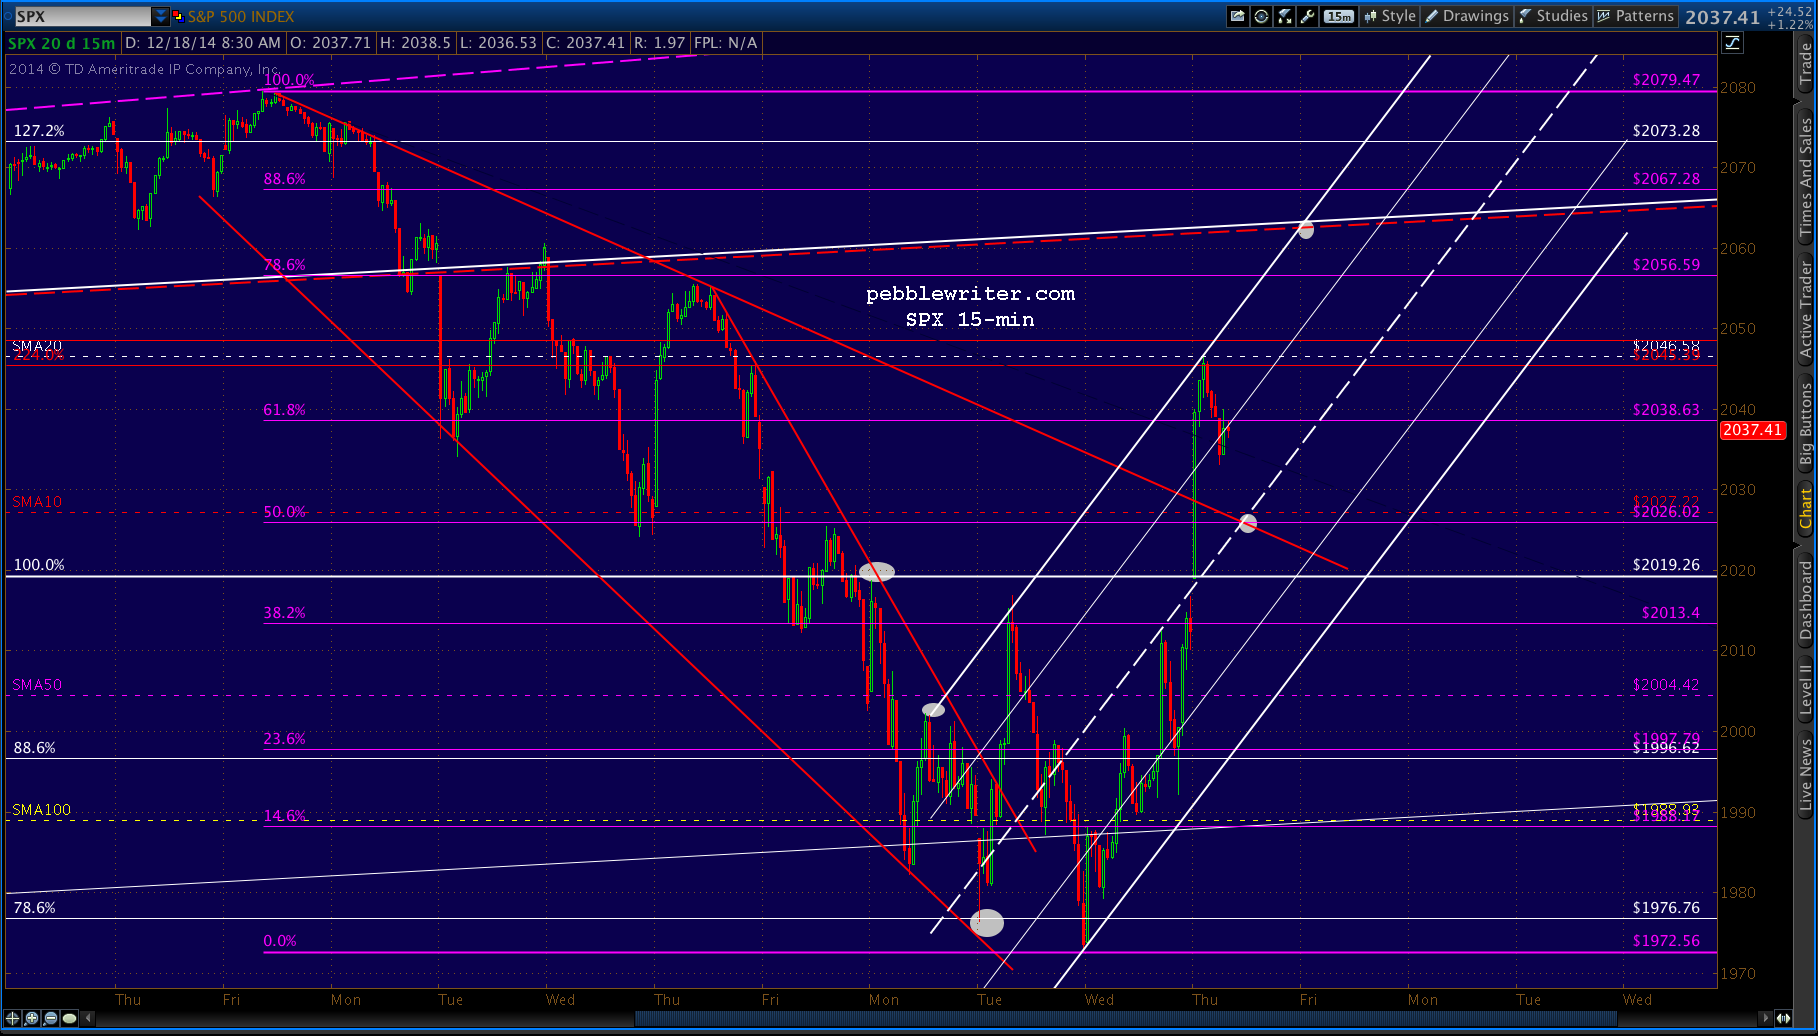 One last note: while I’m fairly confident about the upside case here, there are many, many bearish economic and geopolitical issues that are far from settled. Should any one of those trump the central bankers’ script, there is a clear downside path to 1943 — the white .618 and just below the SMA200. Don’t think it will happen, but it’s worth keeping an eye on.
GLTA.
UPDATE: 3:55 PM
Another record-setting day. Looks like the red TL isn’t going to wait until tomorrow morning. Tough call, but it should back off from here. Whether or not it will is anyone’s guess.
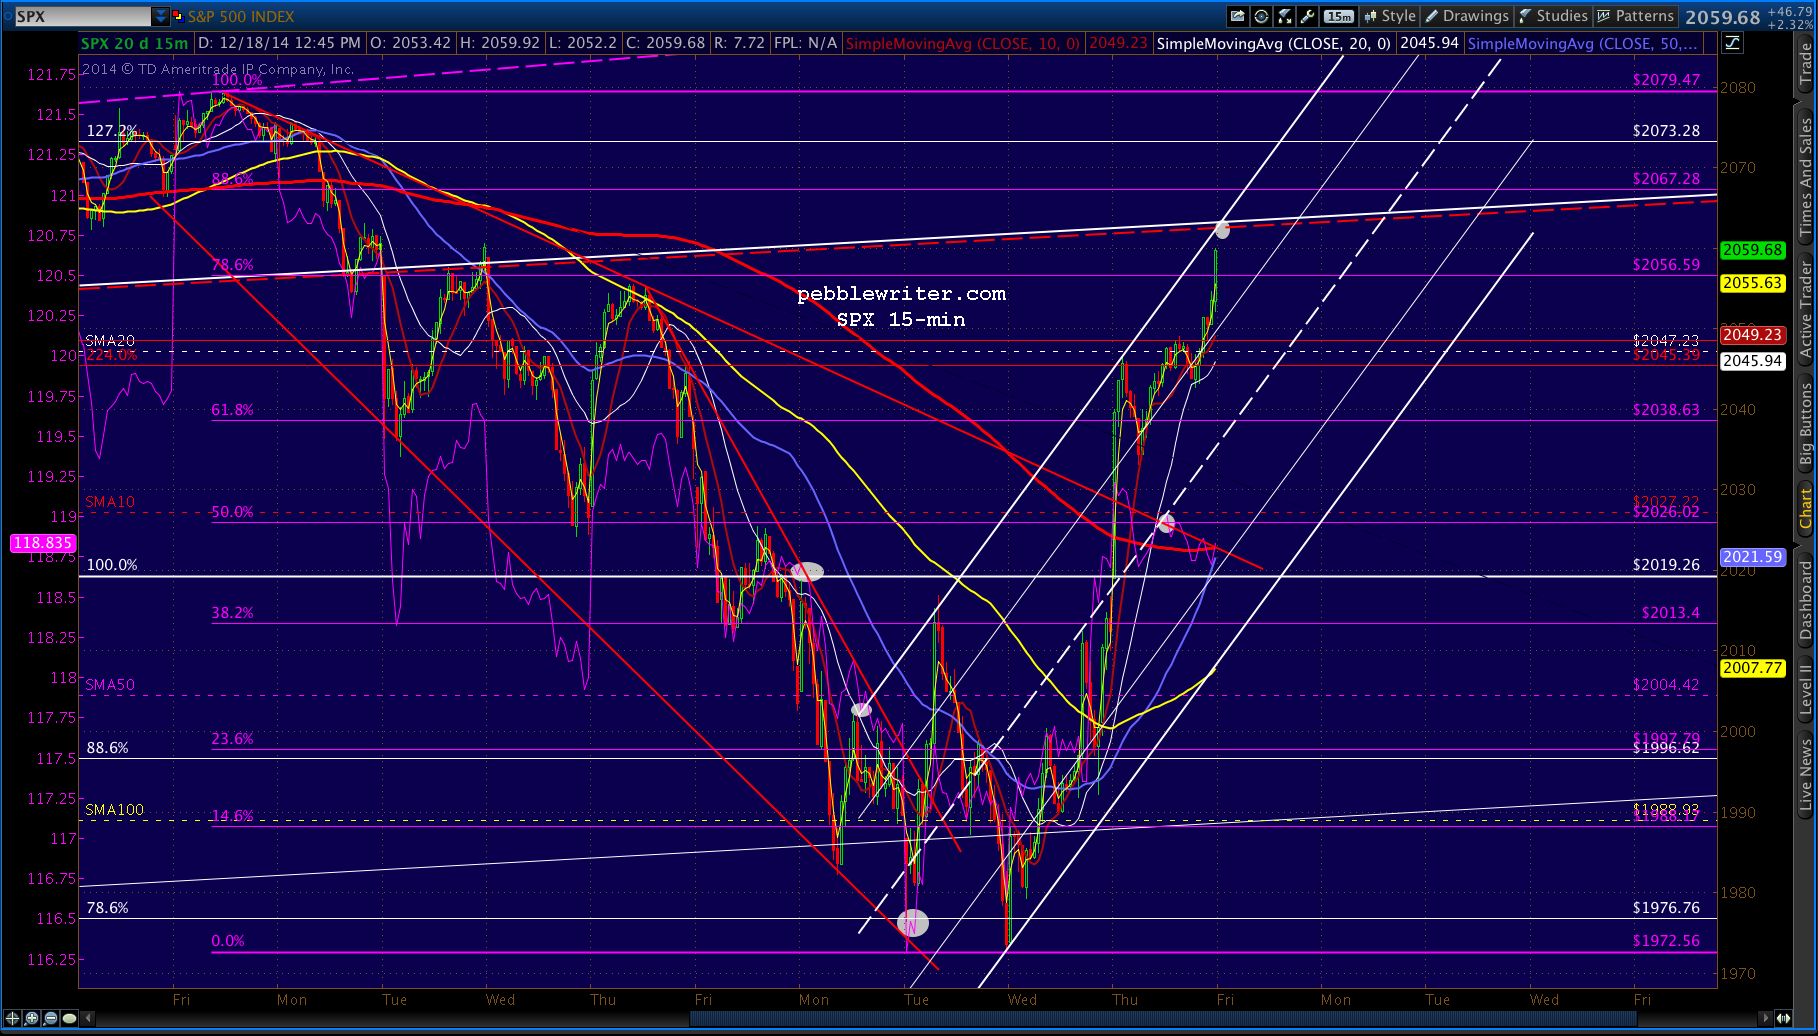 Remember, like any long-term trend line, this one is subject to a certain margin of error. It could be interpreted as what looks like 2062, or the .886 at 2067, or anywhere in the neighborhood.
I think we’ll get a reversal here, though, as USDJPY and TNX still look susceptible at these levels and VIX never did close that gap. Don’t think it’ll be big, but given the volatility, you never know. Initial support is the SMA20 around 2047.
Our 2138-2145 target is now well within striking distance — only two days away in the unlikely event that the rally continues at this pace (it won’t.) Spread out evenly, it’s only 10 points/session if it happens by the 31st.