

Futures are up sharply in a continuation of last week’s volatility.
 continued for members…
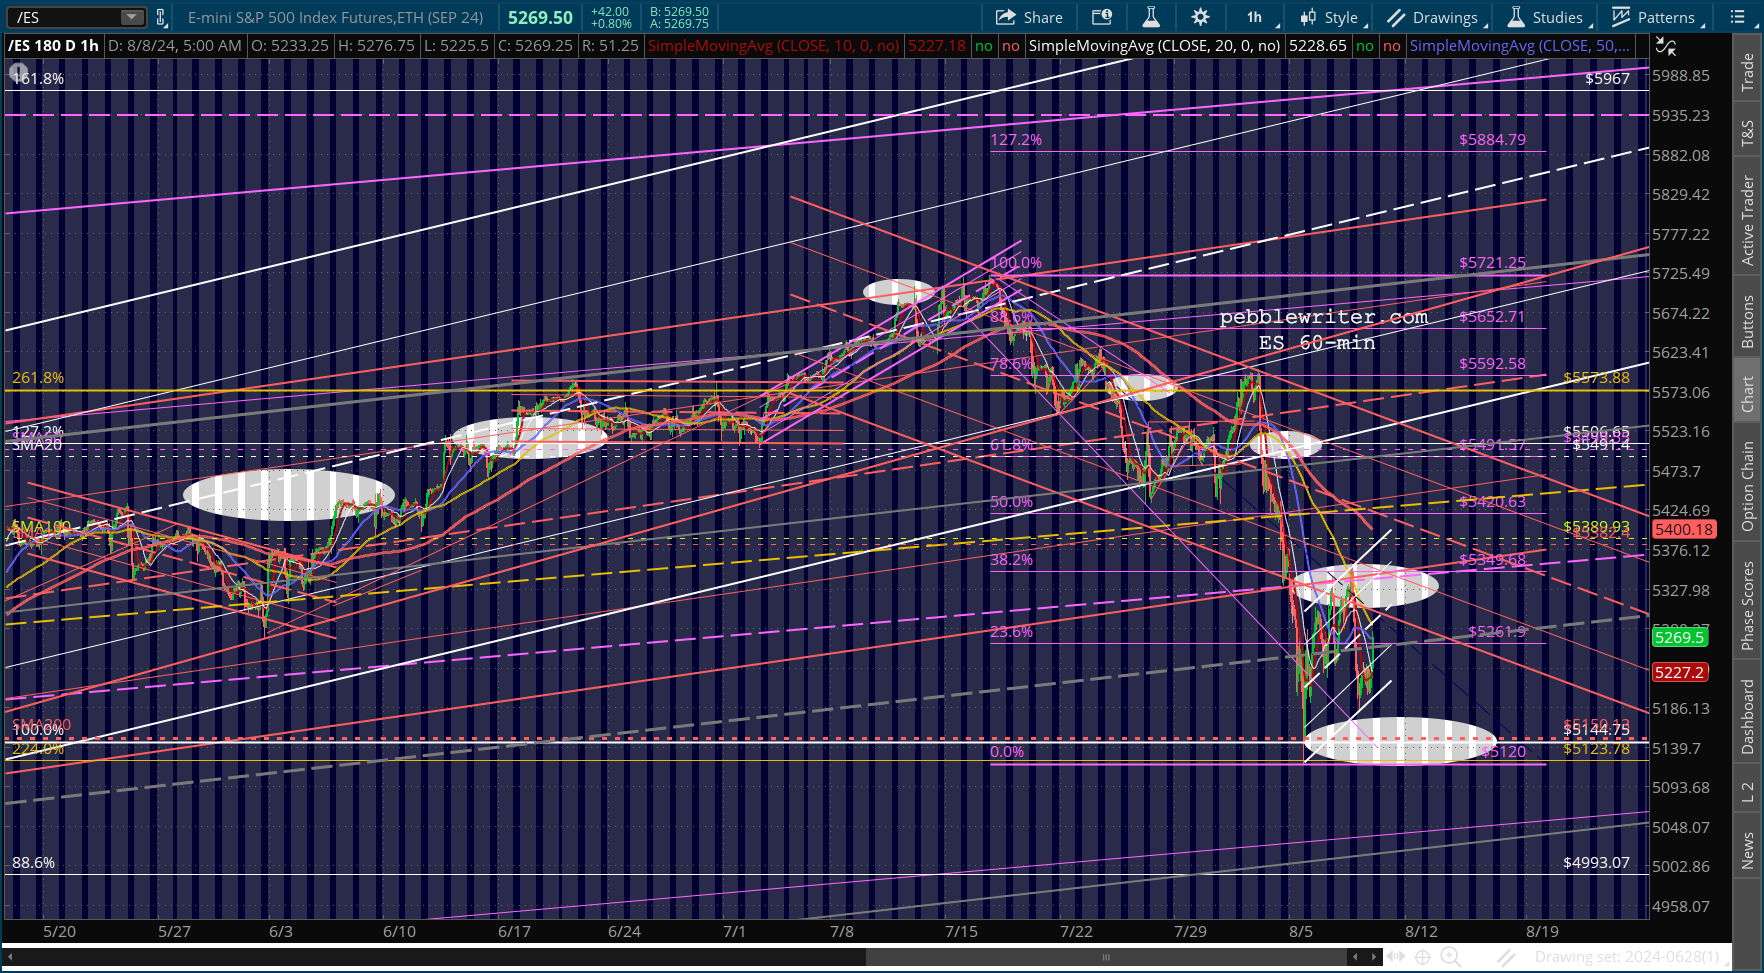
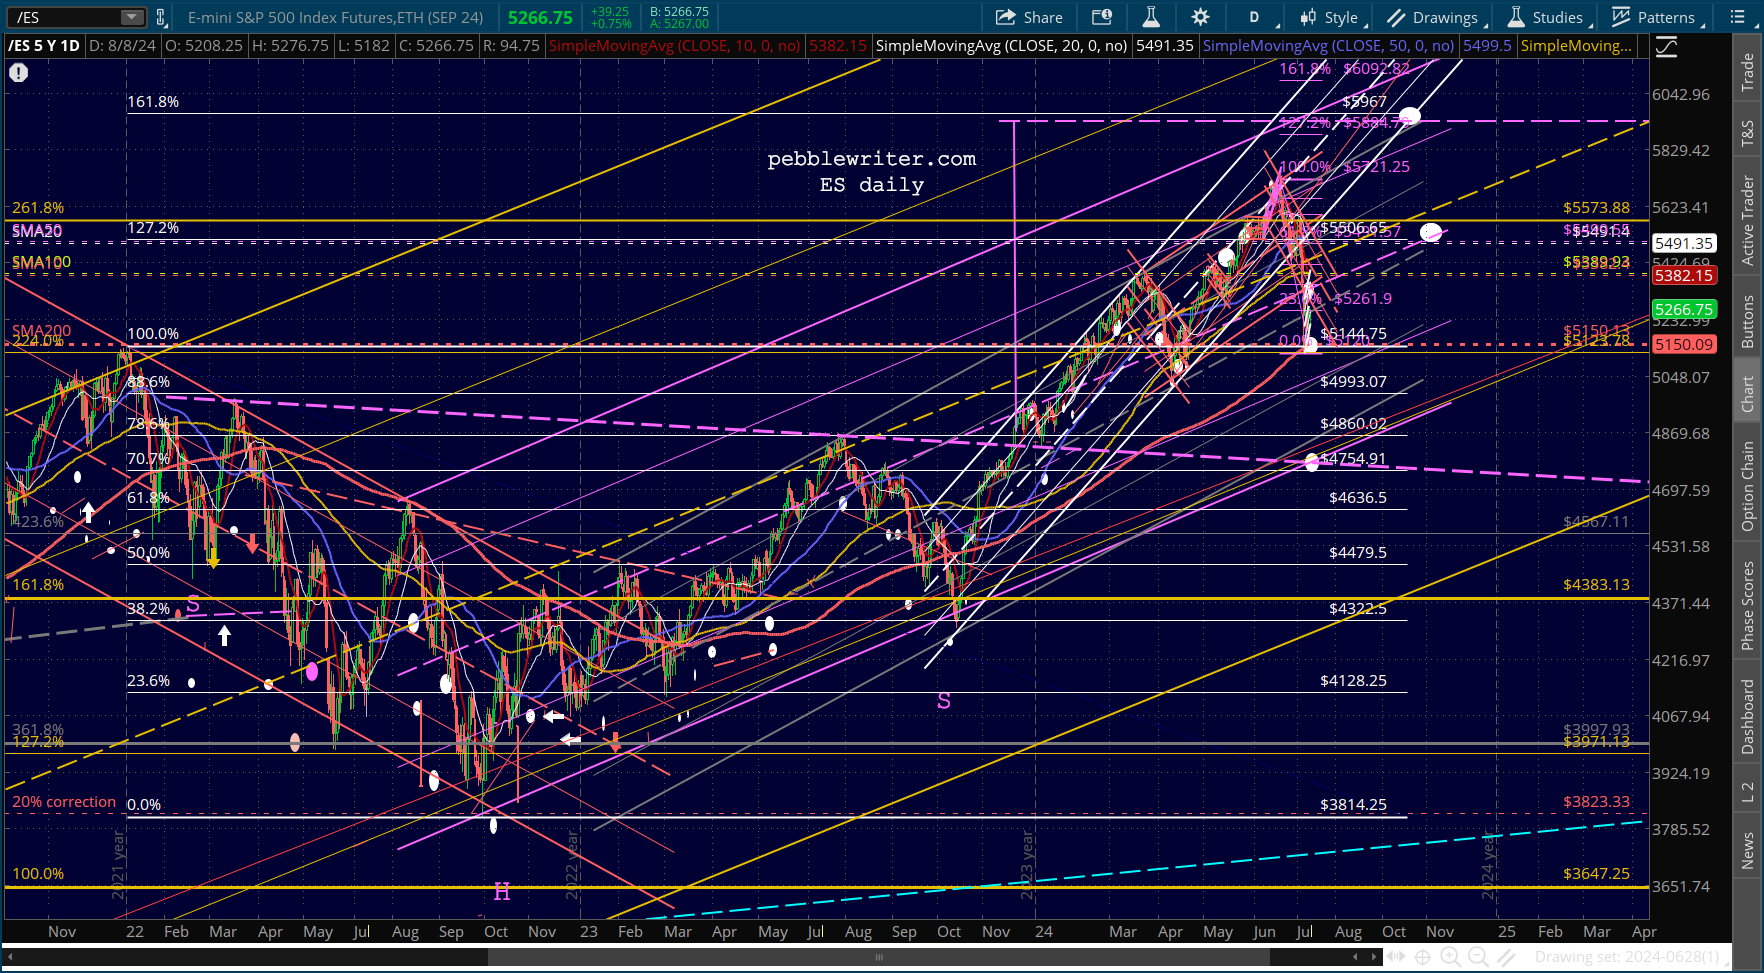
ES is taking another shot at re-entering the broken falling red channel after backtesting the SMA200 a second time.
 Remember, SPX has still not tagged its SMA200.
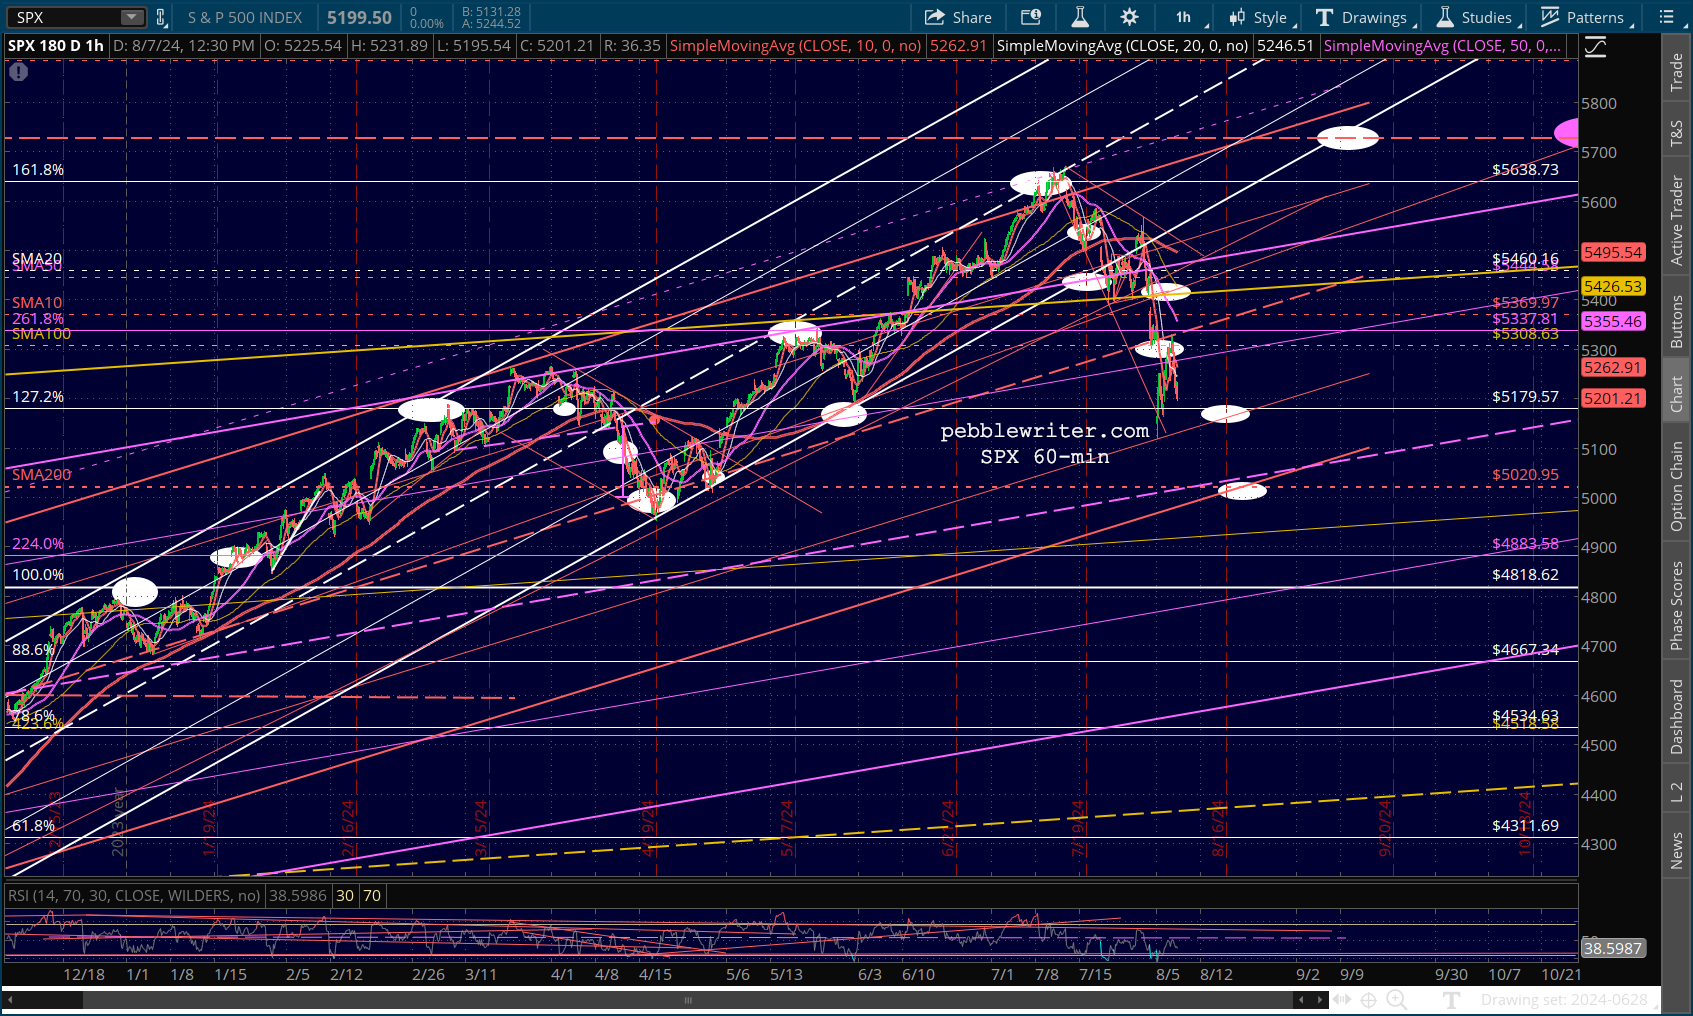
 EURUSD has still not broken out, and doesn’t appear likely to do so.
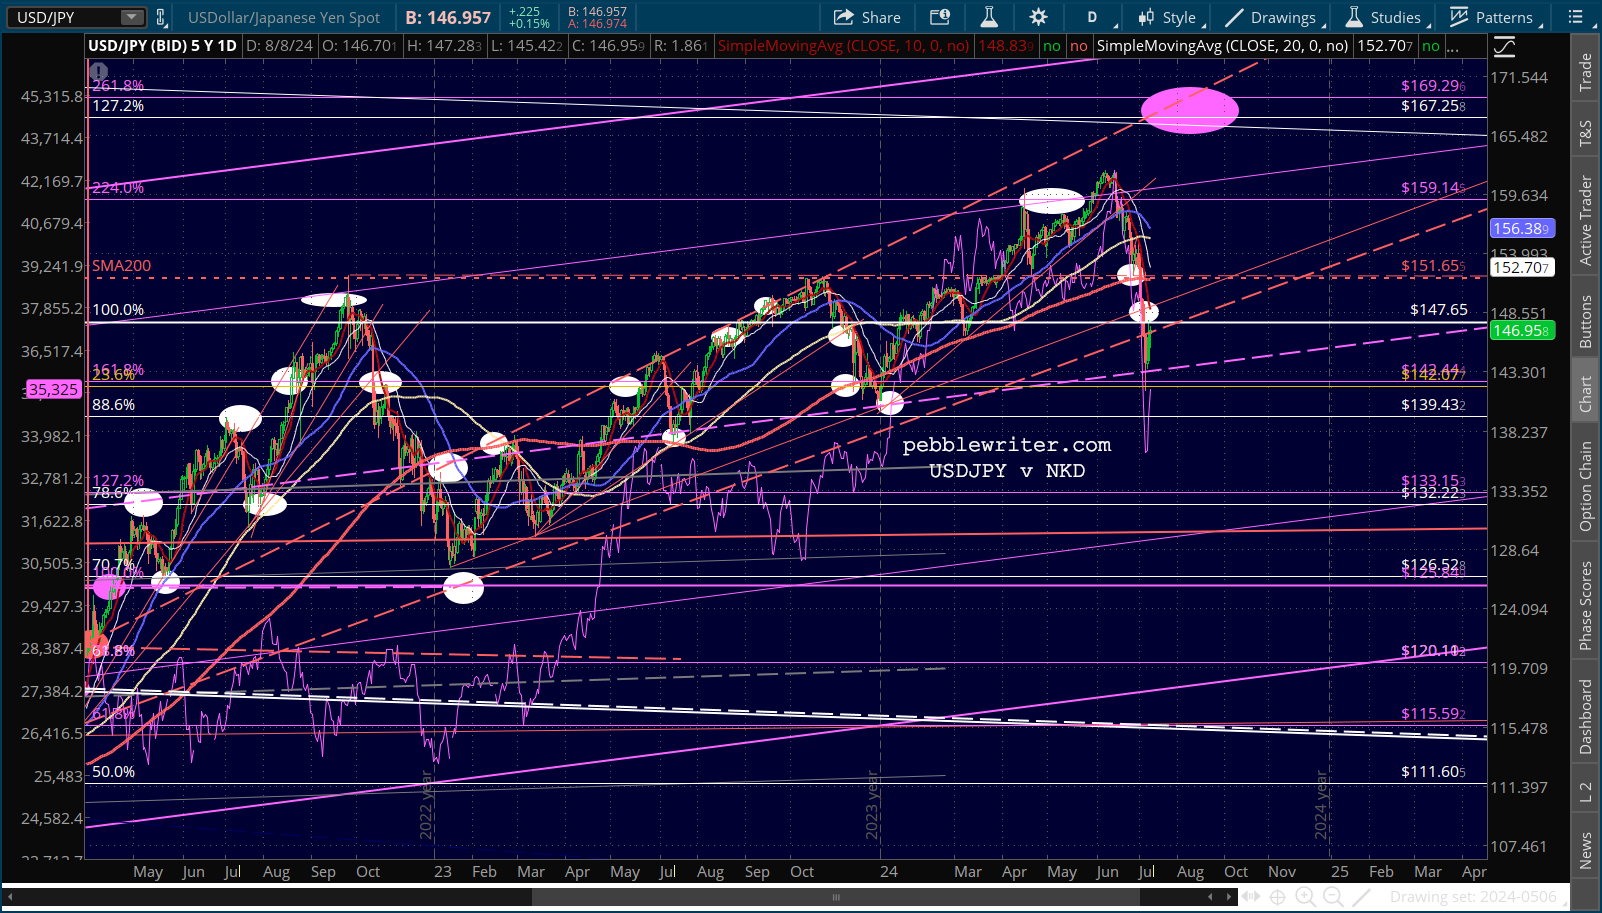
 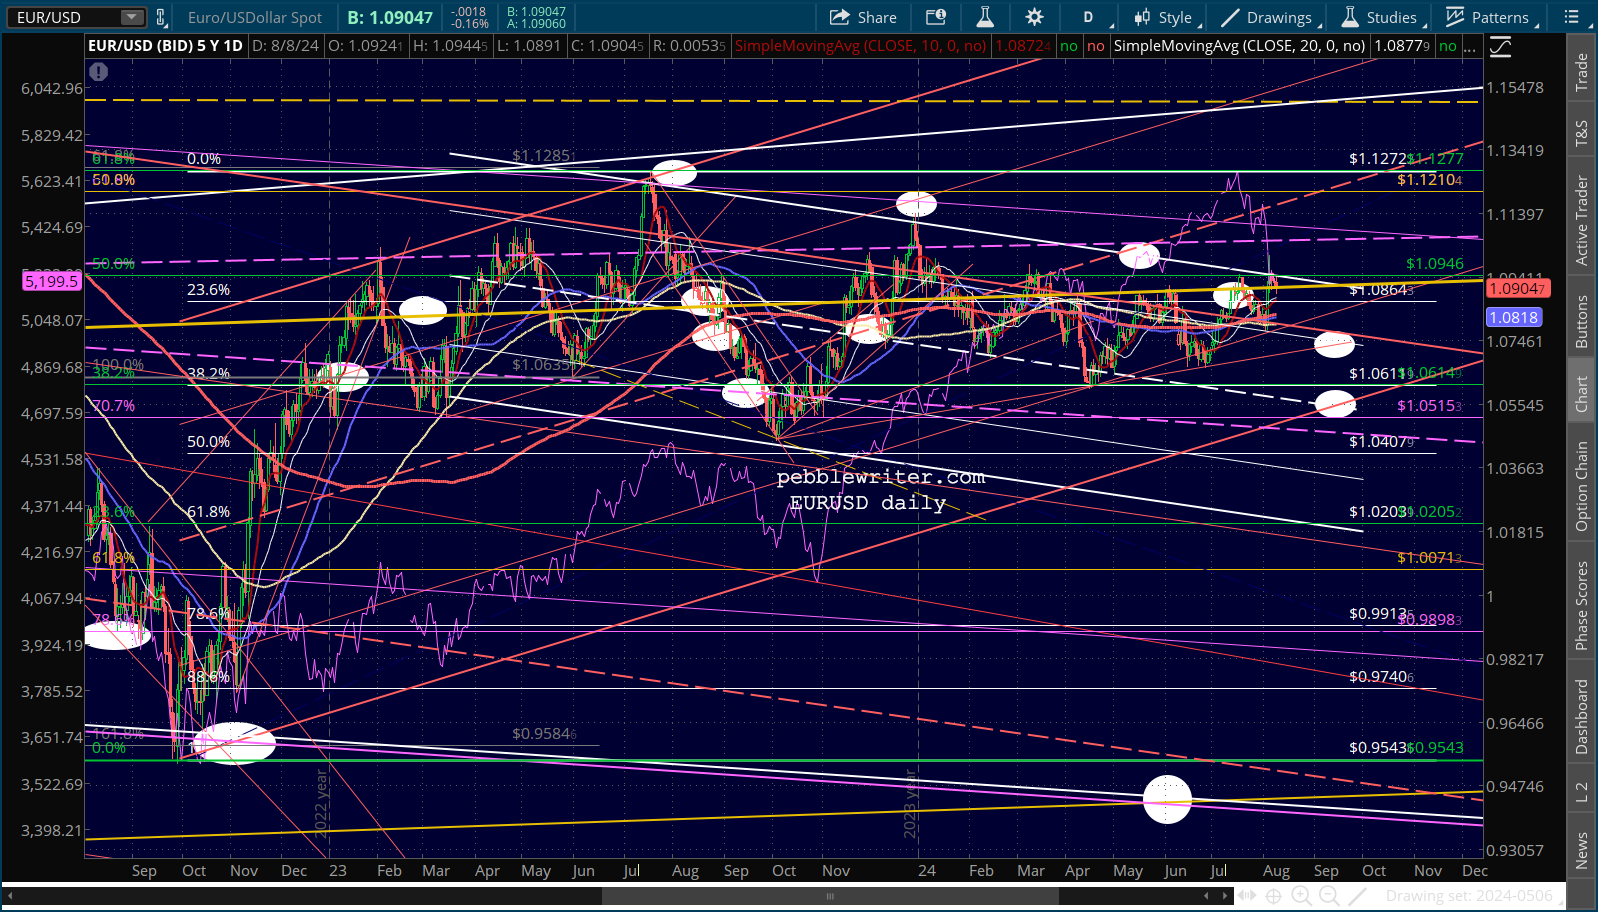 But though USDJPY broke down below important support, it is finding support at the purple channel’s midline.
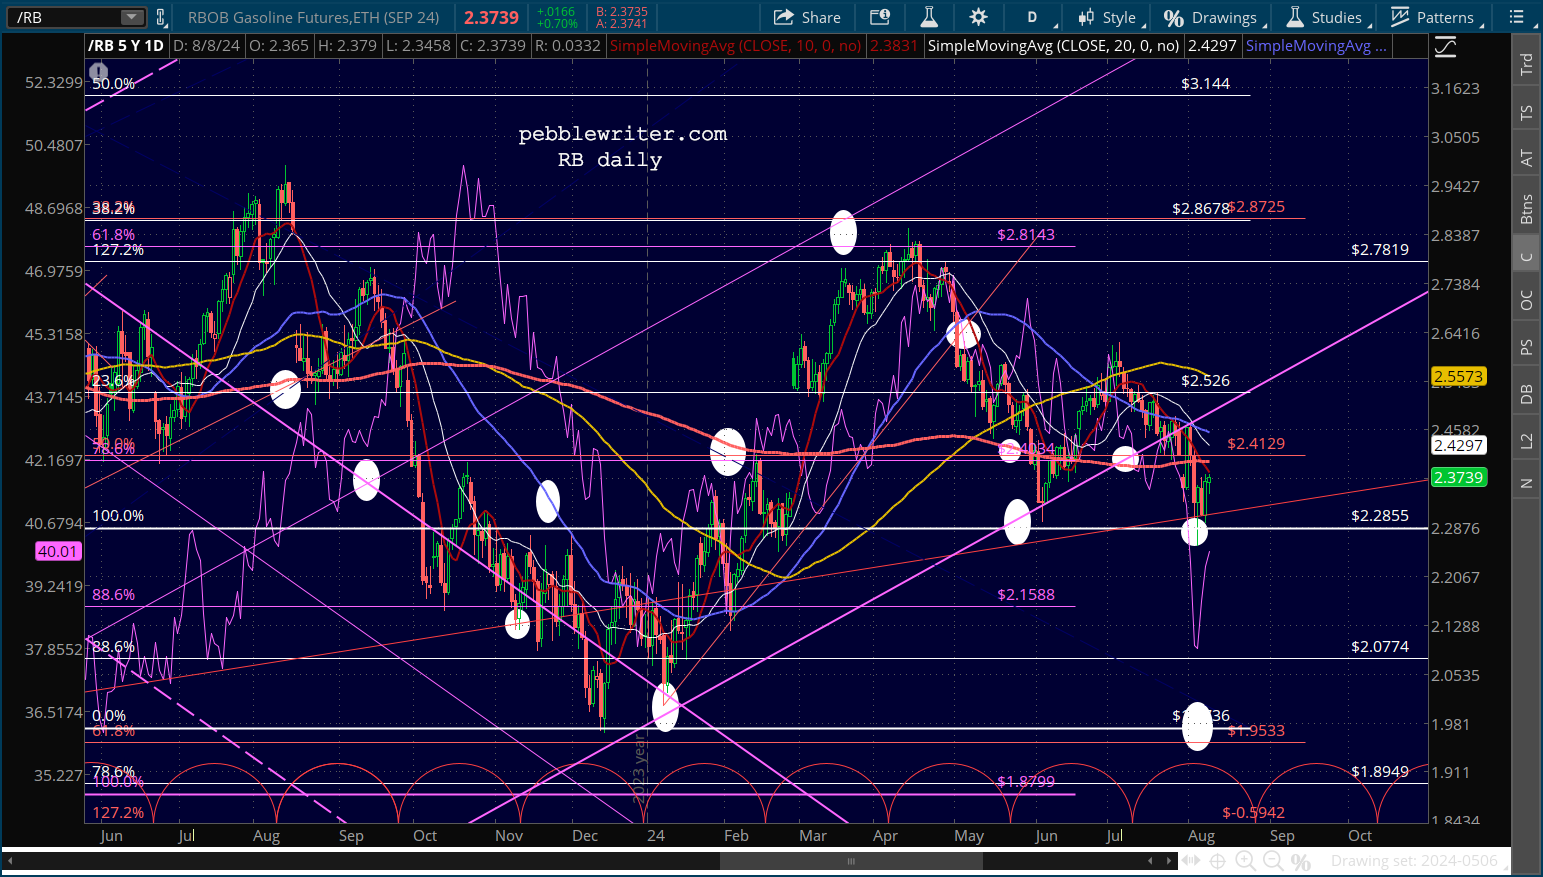
 CL and RB are both moving sideways again, with both below their SMA200 and SMA10.
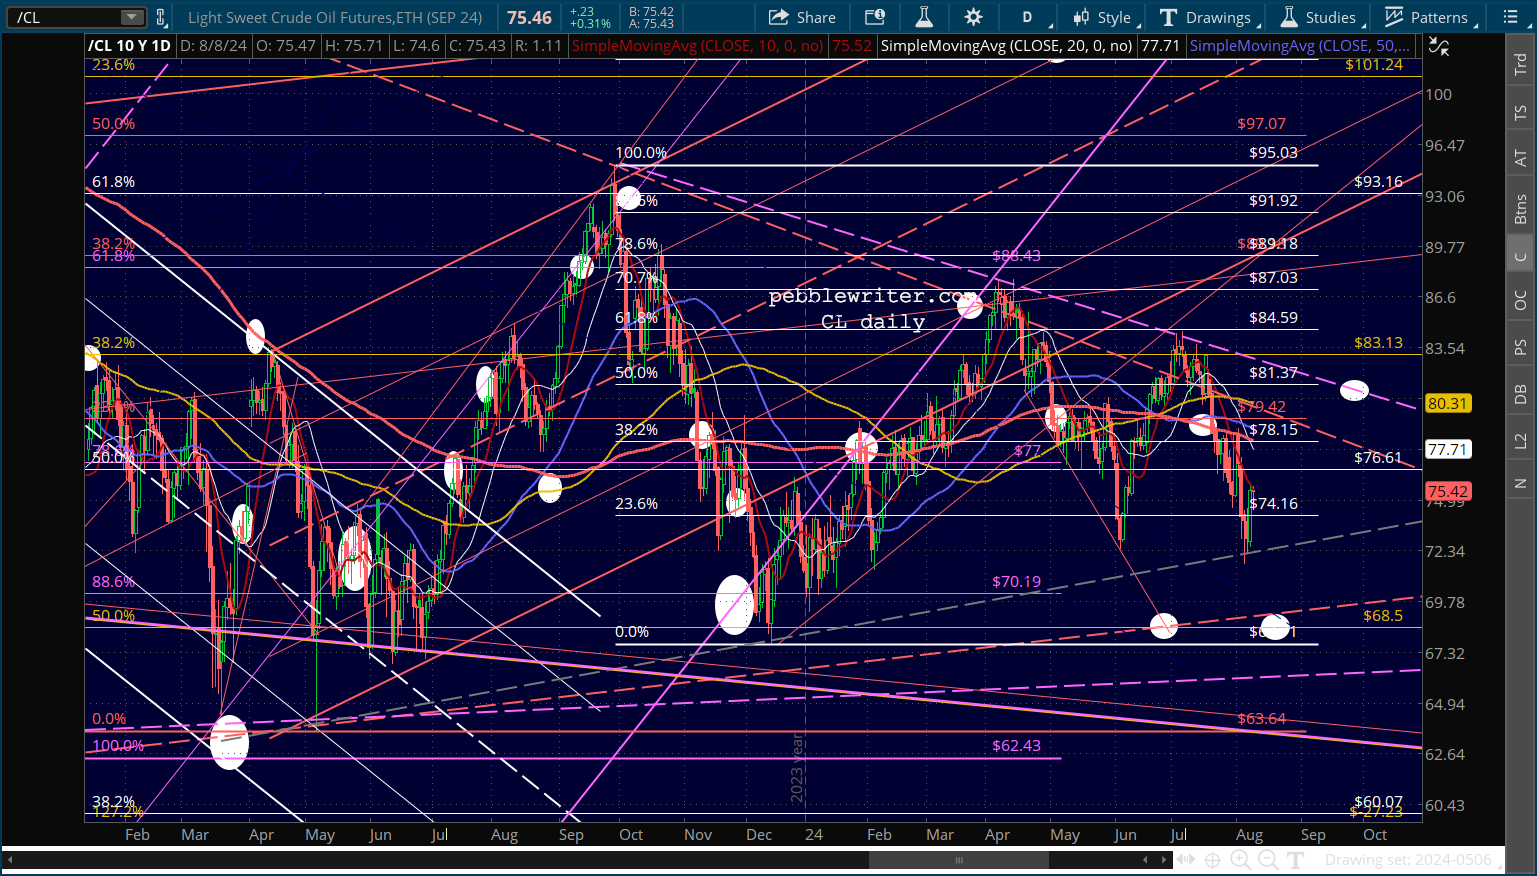
 It’s important to note that these lower levels of gas prices, when inserted into our gas/inflation model, suggests a substantial drop in CPI for the next 2-3 months.The upturn seen in the chart below starts in October, when the YoY delta in gas prices moves from -9.02% (in September) to -2.38% in October and +5.83% in November.
 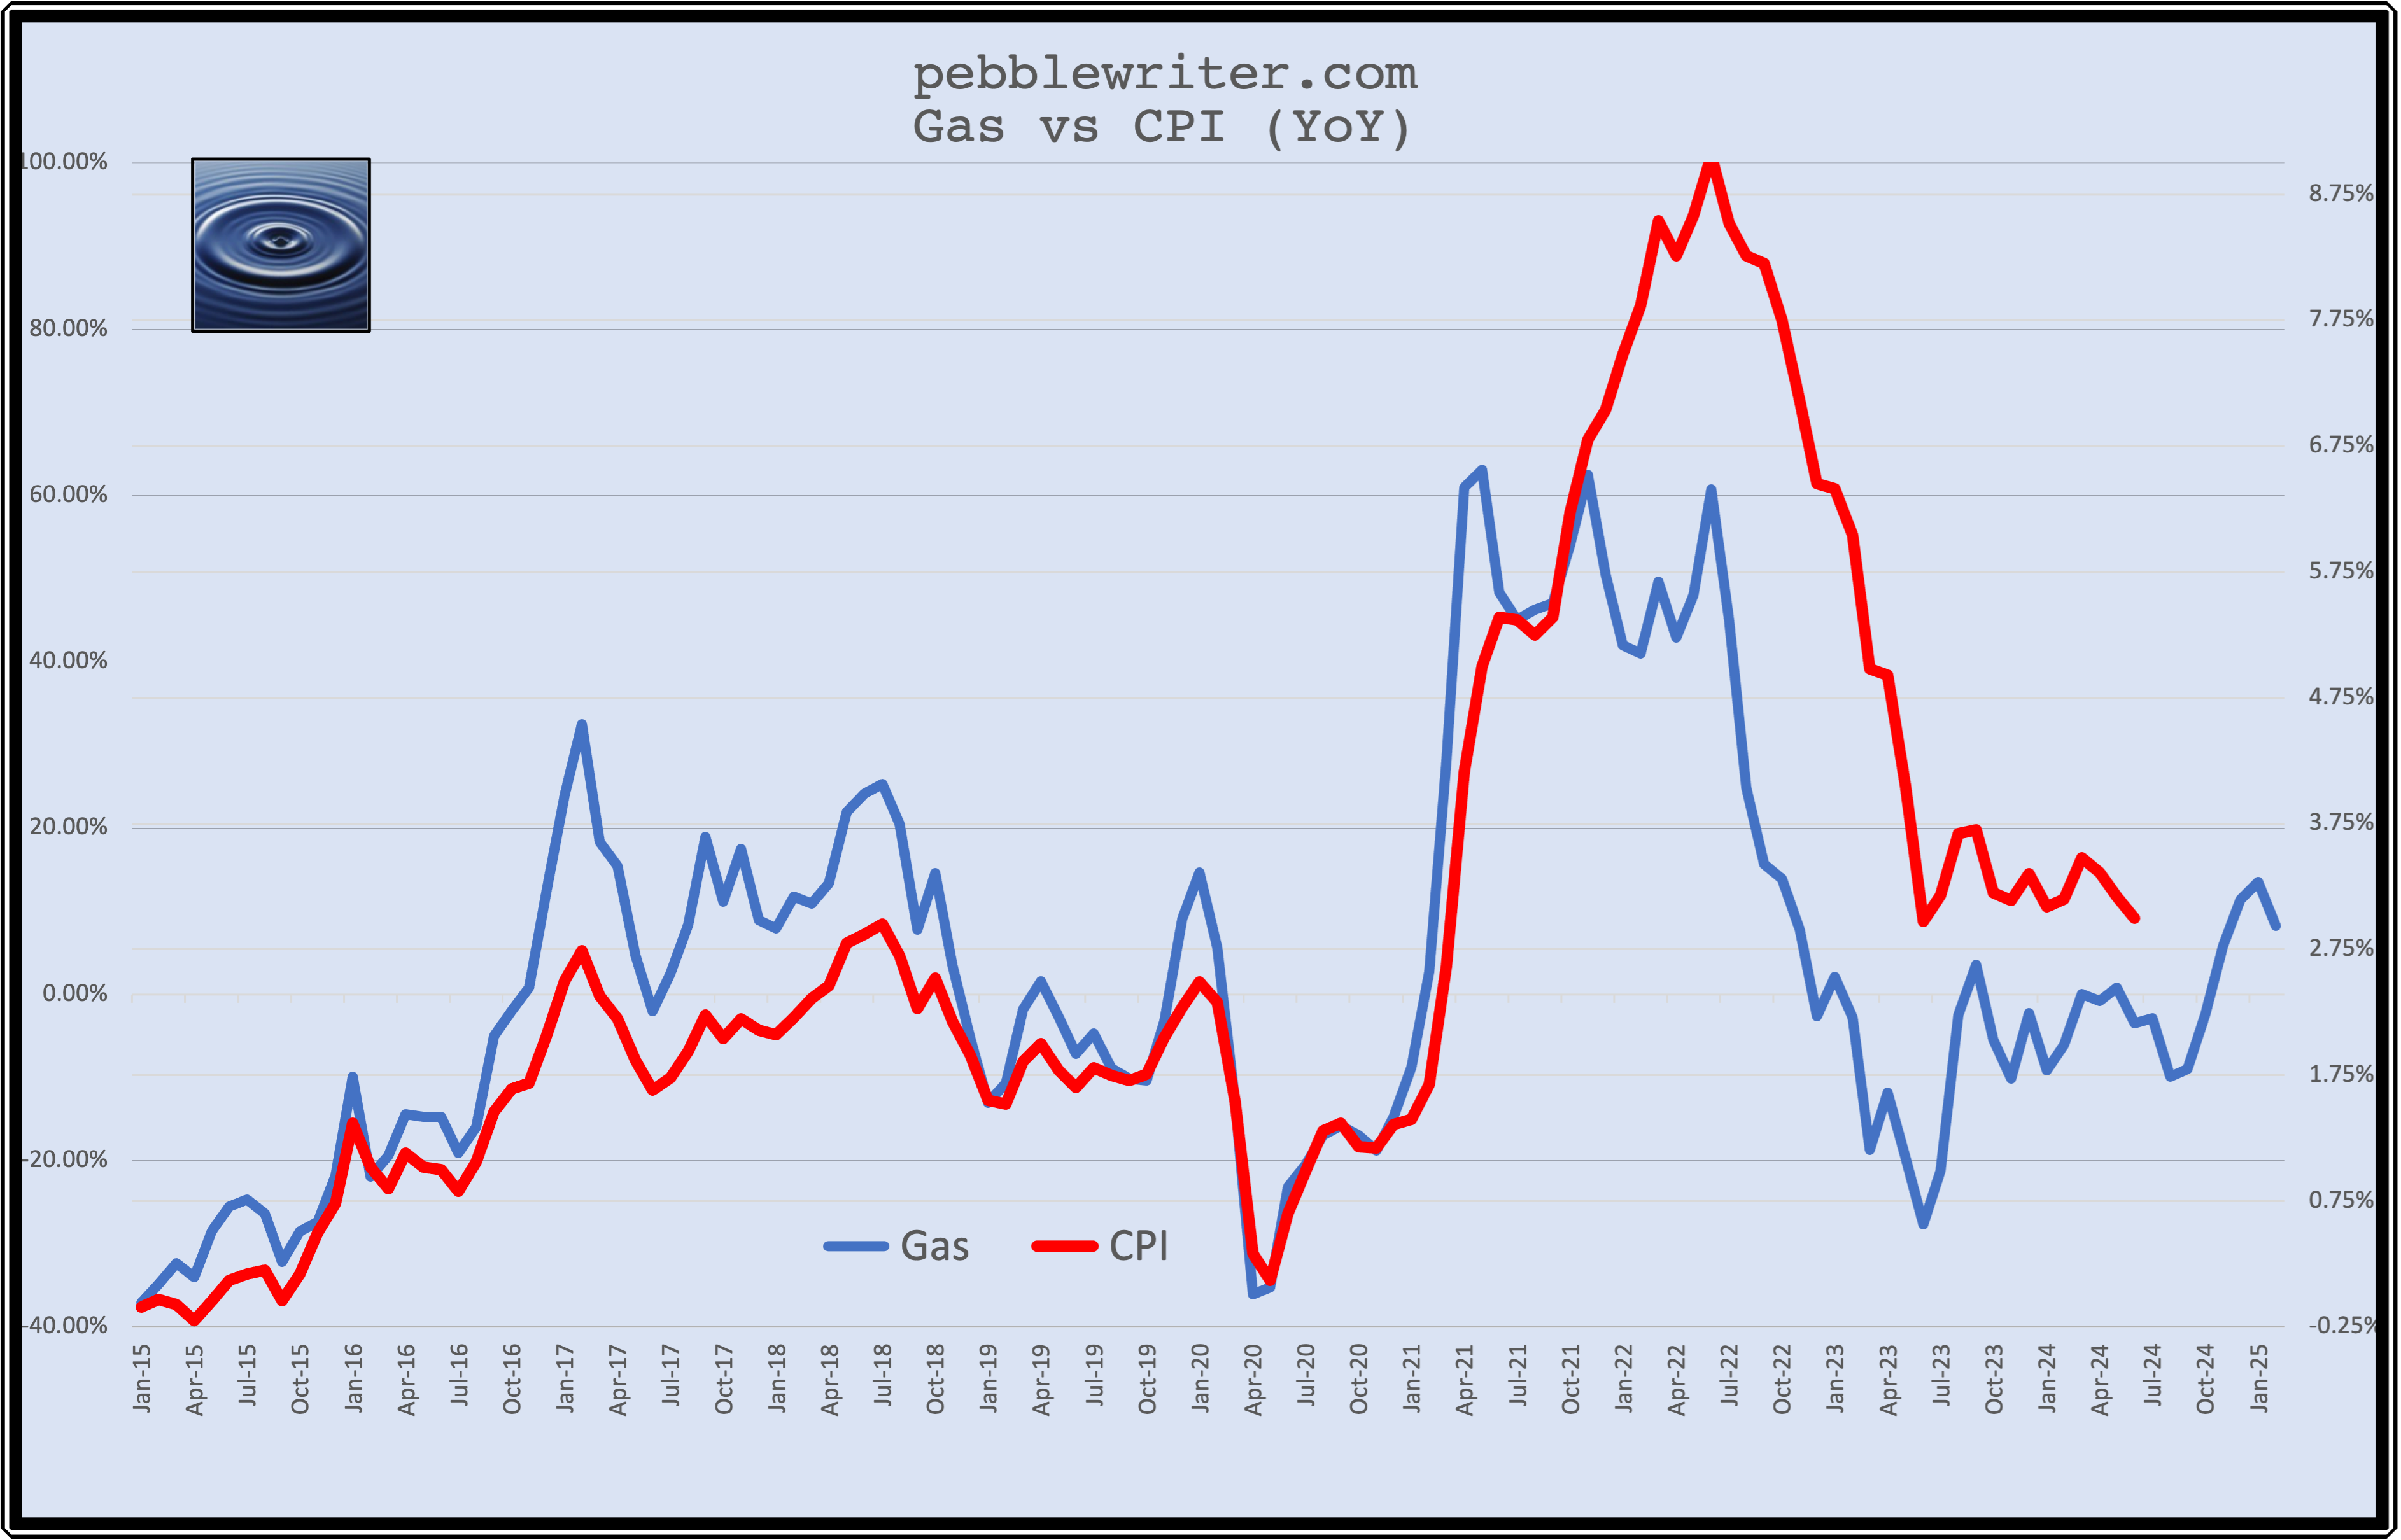 The August print of -9.93 will be the worst since Nov 2023’s -10.14%. This is the information that will inform the FOMC when it considers a rate cut at its Sep 17-18 meeting. The next one won’t be until Nov 6-7, right after the US election.
Bottom line, unless oil/gas prices rise substantially over the next few months, the FOMC will have all the information they need to justify rate cuts through at least the election and November FOMC meeting.
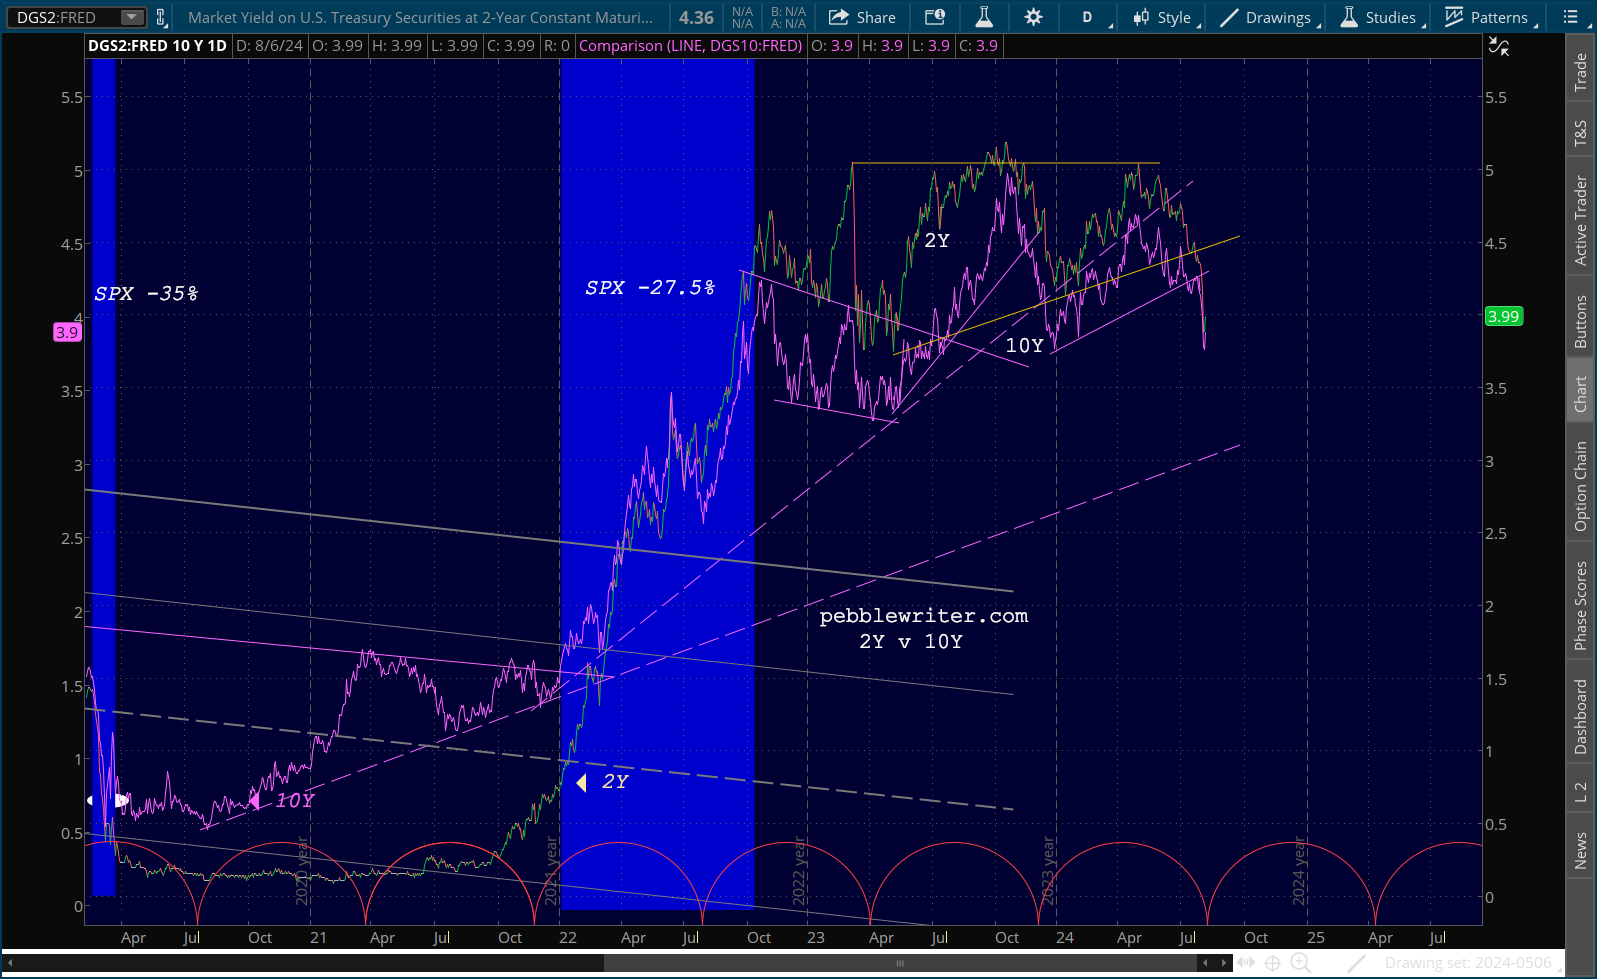
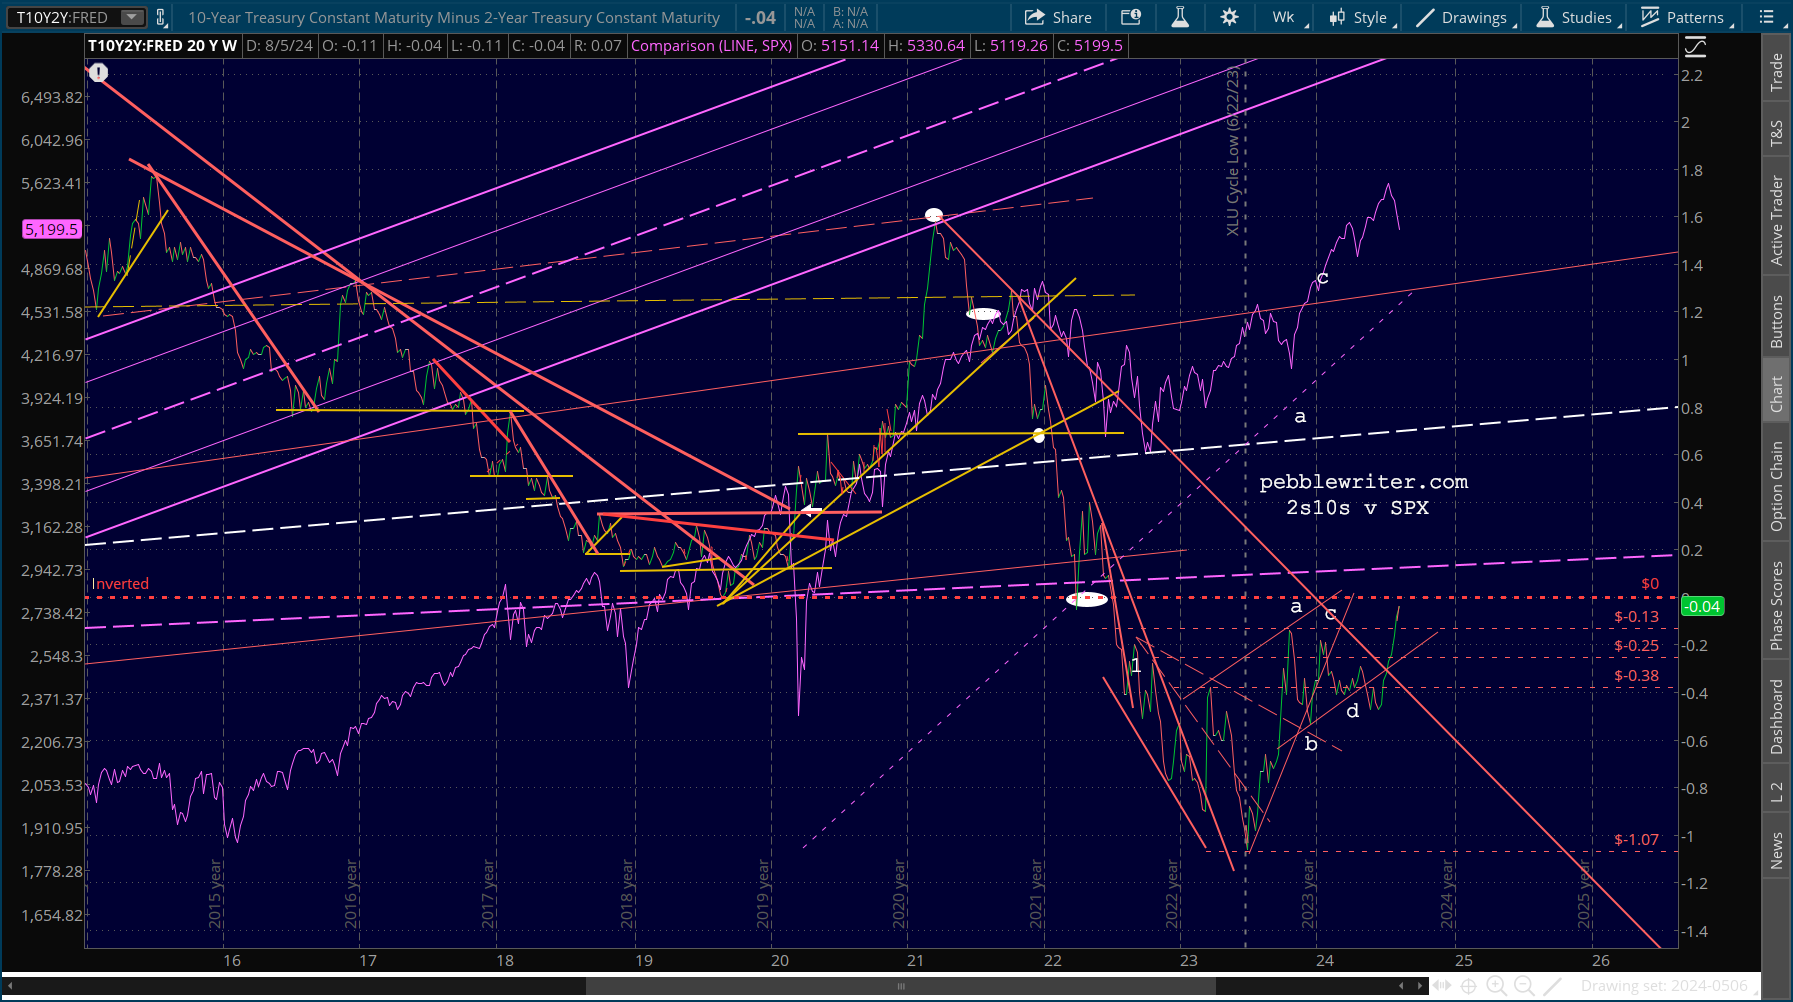
This should pressure interest rates lower or at least leave them relatively stable at the new normal. If the Fed can prevent the yield curve from de-inverting during that time, we might just see another leg up in equities. 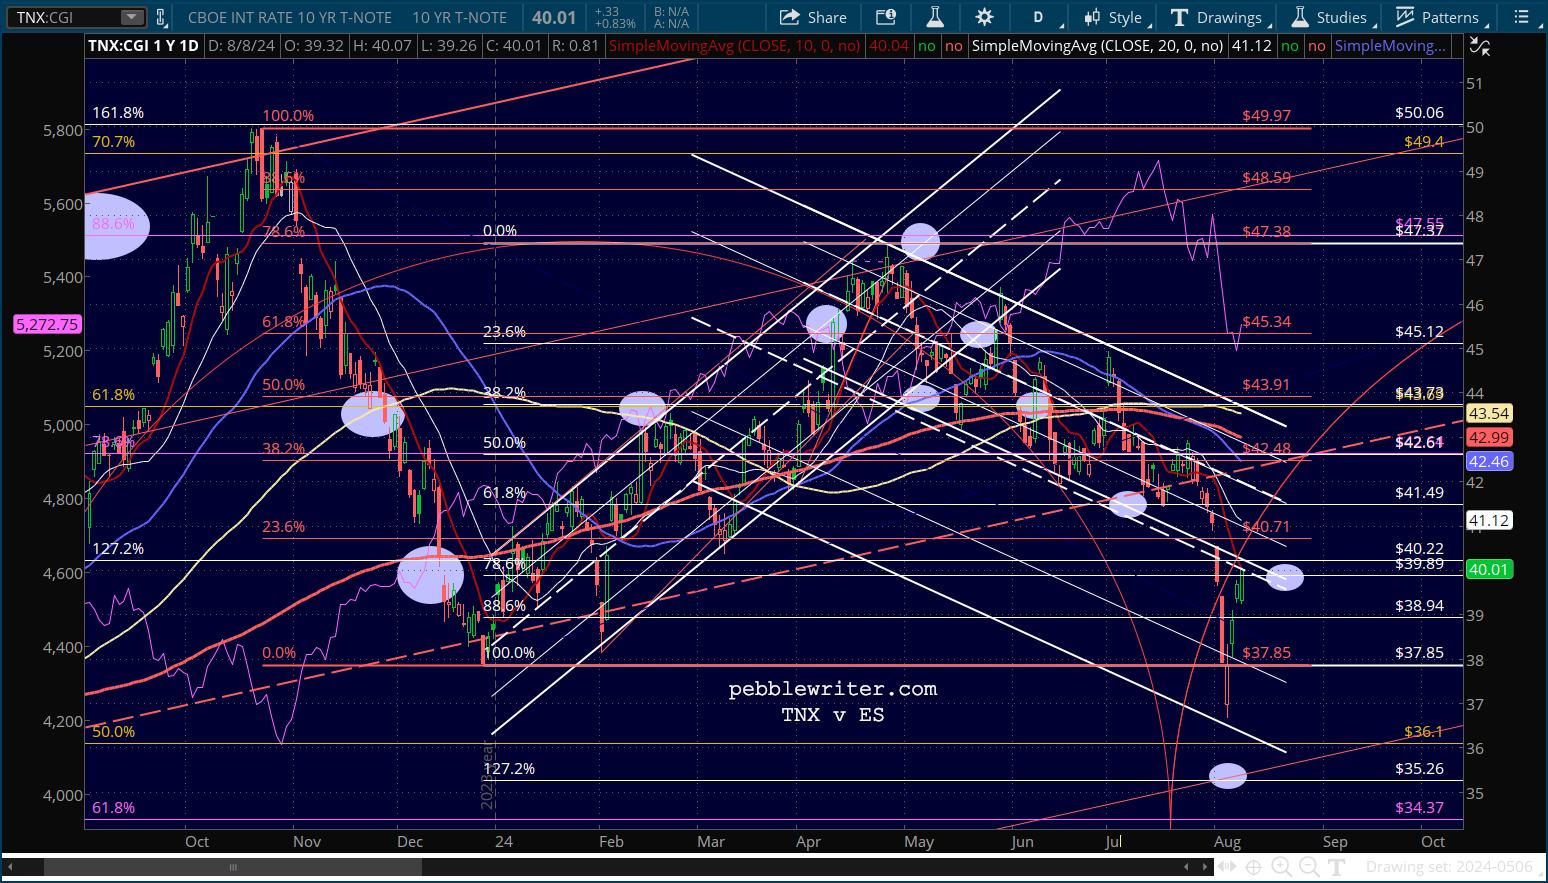
 GLTA
GLTA