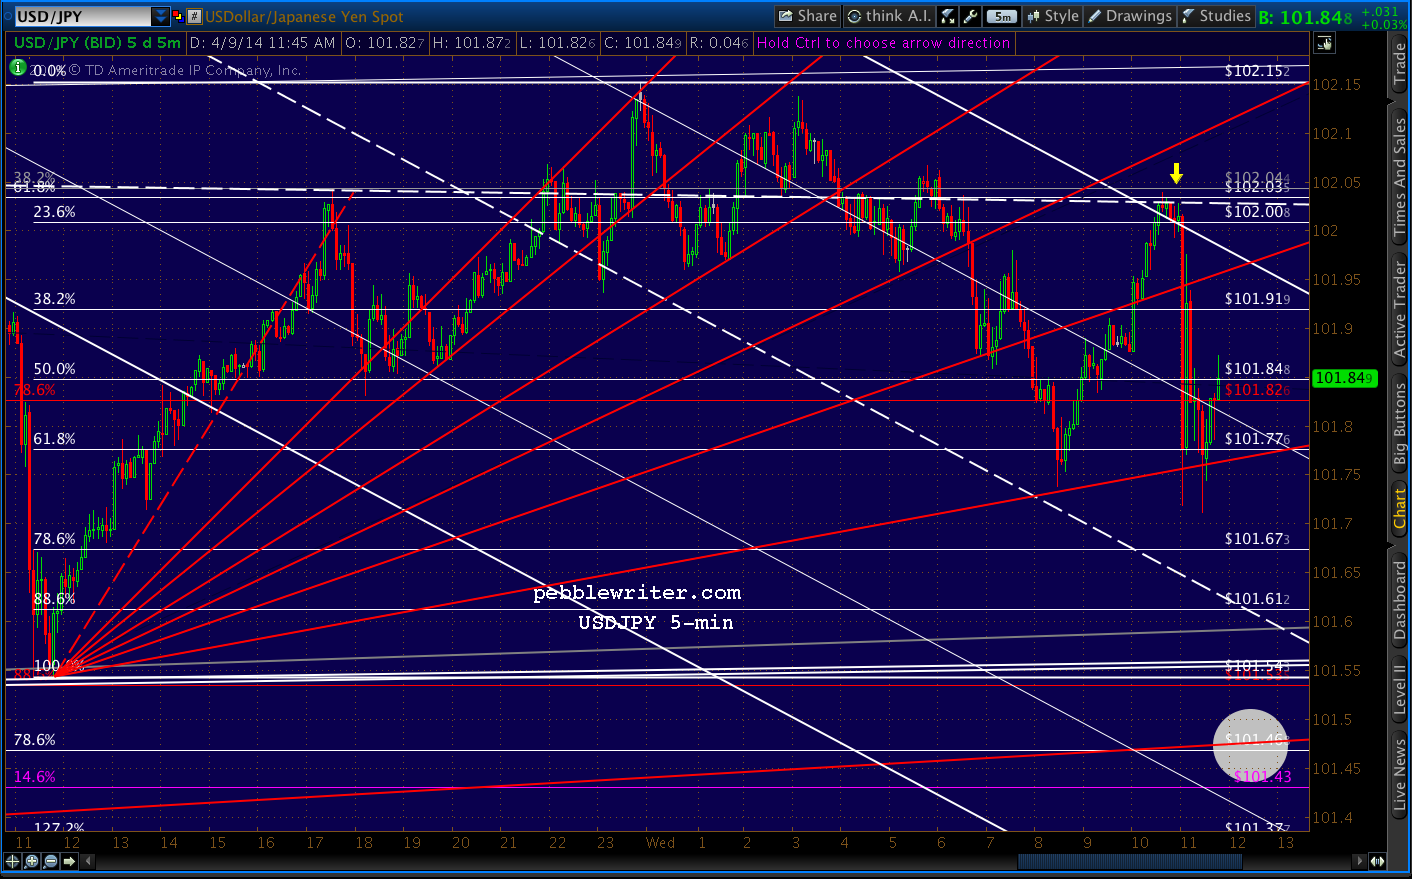
USDJPY plunged to 101.54 yesterday — very close to our 101.50 target. It bounced at the red .886 retracement, a legitimate spot. So, we could be in for a bounce, or we could see another small wave down first.
 Such a drop to the white target would, IMO, better flesh out the rising red channel — but, it’s already close enough that investors might consider the move done. Interestingly, though, the bounce we’ve seen so far is having trouble rising back above the white channel midline.
So, we’re left with a fight between rising channel bottoms (red, gray and white) and the falling white channel midline.
 I’m keeping an eye on the Nikkei, as it’s back below channel support and appears likely to continue dropping to at least the H&S neckline.
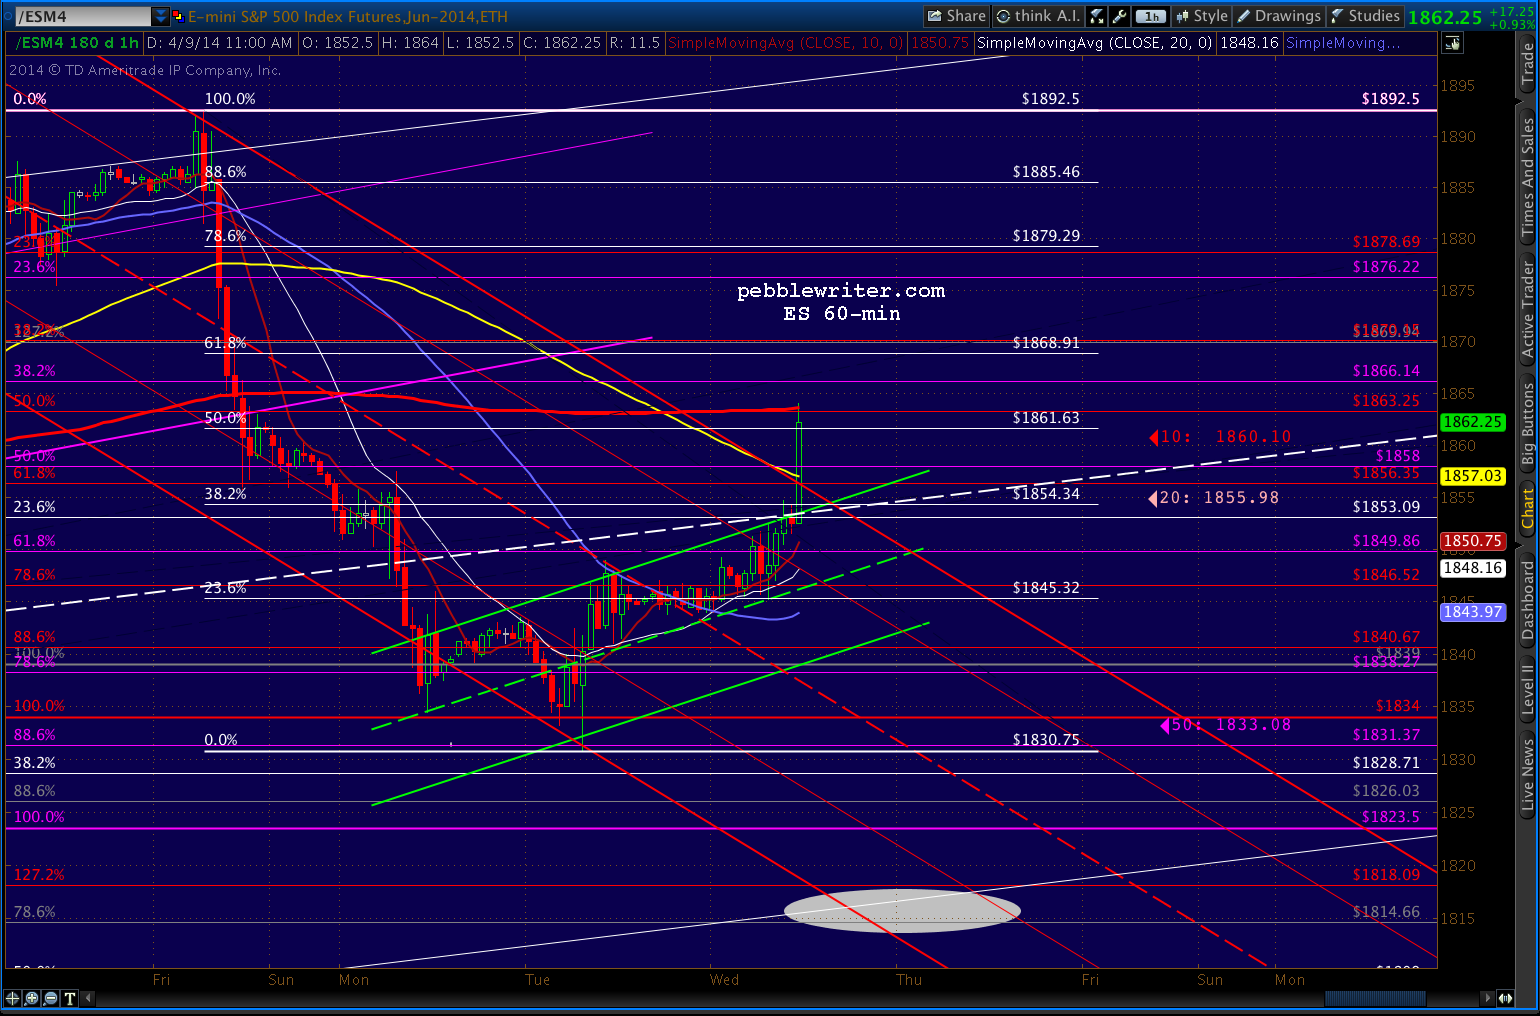
 ES is up 5 pts after bouncing, as expected, at the SMA50. Ordinarily, I’d say the bounce should reach at least the broken white channel midline. But, the USDJPY might keep a lid on things. We’ll find out shortly.
 UPDATE: 9:50 AM
The white midline held so far. So, we’ll set our sights on a deeper retrace or a last wave lower for a more meaningful bounce.
One caveat: as we’ve discussed for months, the yen carry trade is huge. If enough players rush the exits all at once, forget about all those channels holding. It’s a long way down — for USDJPY and for equities.
This is our medium-term thesis, and I suspect it to play out sooner rather than later. In other words, a bounce is by no means assured. It all boils down to how well TPTB can keep things under control.
 ES is building a nice little flag pattern — and sputtering near the backtest of the rising white midline.
 UPDATE: 12:40 PM
USDJPY just backtested the latest fib fan line at the .382.
 The Fed minutes aren’t due out until 2pm EDT, so the pair has some time to kill. ES is stuck right at the midline — about .382 of the drop from 1892.5 to 1830.75.
My best guess is the market will react negatively — based on the fact that the initial reaction to the Fed statement [READ IT] back on Mar 19 was a 25-pt drop. But, that drop was erased by a massive Plunge Protection Team effort, and a ramp job that carried into the following morning when the press trumpeted a bevy of mixed (at best) economic news.
Here’s an updated forecast. (continued for members)
I look for the current rally to be turned back here at the white midline, followed by a drop to the SMA100 at ES 1817.53 — also the .236 line of the rising white channel. We should get a bounce there, and potentially a drop to the white channel bottom at the white .618 at 1789 (also the SMA150, shown in green.)
 This all presumes the decline is orderly. If not, an intra-day push to the white .786 or .886 is a good possibility. The SMA200 (red) is currently at 1741 and rising about 1-2 points/day.
UPDATE: 2:40 PM
The PPT is alive and well. Either than or at one nano-second past their release, investors read the 8,200 words in the minutes and judged them to be bullish for the stock market — ramping ES up 20 points or so to the SMA10 (the 60-min SMA100.)
 The USDJPY, on the other hand, thought the minutes bearish. The immediate reaction was a .74 cent drop within one minute, followed by BOJ dollar buying that produced a .786 bounce.
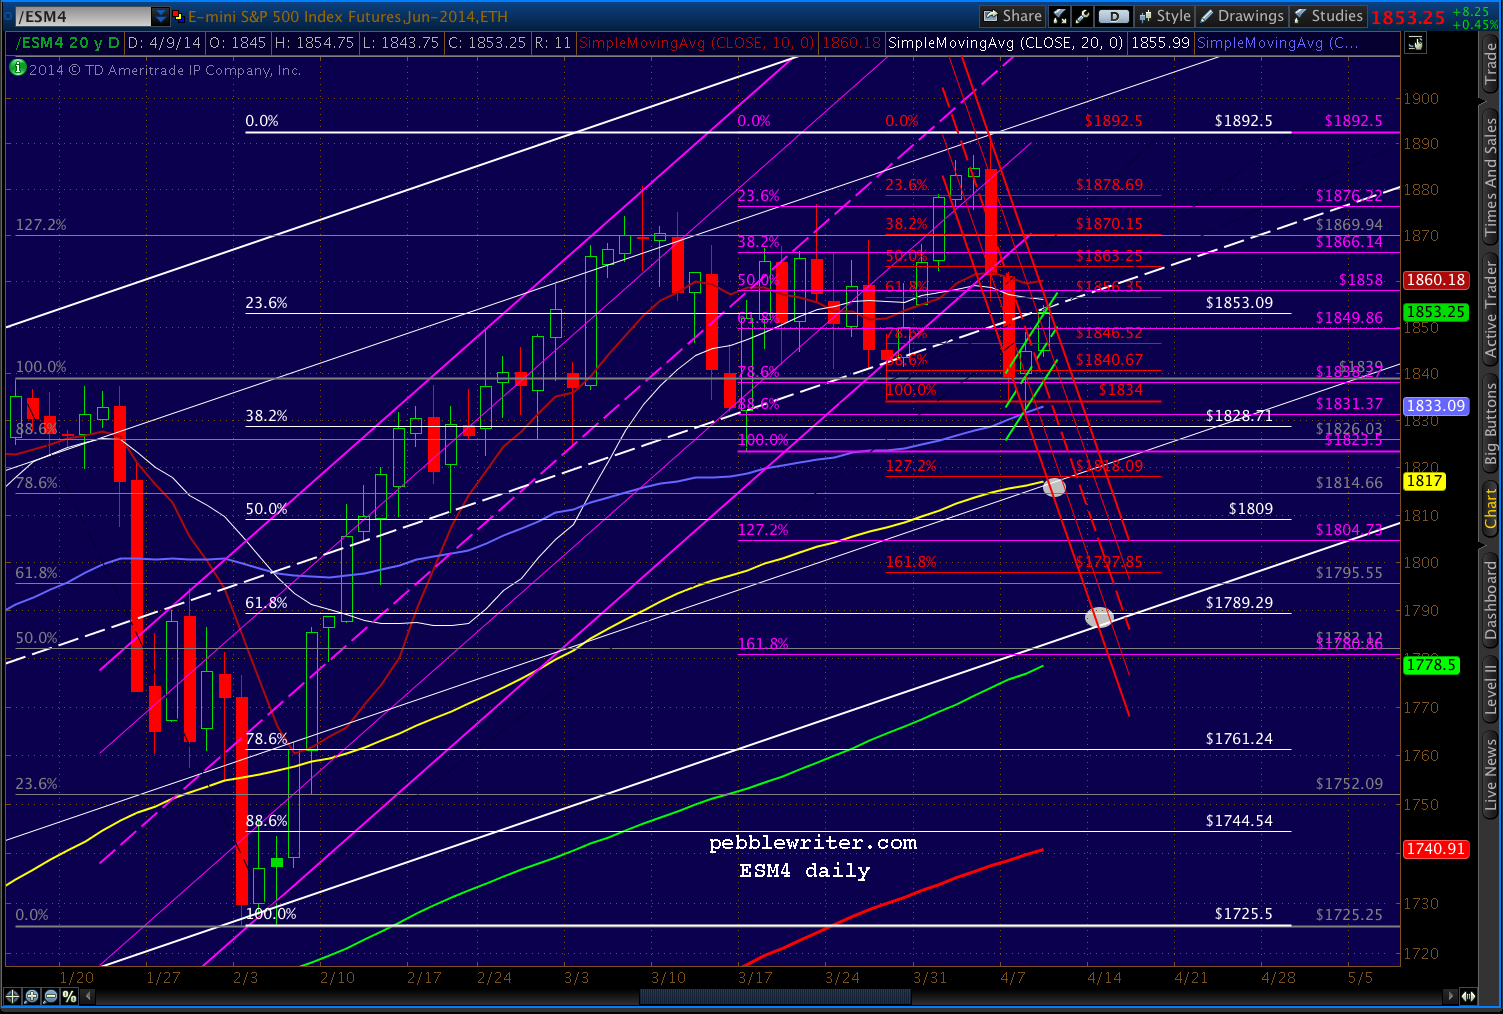
 Here’s the daily version — a decidedly more bearish picture IMO.
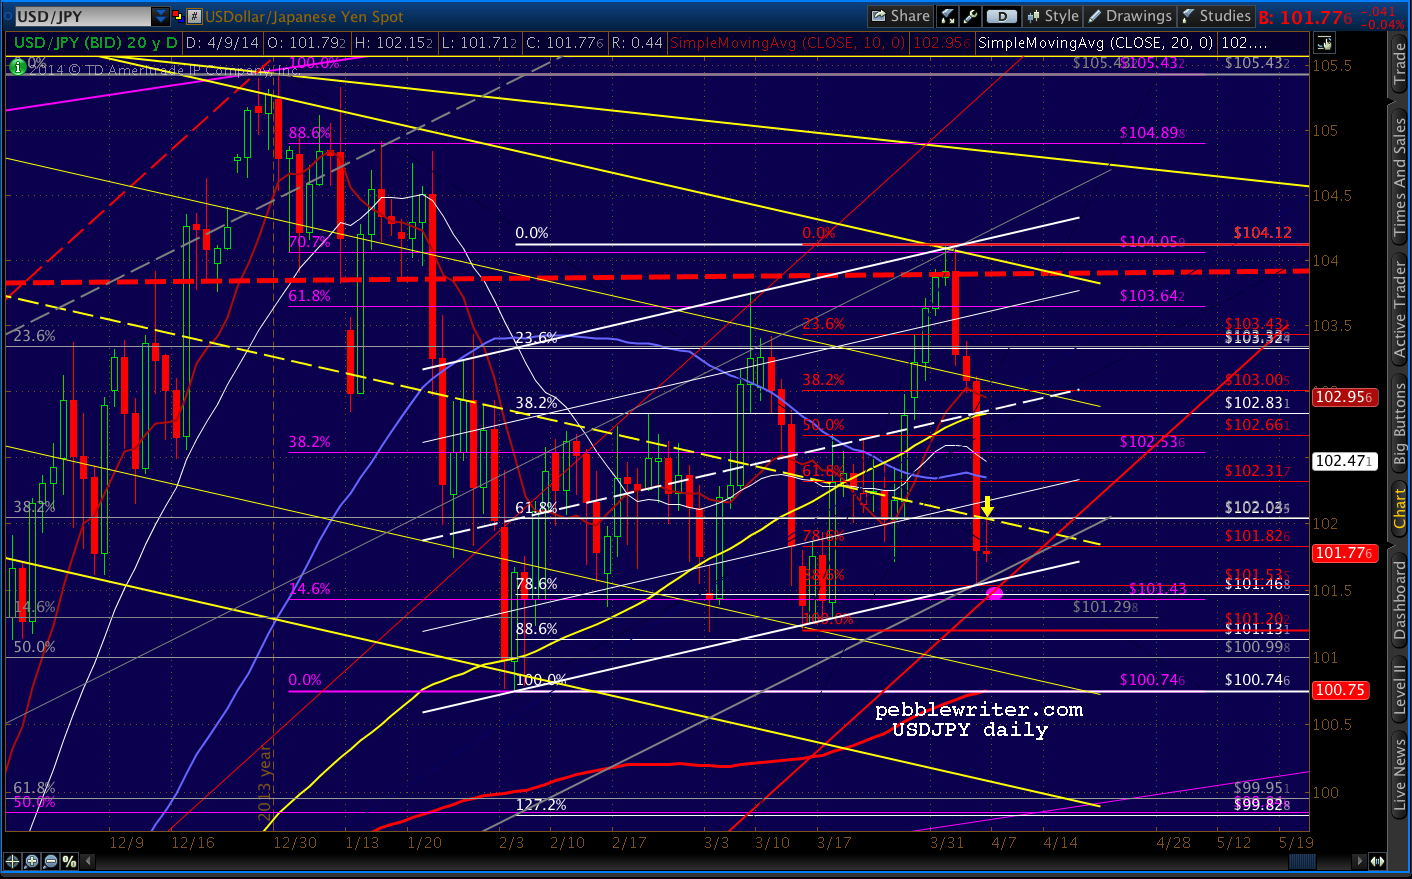 Note that I’ve switched the color of the falling channel to yellow in order to avoid confusion between it and the rising channel — which looks more and more like a flag pattern.
The yellow one does, too, of course — especially in light of the huge rally leading to the 105.43 high on Jan 2. The true test will occur at the purple dot, where USDJPY will have to decide between the white, red and grey channel bottoms or seeking out the SMA200 (thick red) and retesting the Feb lows.
The other SMA’s are rolling over again. The 20 (white) and 50 (purple) have crossed below the 100, and the 10 (red) should join them tomorrow (along with the 20/50 cross.)
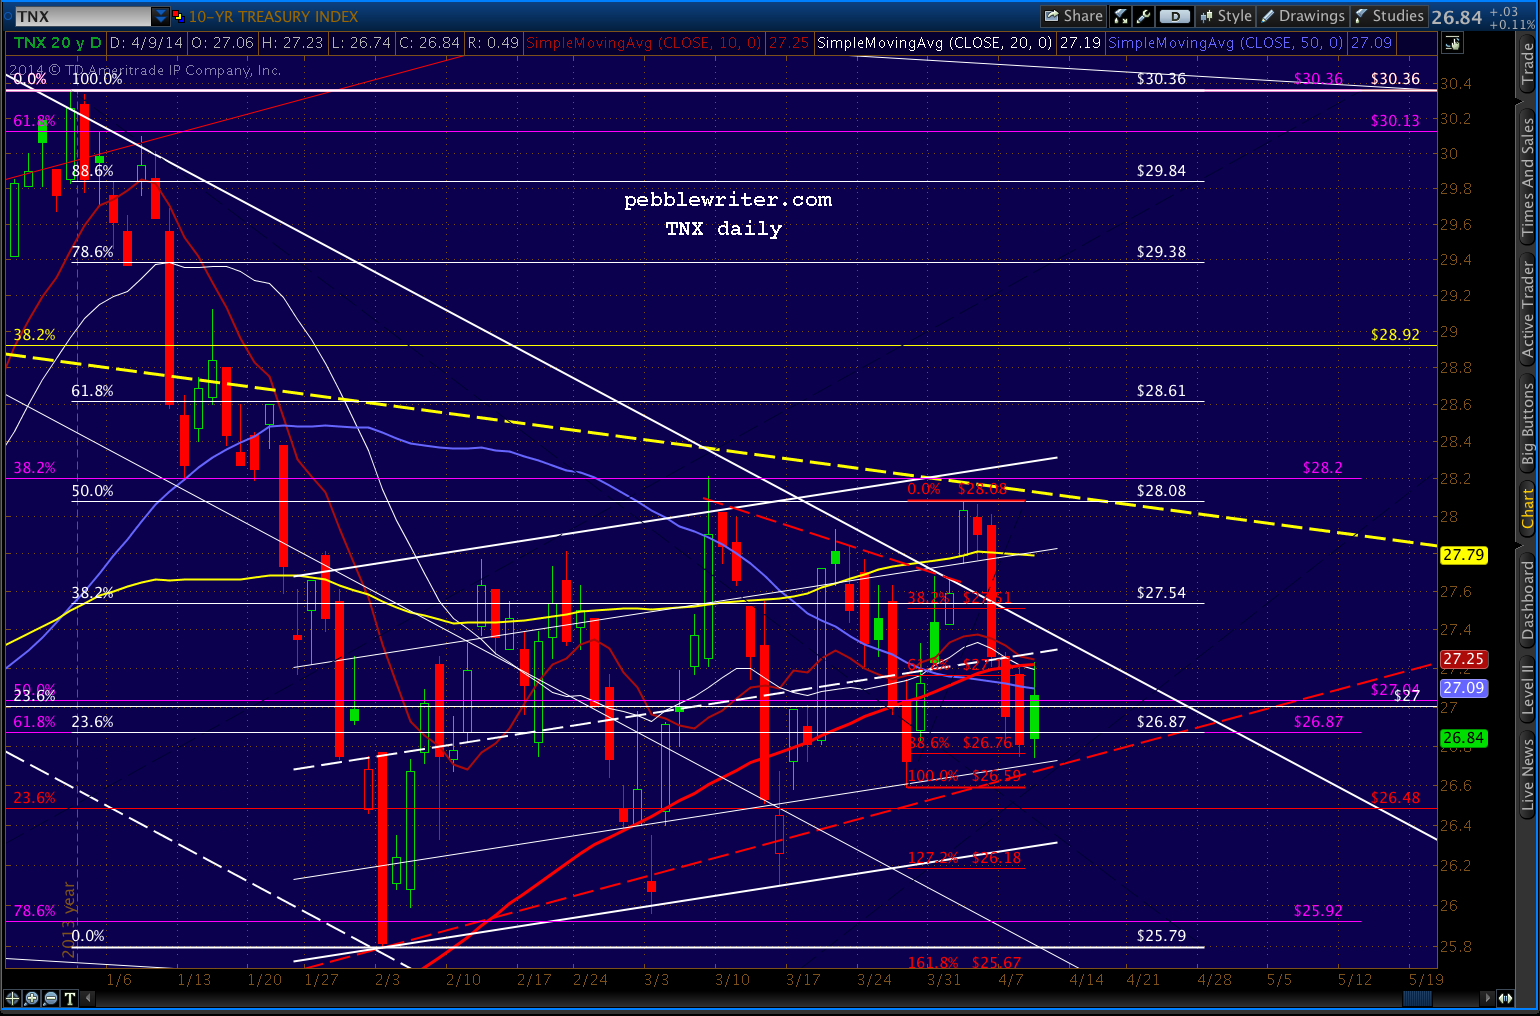
The 10-yr yield, which should be soaring as the Fed tapers, has been dropping ever since Dec 31. We could argue whether or not the Fed will stay the course, but there’s no denying that the scenario we laid out in December continues to play out.
Today, TNX rallied to the SMA200 and fell back sharply. Oh, and notes recently experienced a death cross (50/200 cross), which underscores the signal being given by foreign bonds (Spain and Greece < 6%.)
 Remember, a dramatic drop in rates is definitely not a good thing for stocks. From last month’s Eye Candy for Bears:
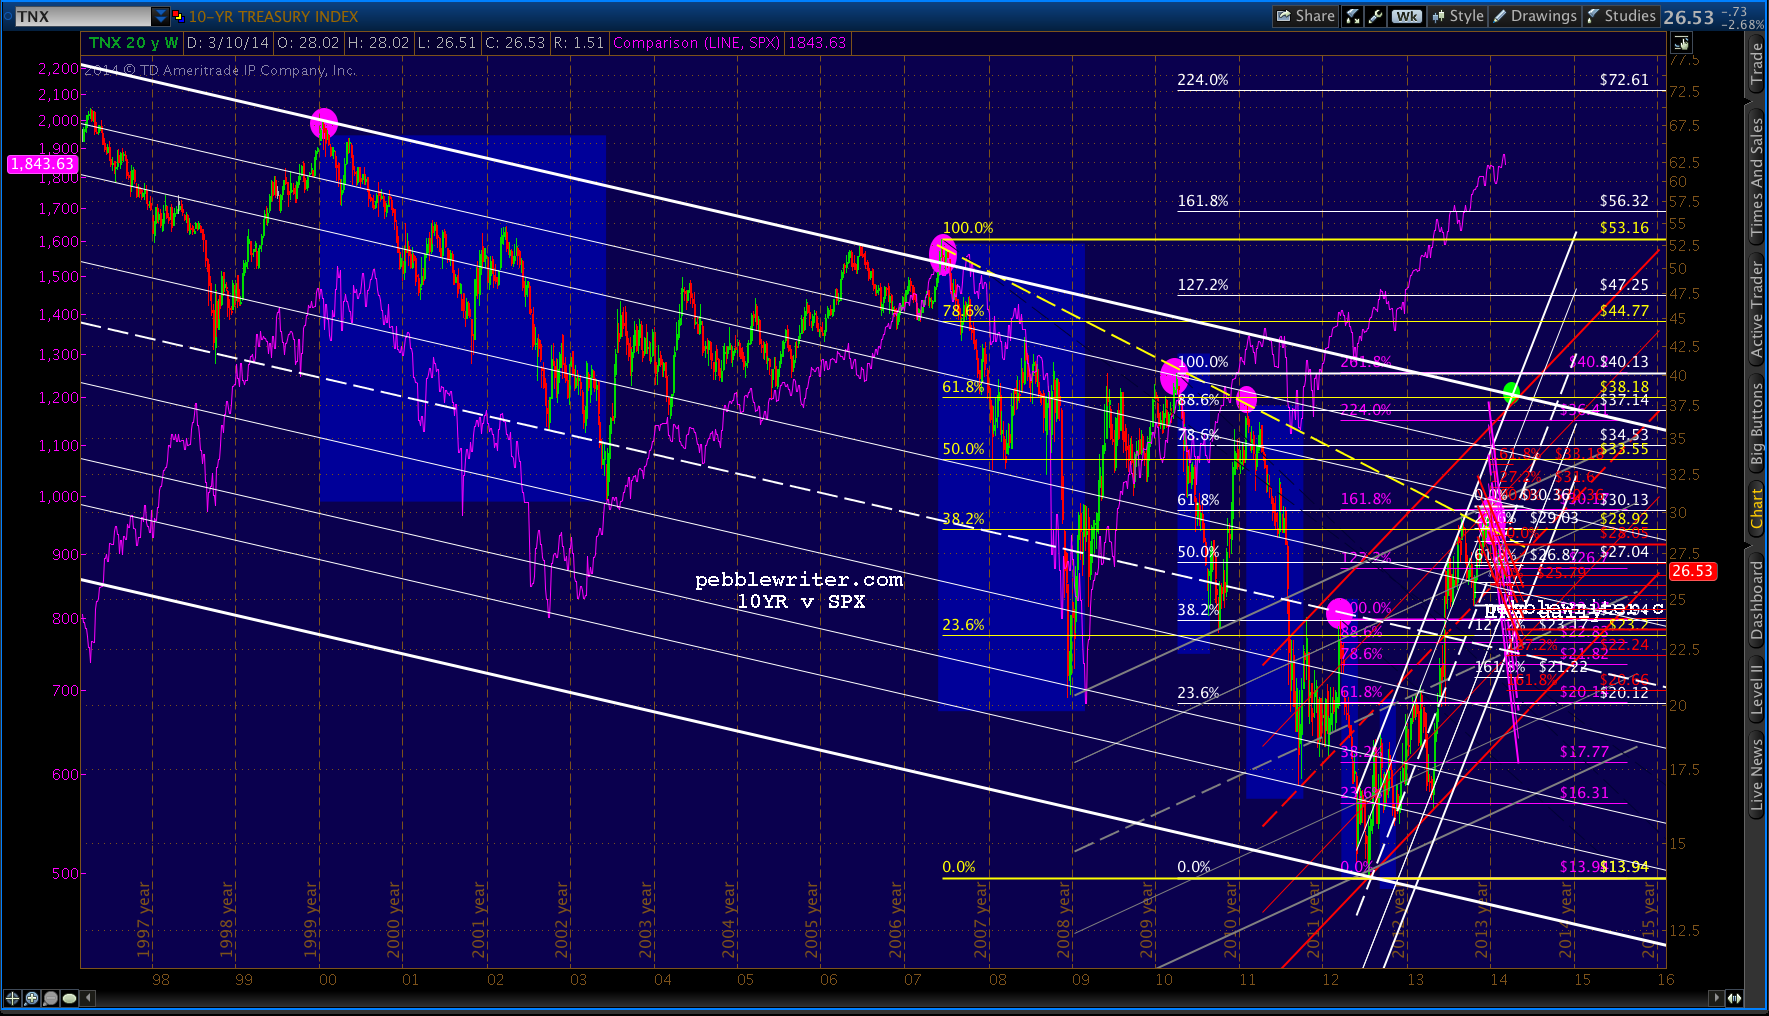 They can ramp stocks all they want, but currencies and bonds are telling a very different story.
UPDATE: 4:00 PM
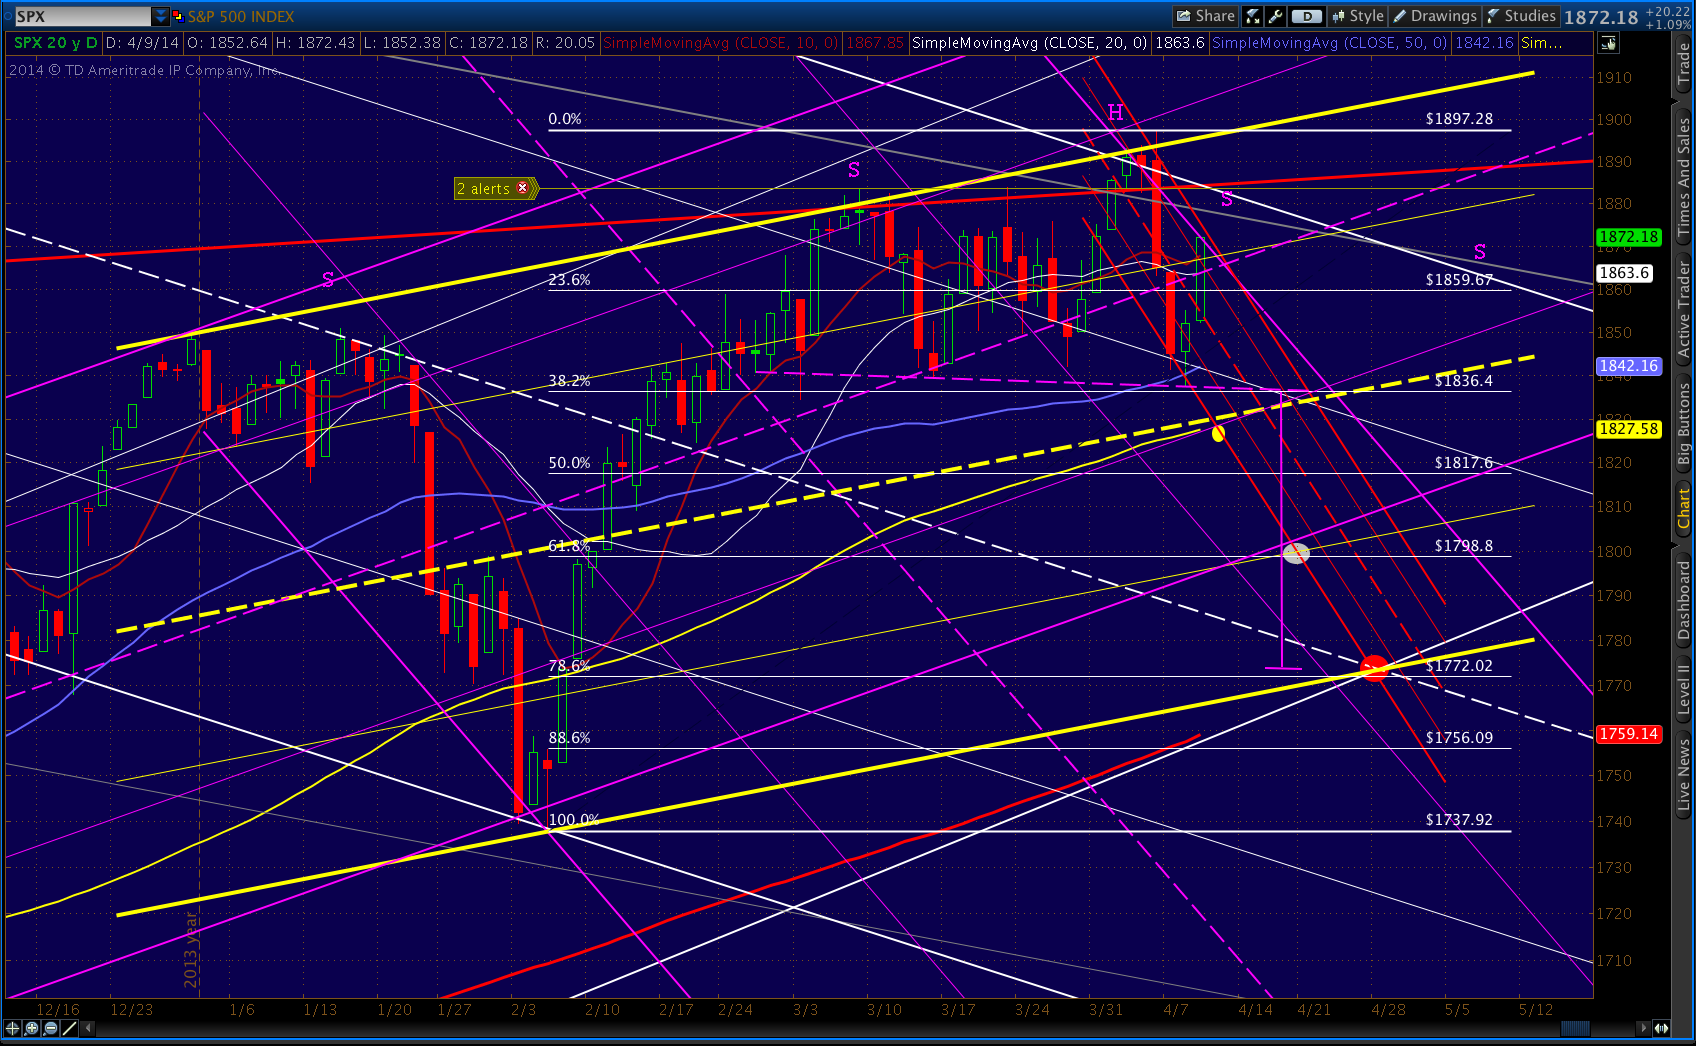
For the sake of argument, here’s the SPX daily chart. Note the purple channel (since May 2013) within the bottom 1/4 of the longer-term (since 2009) white channel.
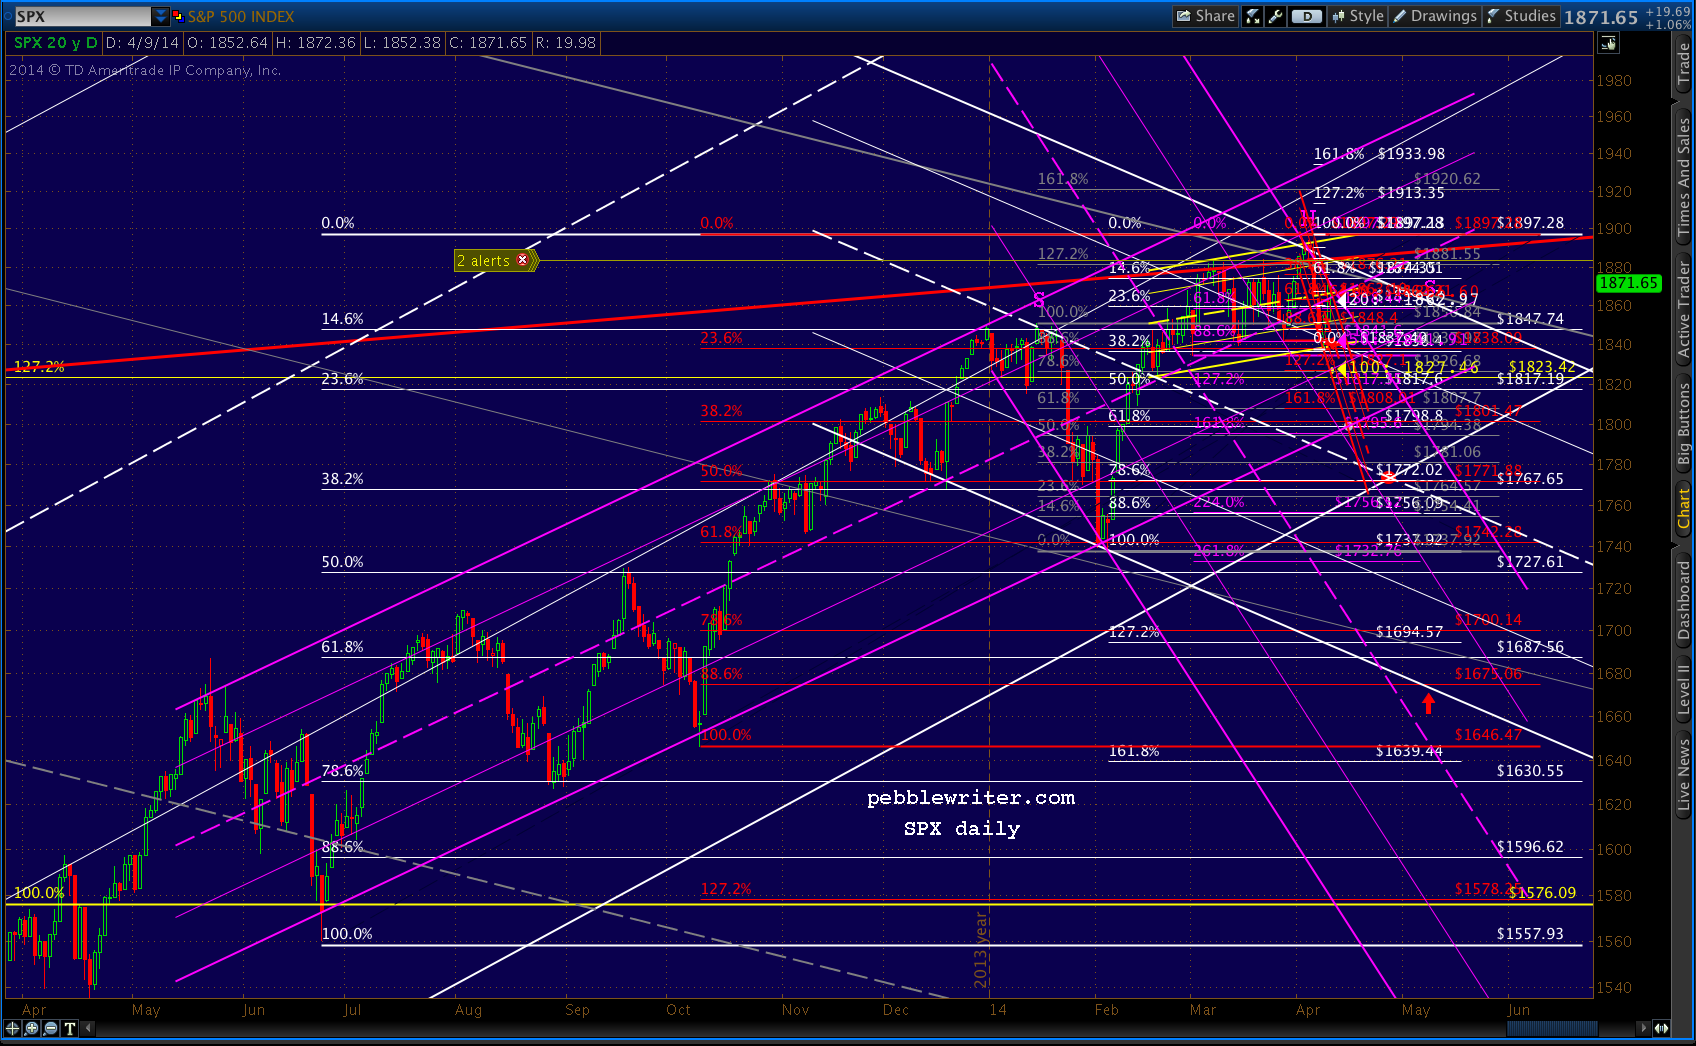 With today’s rally, SPX closed above the mid-line of that channel. But, it didn’t clear what might be a falling channel — shown in purple. It’s important to note that these sorts of channels are quite speculative, and are busted as often as they play out.
This one is based on the slope of the declines that occured over the past year. Each followed the same path, only to end up at the bottom of the purple channel. If the current decline were to follow the falling purple channel to the bottom of the rising purple channel, it would end up at the white .618 around 1798 in late April (the white dot.) If it fell a little further — to the white .786 — it could tag the rising white channel bottom (and SMA200) at 1772.
In other words, either a .618 or .786 retracement of the rise from Feb 5 (a 5.2% or 6.6% decline from the 1897 top.) Not exactly a dramatic sell-off.
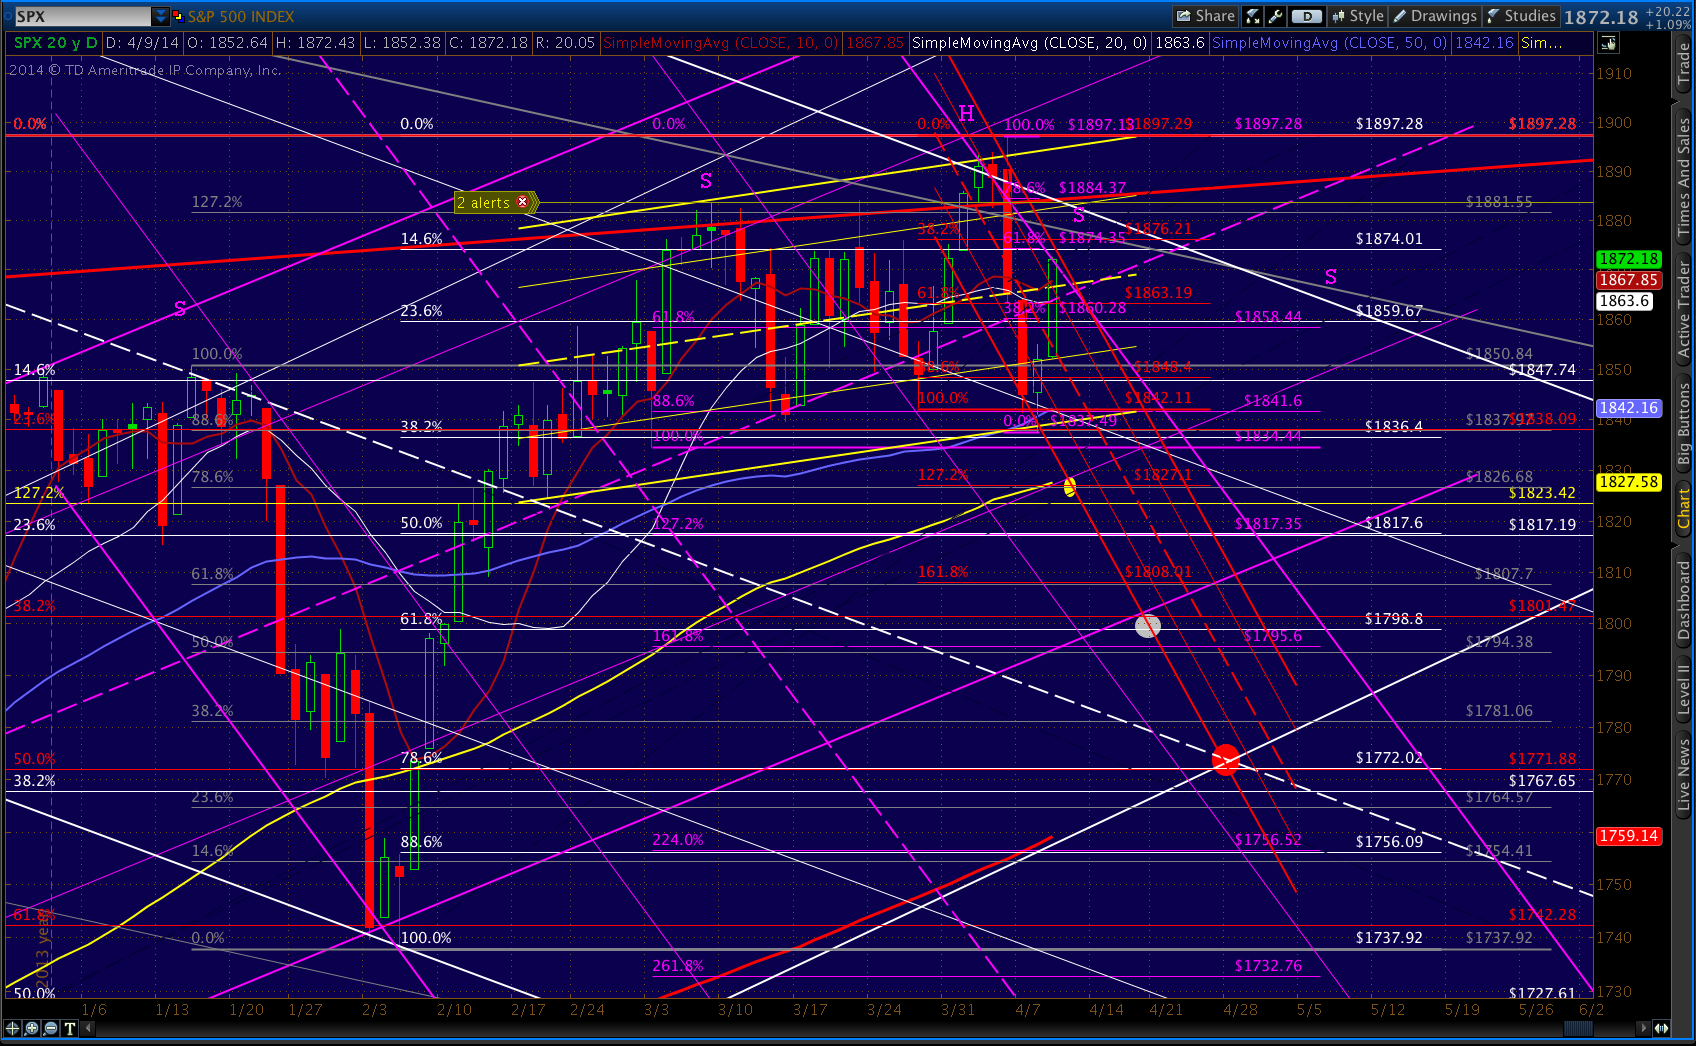 I personally like the white .786 best, as a trend line between it and the Feb 5 bottom would perfectly parallel the Jan 31 and Apr 4 tops — highlighted below in yellow.