

 Seemingly everyone has assumed that the BOJ would step back in and ramp up their QQE and asset purchases. The consensus was for a doubling of ETF purchases. Yet, as we’ve discussed many times [see: Sayonara Abenomics], the BOJ is between an inflationary rock and and debt hard place. Last night’s decision to hold the course — music to bears’ ears — has disappointed a great many investors who were counting on the music never stopping.
Our major thesis since late December [see: Update on NKD & JPY] has been that a stronger yen would do some real damage to equities. Now that it’s happening, the question becomes “how far?”
 I have been unable to quantify the size of the yen carry trade, but my sense is it’s much greater in size than existed in the previous unwindings of 1998, 2002 and 2007. Margin debt is as great as it’s ever been; and, stocks are priced at the same high multiples.

One thing for sure: the bulls won’t just roll over. If this sell-off gets serious enough, we can expect a lot of jaw-boning from the usual suspects. And, if that doesn’t work, the Fed can always taper the taper (to, you know, “reduce unemployment.”)
But, we’ll likely see more downside first. Keep an eye on the targets we discussed yesterday. The first — the SMA50 at SPX 1840/ES 1831 — should arrive shortly after this morning’s open. continued for members…
But, I suspect we won’t get the first serious bounce until USDJPY tags 101.40-101.50 — the purple .786/ grey .886/ red channel bottom/yellow channel bottom. It’s slightly below the red .886 at 101.98, which will probably line up with the SMA 50’s.
Longer-term, I can’t help notice that SPX’s SMA200 is currently at 1757 — slightly higher than the .886 retrace of its rise from Feb 5. Its current trajectory is right on top of the bottom of the large white channel dating back to 2009. So, I fully expect SPX has a date with it — probably at the .786 late in the month.
 Of course, this same logic led me to believe we’d see a deep retrace to the .886 at 1756 in late March — busted by a string of overnight ramp jobs. Who’s to say whether it might happen again?
First, it must contend with the SMA50, the SMA100 at 1826, the purple channel bottom (currently at 1797) and a bevy of potentially important Fib levels.
UPDATE: 11:40 AM
Got the SMA50’s tagged, but not the USDJPY .886 at 101.98. I suspect USDJPY will take one more dive to get that Fib level taken care of, which will coincide with a wave 2 retrace for ES and SPX — maybe the respective .786/.886’s or a backtest of the SMA50’s? I wouldn’t get excited about a bounce in stocks until USDJPY reverses off 101.98.
And, I wouldn’t assume it will bounce there. The 101.40-50 area is much stronger support.
SPX/ES has been only too happy to rally to new highs even as USDJPY merely retraces part of a leg lower. This “enthusiasm mismatch” has to reverse before we can count on any major moves to the downside.
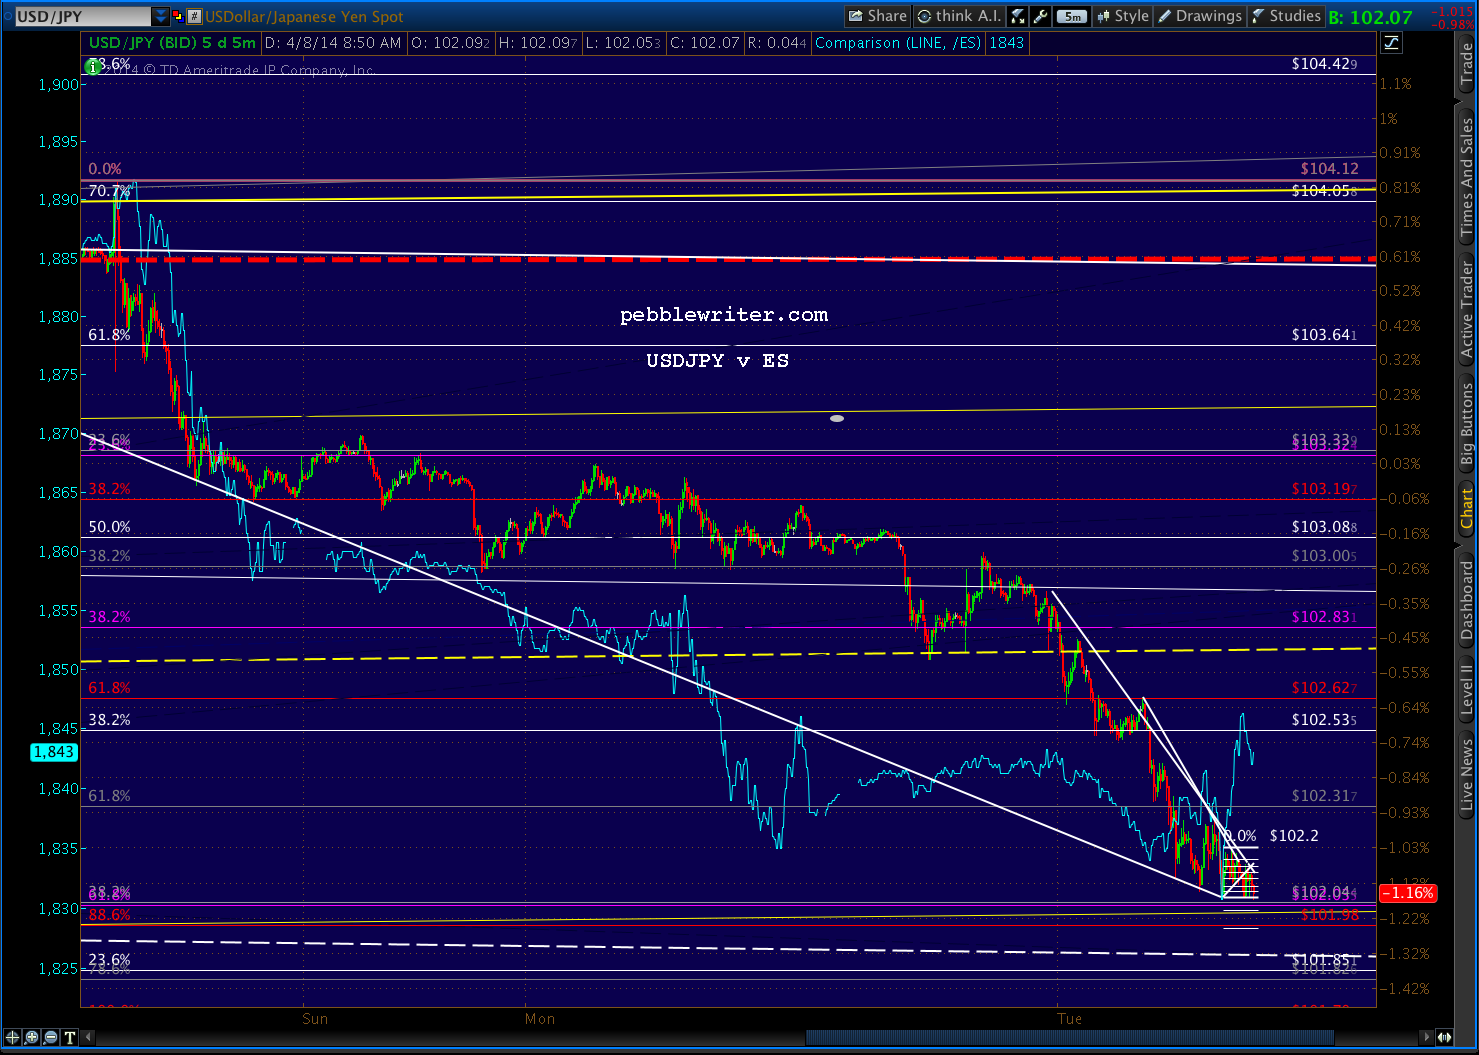 A close-up shows ES making new highs with just a bump in USDJPY, but barely budging when USDJPY makes a new low.
 UPDATE: 1:10 PM
USDJPY barely paused at 101.98, have paused at the white channel midline. A tag on the bottom of the yellow would be better support for the bulls’ next leg up. ES and SPX have barely budged, leading me to believe that 101.40-50 is coming up.
Why? The bulls will be able to say the bottom of the channel has been tested and held without doing much damage to equities’ momentum. They have nothing to lose and everything to gain — assuming USDJPY reverses as it should and ES/SPX only drops to the .618 — .786.
