

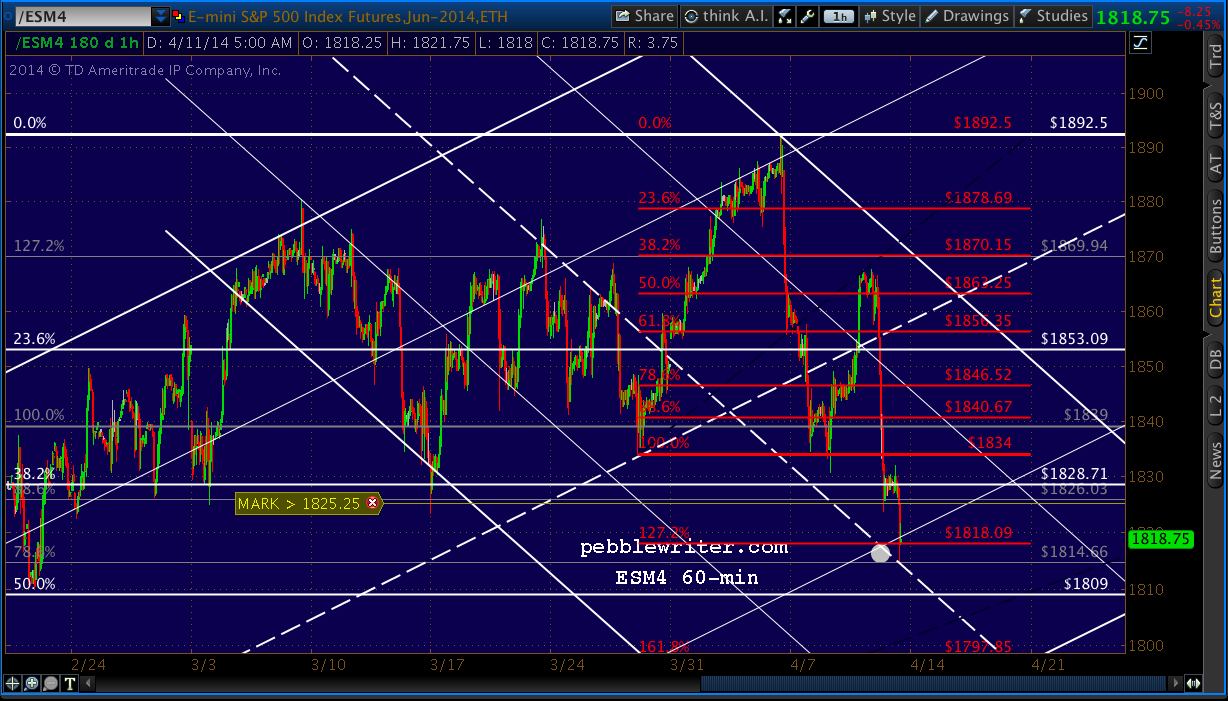
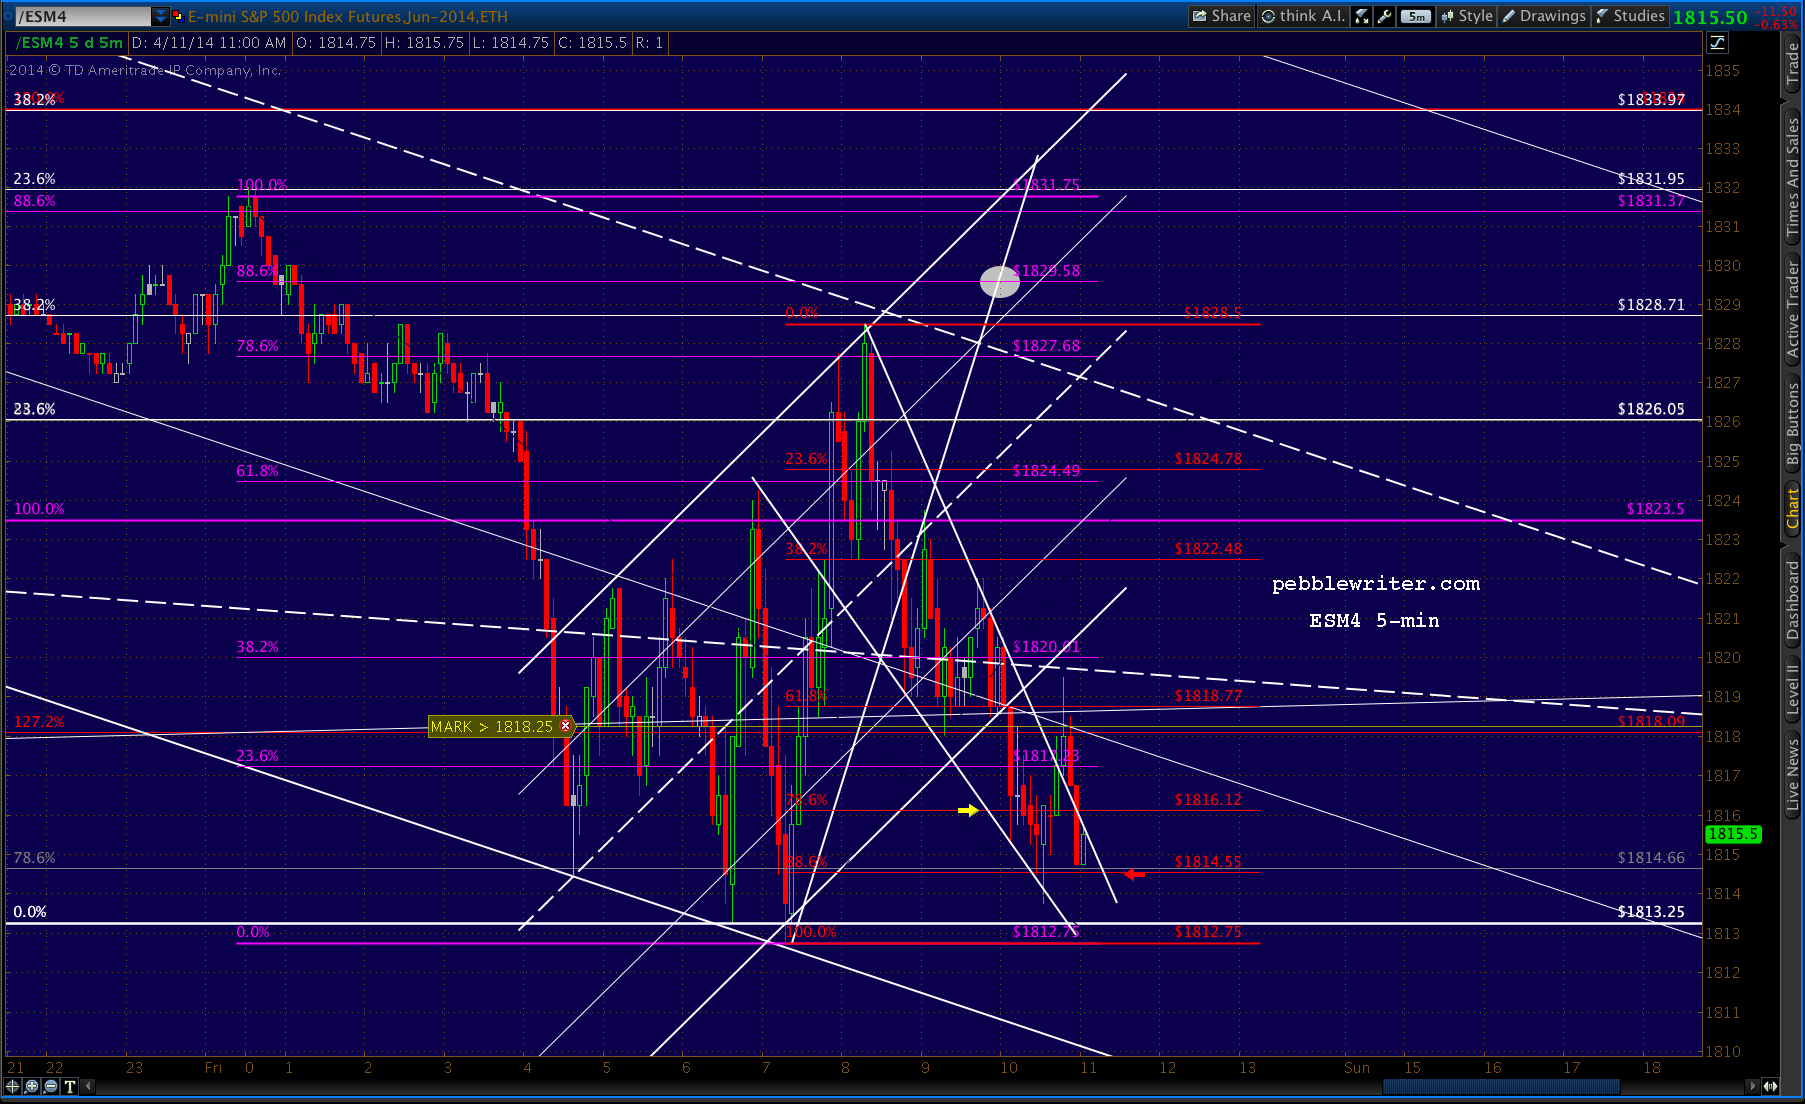
ES just reached our 100SMA target — also a falling white channel midline and rising white channel .236 line.
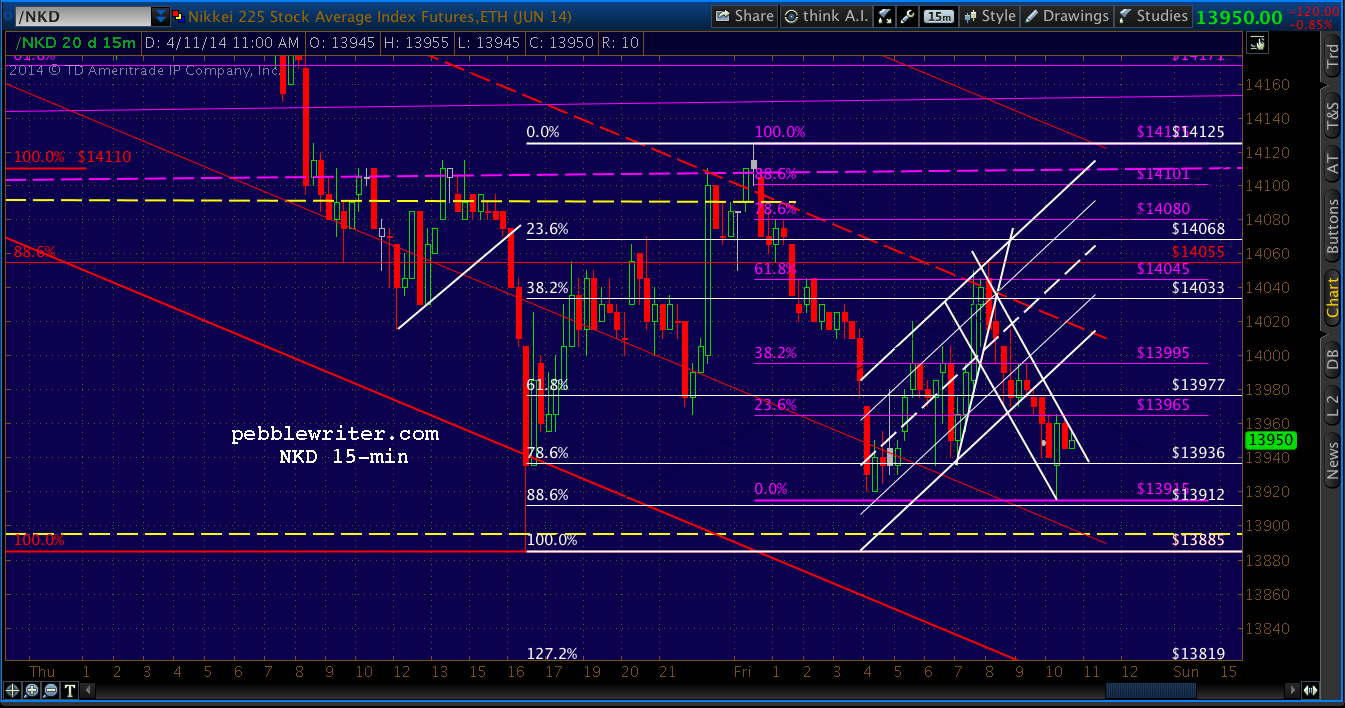
 As expected, this aligned with the Nikkei reaching its lower neckline.
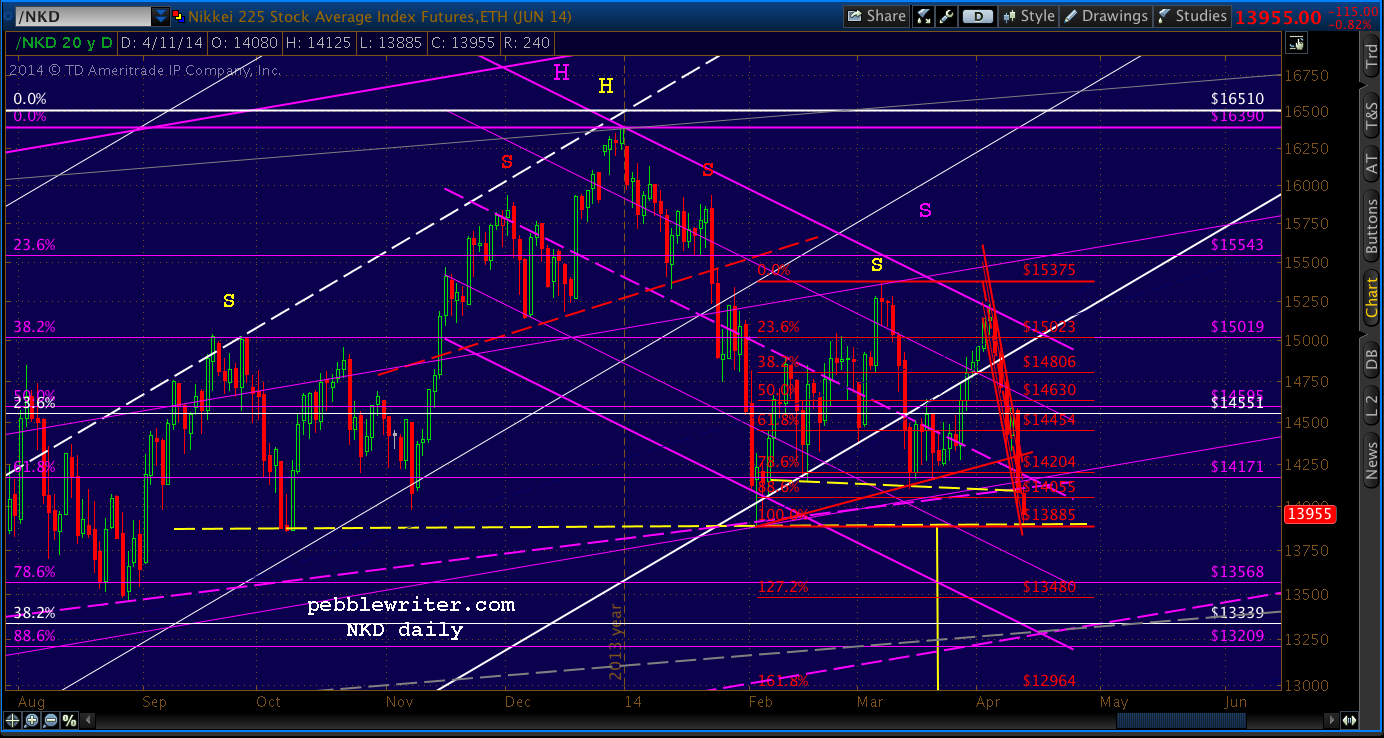 It has fallen 15% already. If the H&S plays out, there’s another 18% decline in store. The silence from the BOJ, which is rather boxed in at the moment, has been deafening [see: Sayonara Abenomics.]
 The chart that should make the bulls really nervous is the 10-yr note.
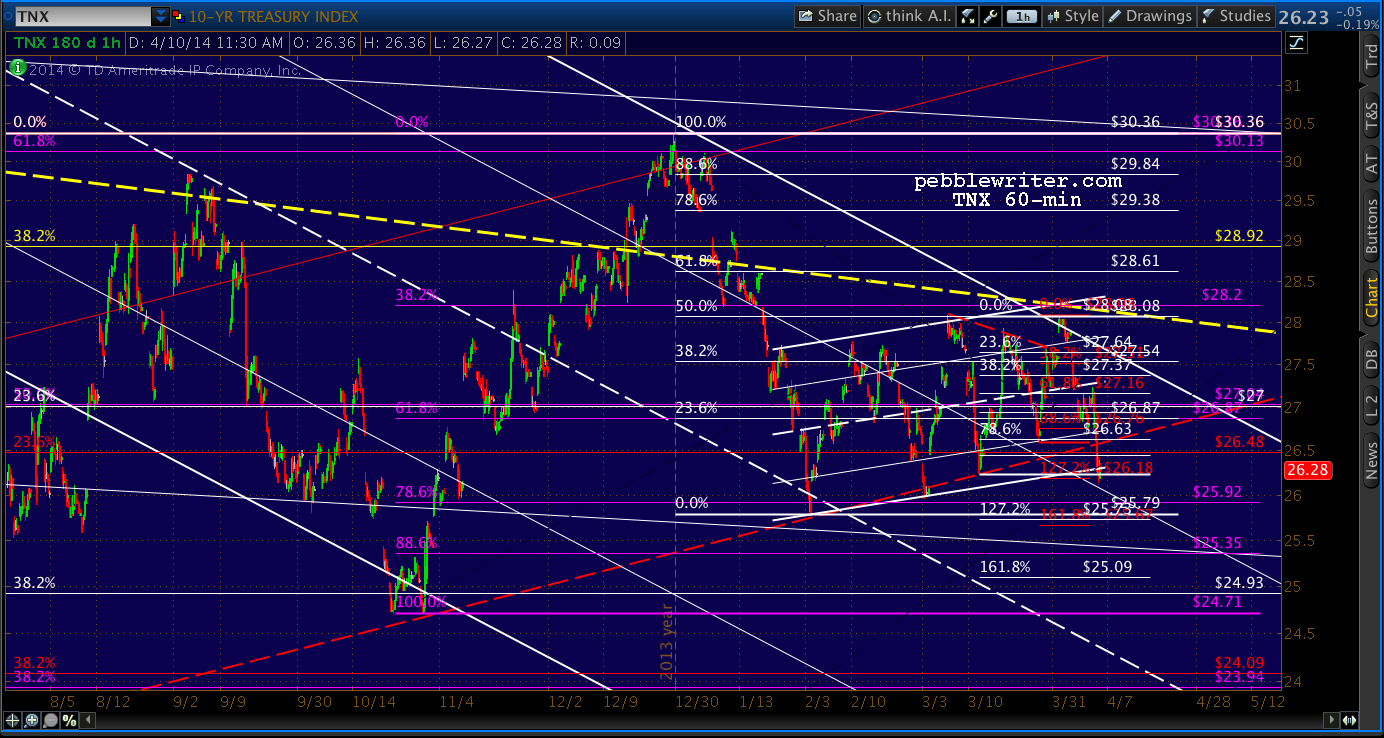 This morning, it broke down below the rising red channel midline which has provided ten distinct bounces over the past few years. Its failure will confirm our downside case as first laid out in the TNX v SPX scenario in December.

USDJPY still has plenty of downside ammunition left — accomplishing the above moves without needing to dip to the white .886. The key for bulls is staying above that rising red channel bottom currently around 101.59.
 More later.
UPDATE: 2:00 PM
We had nice rising channels working on ES and NKD, but they broke down an hours ago and retraced .886 of this morning’s lows.
 USDJPY, on the other hand, has respected its rising channel, and is on track to be back above the red channel bottom by the close.
As long as it futzes around below it, however, ES and NKD will not be inclined to break out to the upside.
As far as the downside, USDJPY might use the downside potential it still has to shake out some of the bulls playing the SMA100 bounce. Watch out for any dips below the channel, as they could be head fakes like the one in NKD earlier.
Any lasting departure from the channel should be seen as a signal of lower lows for equities. I would use the falling white wedge in USDJPY as a guide.
As I mentioned to an investor last night, this entire sell-off has felt somewhat “controlled.” While there’s certainly plenty of potential for big downside (and, I believe it is coming) there just hasn’t been much energy to it yet.
As long as USDJPY hangs around the rising red channel, It’s hard to get too excited about a big crack in the markets. Having said that, I wouldn’t turn my back on a long position for more than a second. Because, well-controlled sell-offs can get out of hand in a hurry.
If this one does, all the downside targets still apply from earlier in the week. There’s minor channel (bottom of the falling white channel) support at the .500 at 1809. And, there’s major support at the .618 at 1789 (the rising white channel.)
Bottom line, things are still bearish. SPX completed a H&S Pattern yesterday, and absent a rise back to 1837 by today’s close, that pattern should play out.
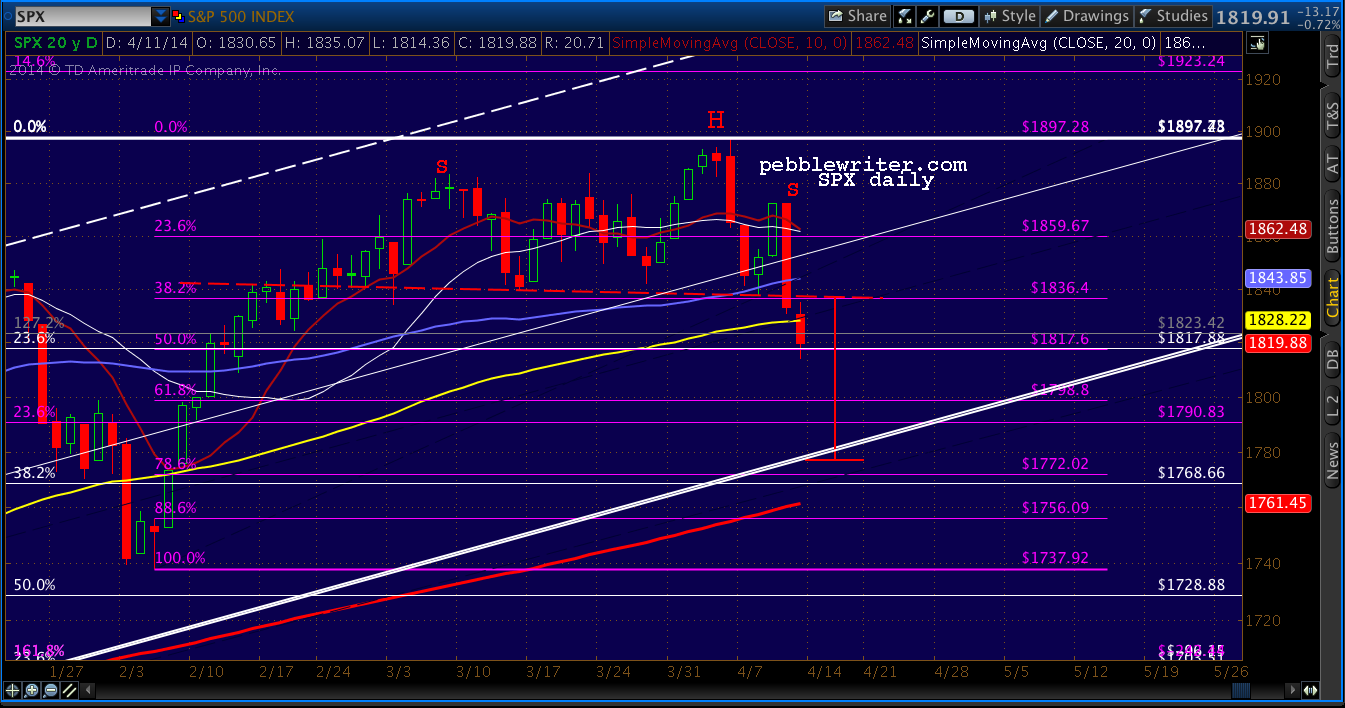 But, lots of these patterns have failed in the past few months — wreaking havoc for chart pattern traders. And, even if it does play out, a backtest of the neckline would be quite normal. If the SMA100 holds, the odds of a backtest are pretty good.
The best I can come up with is keep an eye on USDJPY. If they let it droop, stay short. When it strengthens, be long. And, especially keep an eye on the red channel bottom.
 I’ll wrap up over the weekend, but am signing off for now. Looks like the .500 Fib is safe, and USDJPY is back to the red channel bottom — but, a close below the SMA100 is definitely bearish (ES 1819 and SPX 1828.)
One last note…I will be traveling Monday – Wednesday and posts will be spotty. I might even take a day off, depending on how things are going.
GLTA.