

When a rising channel breaks down, but prices rise up to tag it from below one last time before dropping further, we call that a backtest. Traditionally, it has represented a last gasp before a significant drop.
Over the past year or two, it’s often been a head fake. Prices often: (1) continue higher on the underside of the broken channel; or, (2) rejoin the broken channel and continue higher as though nothing ever happened.
I’ve seen several instances the past couple of days in the many charts I watch, raising the question: is this one for real?
continued for members…
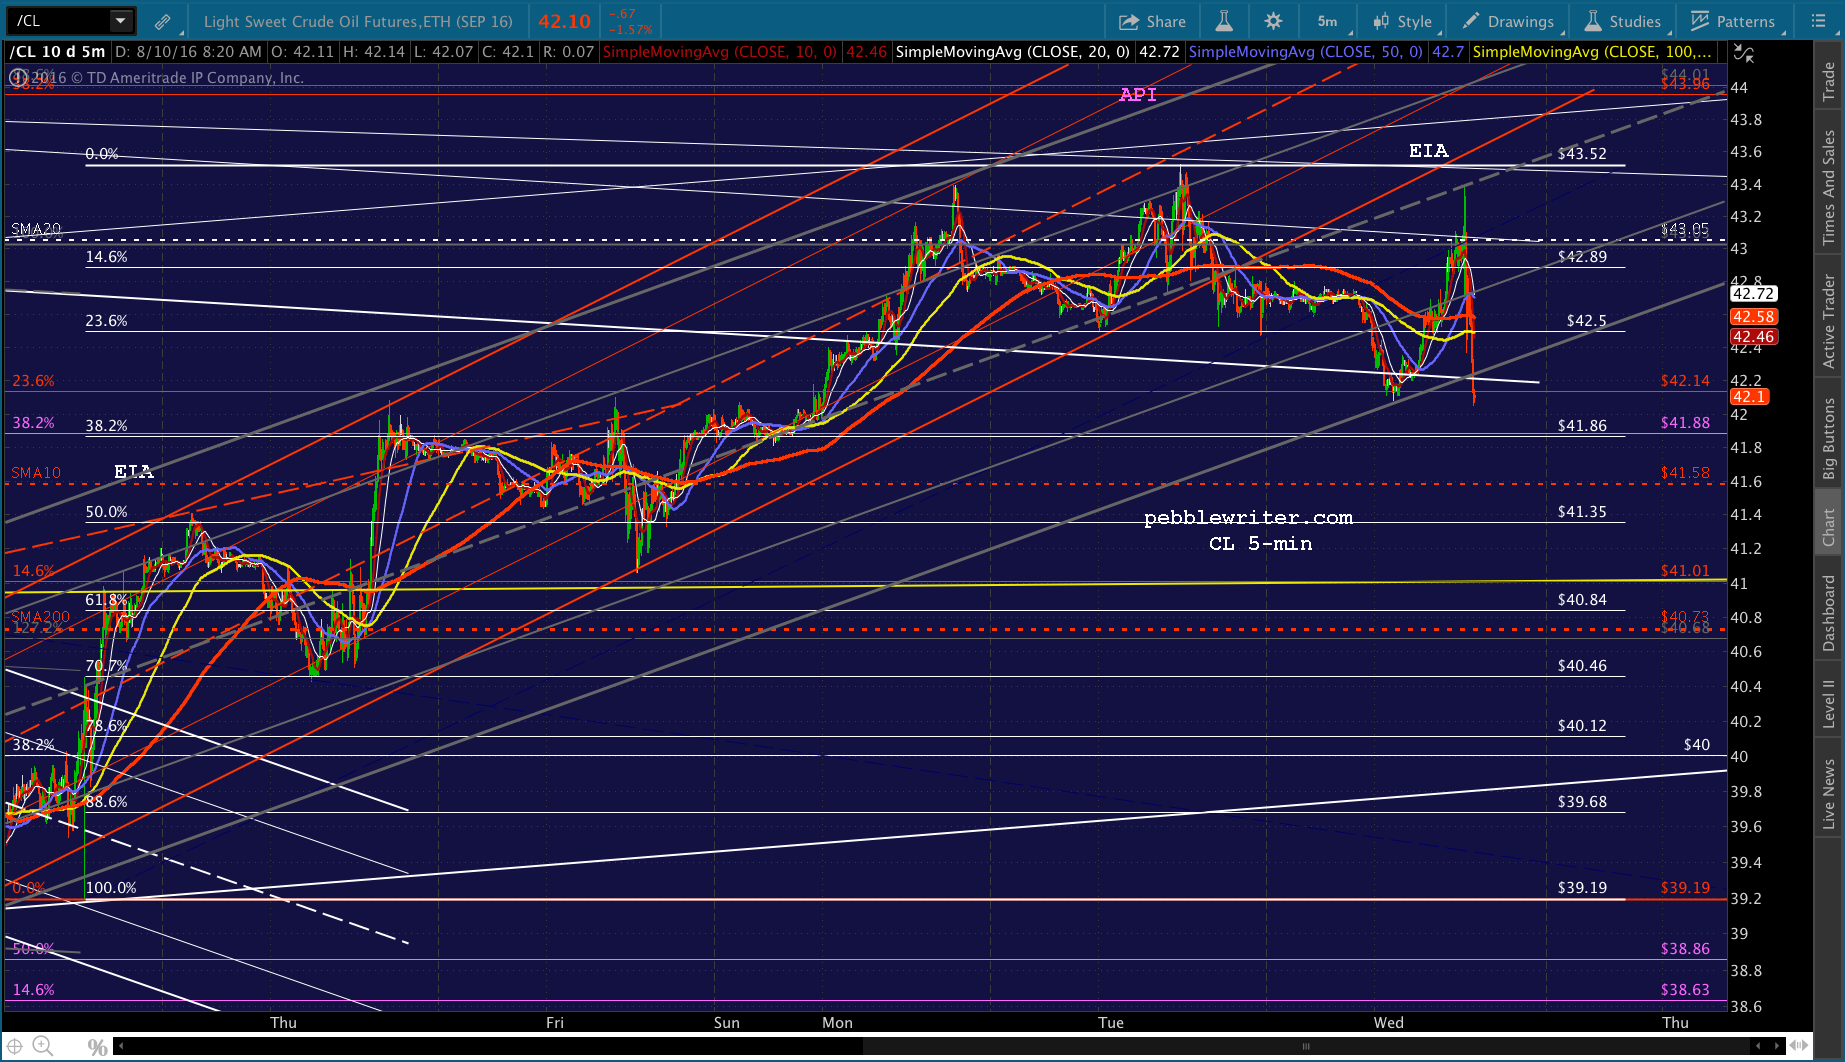
CL’s rising red channel broke down yesterday, and it’s backtesting the SMA20 that it flirted with all morning. As yesterday, a pop back above the SMA20 could short-circuit or, at least, delay any serious downturn.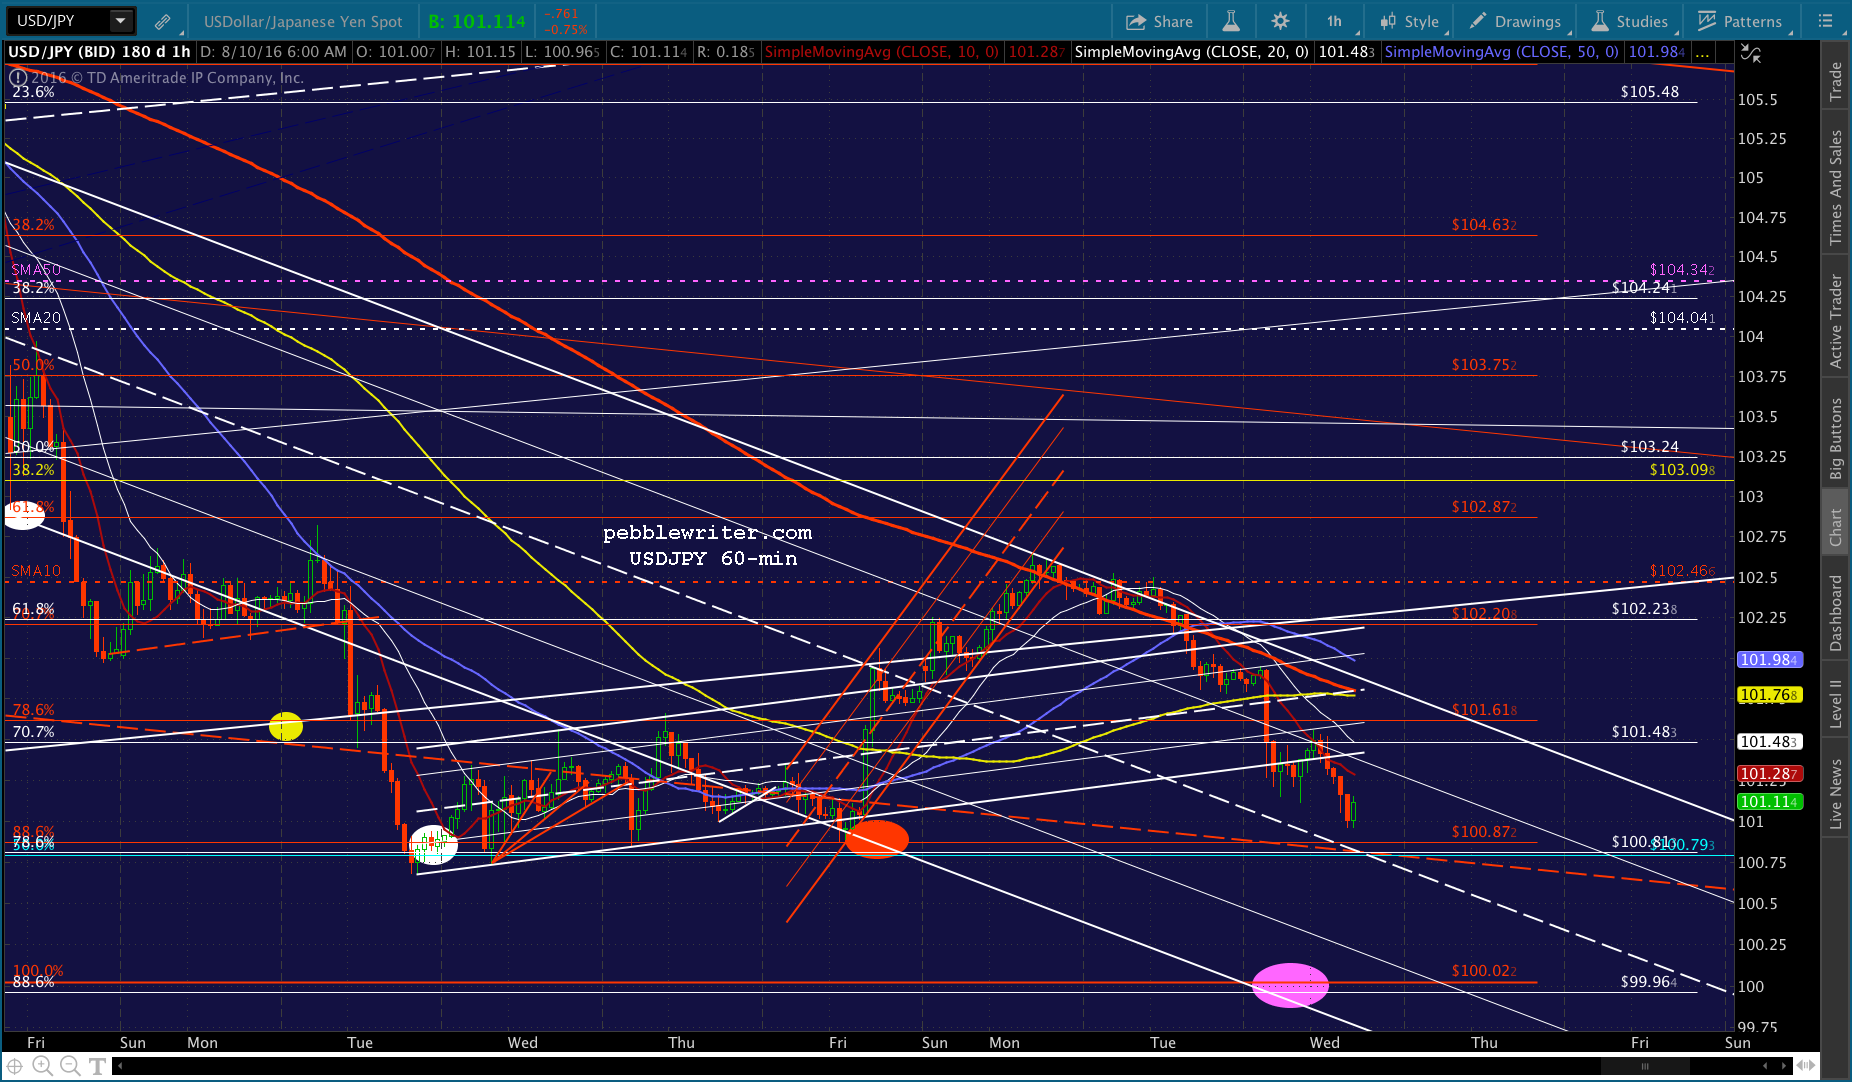
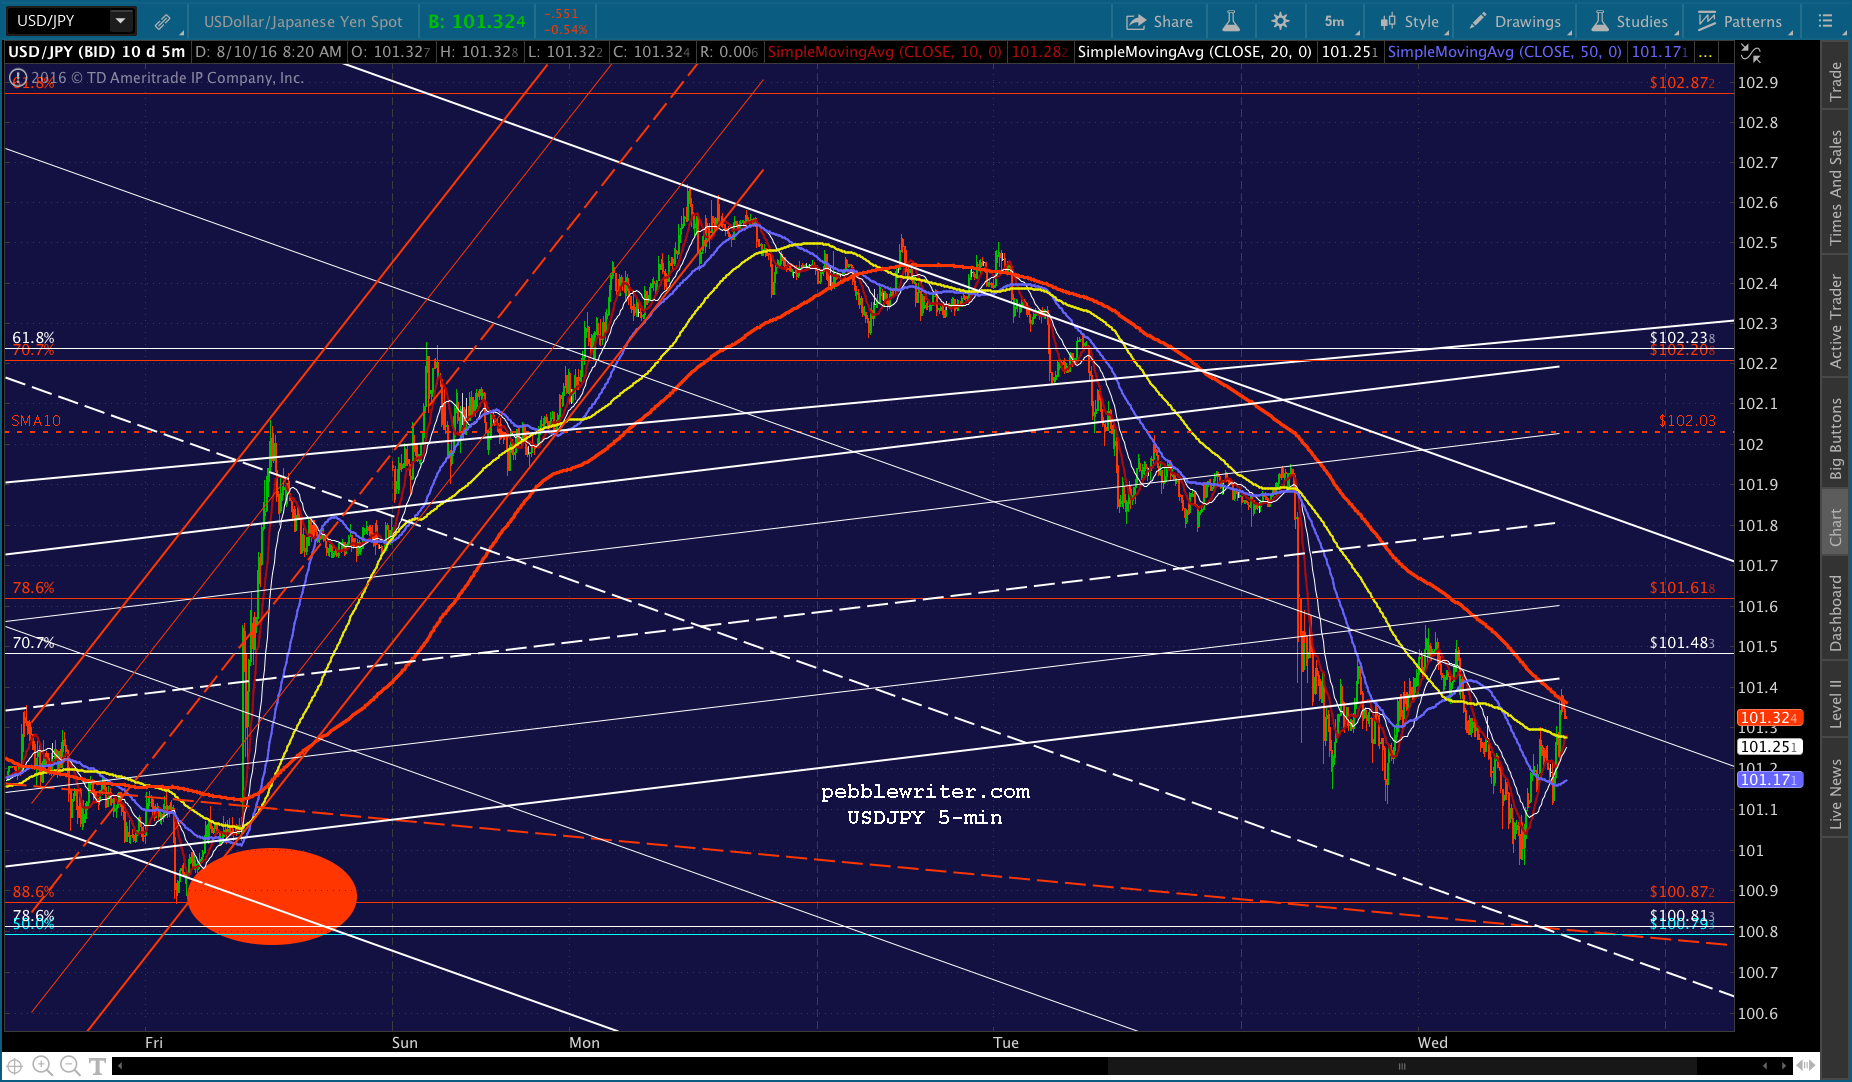
While, USDJPY’s small white channel broke down as expected, and the falling white channel remains intact. Though, like CL, it is on an upswing as we head into the cash open.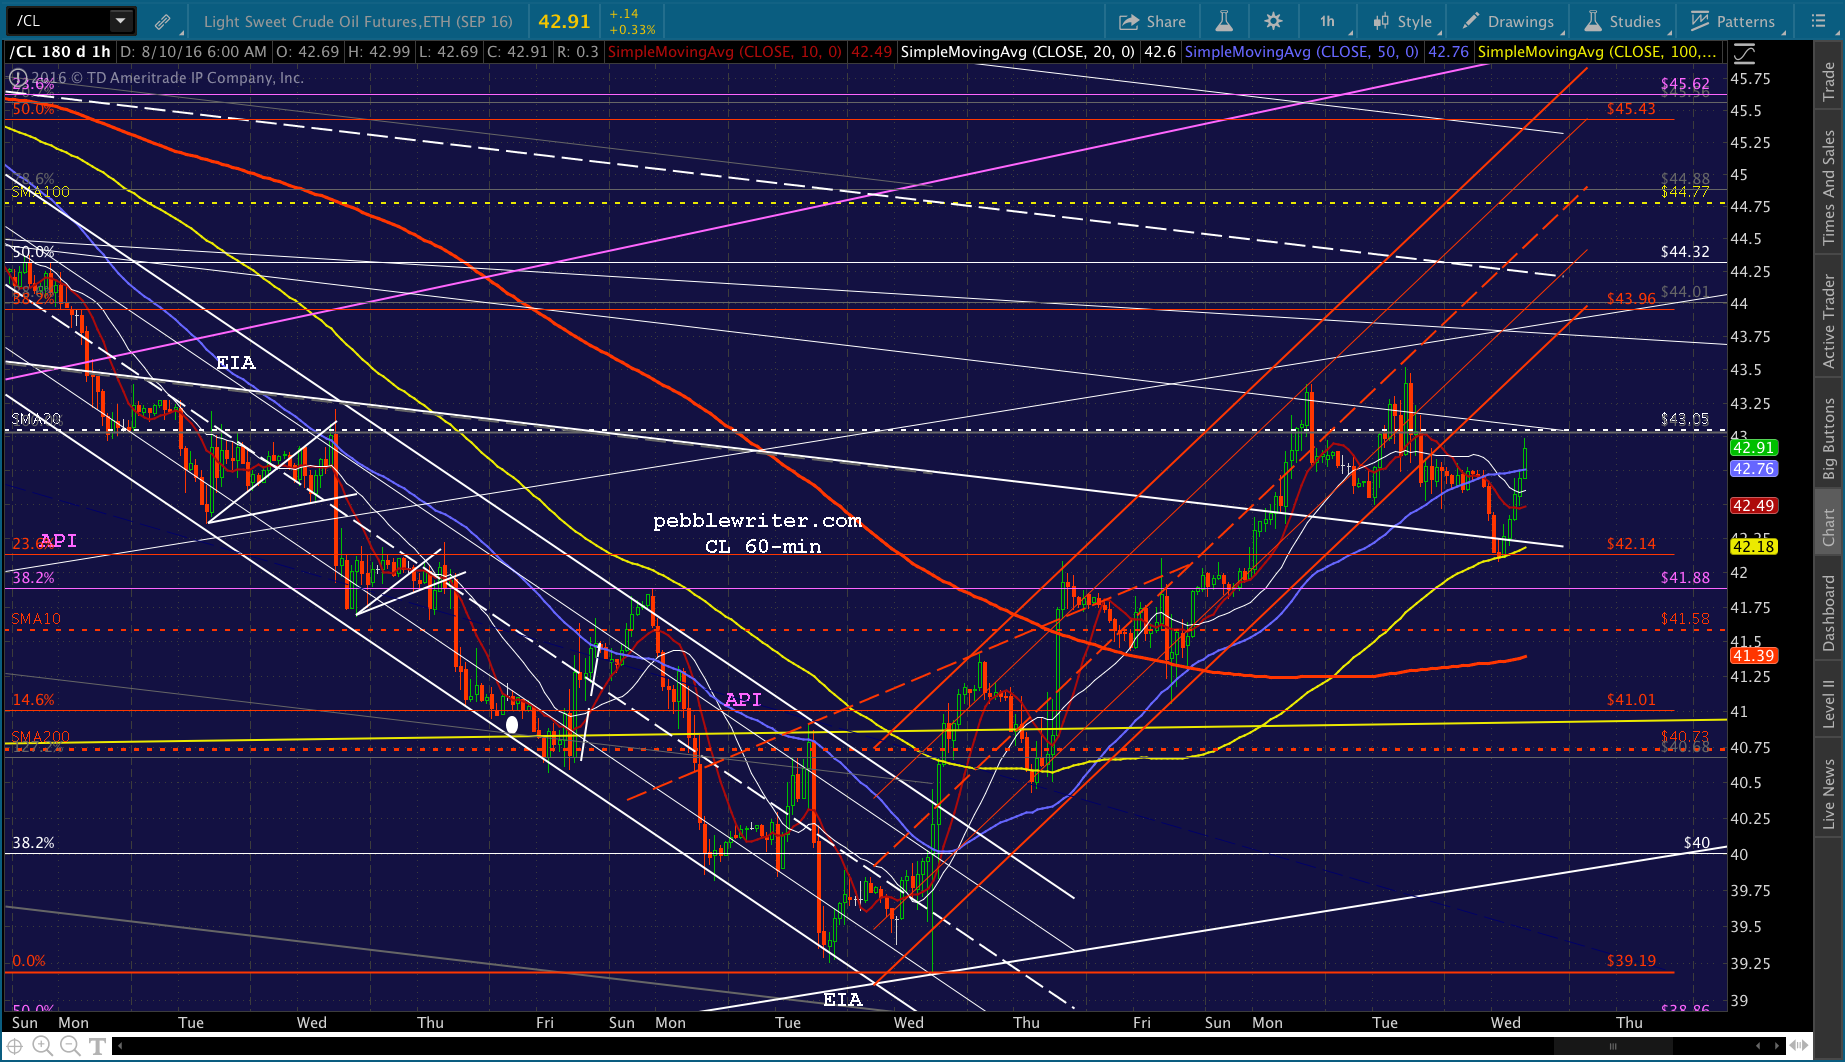
I threw out a few downside targets for SPX yesterday. I’d initially look for the SMA10 at 2169.91, followed by the SMA20 at 2167.08, which is about where the purple channel midline and red .500 Fib retracement are. If it manages to drop through the midline, then the channel bottom is around the red .886 at 2152.15.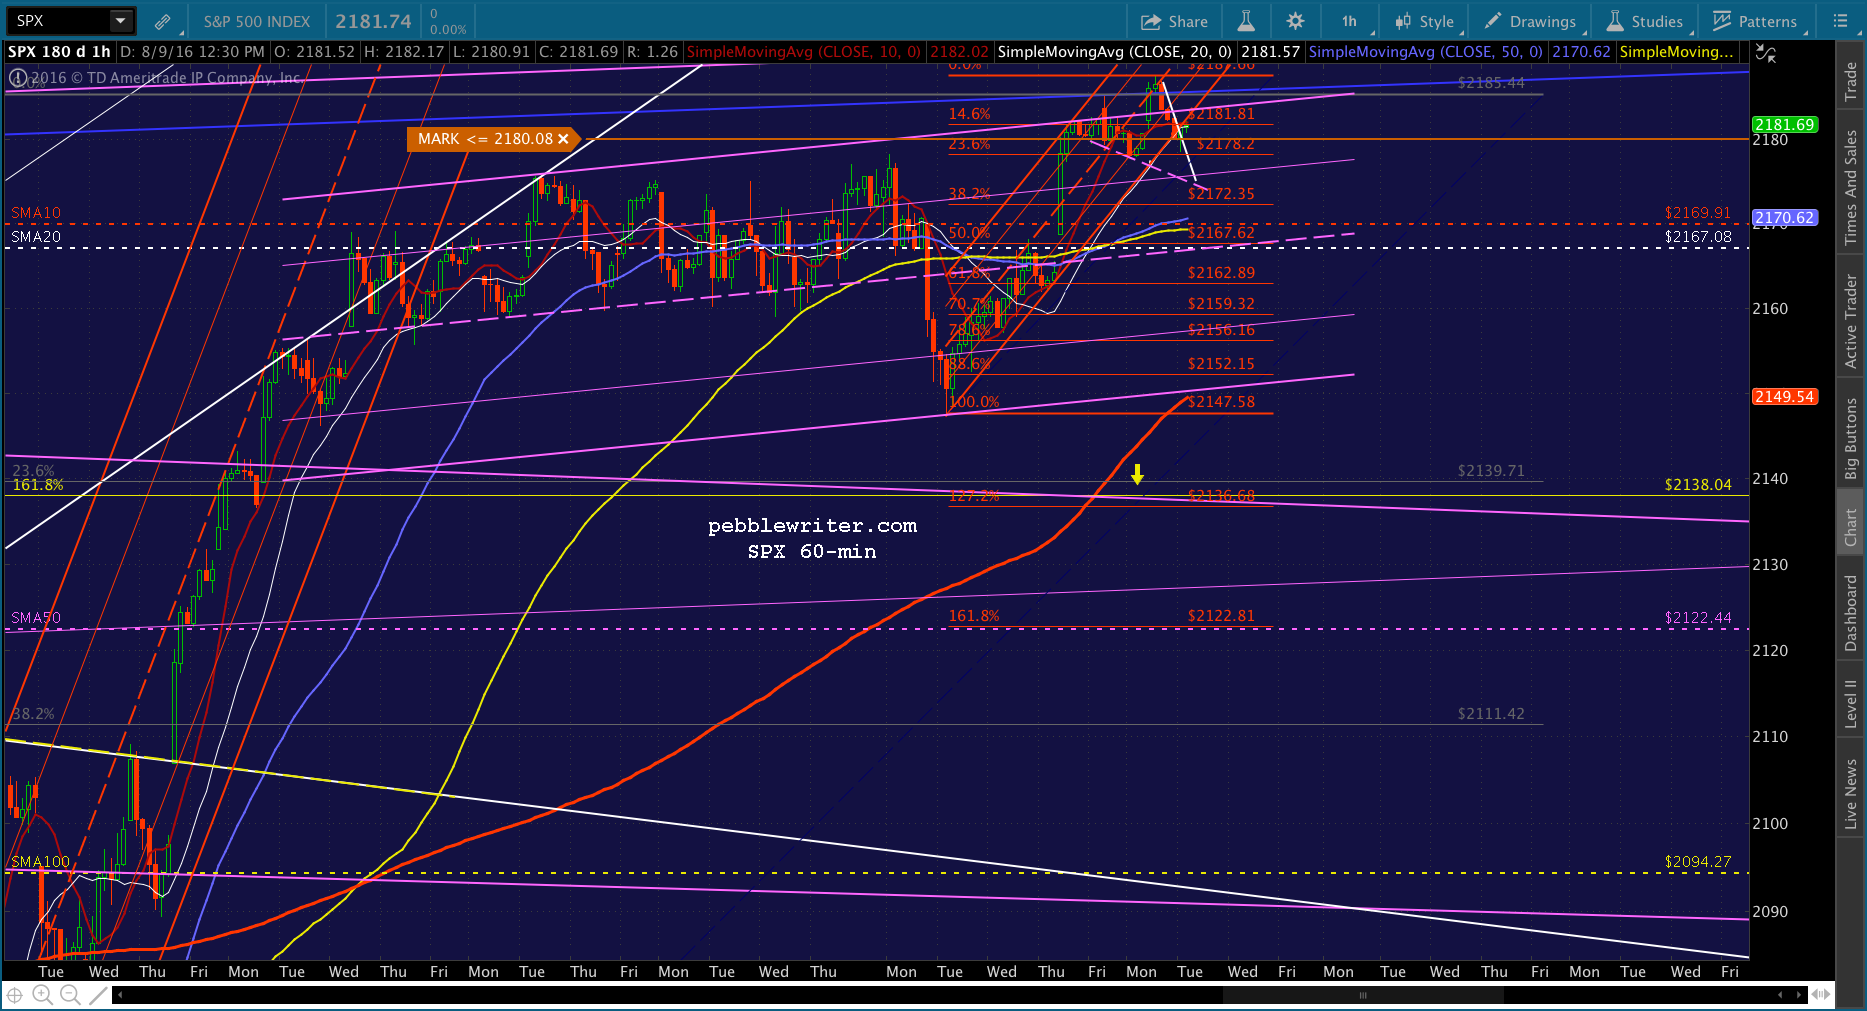
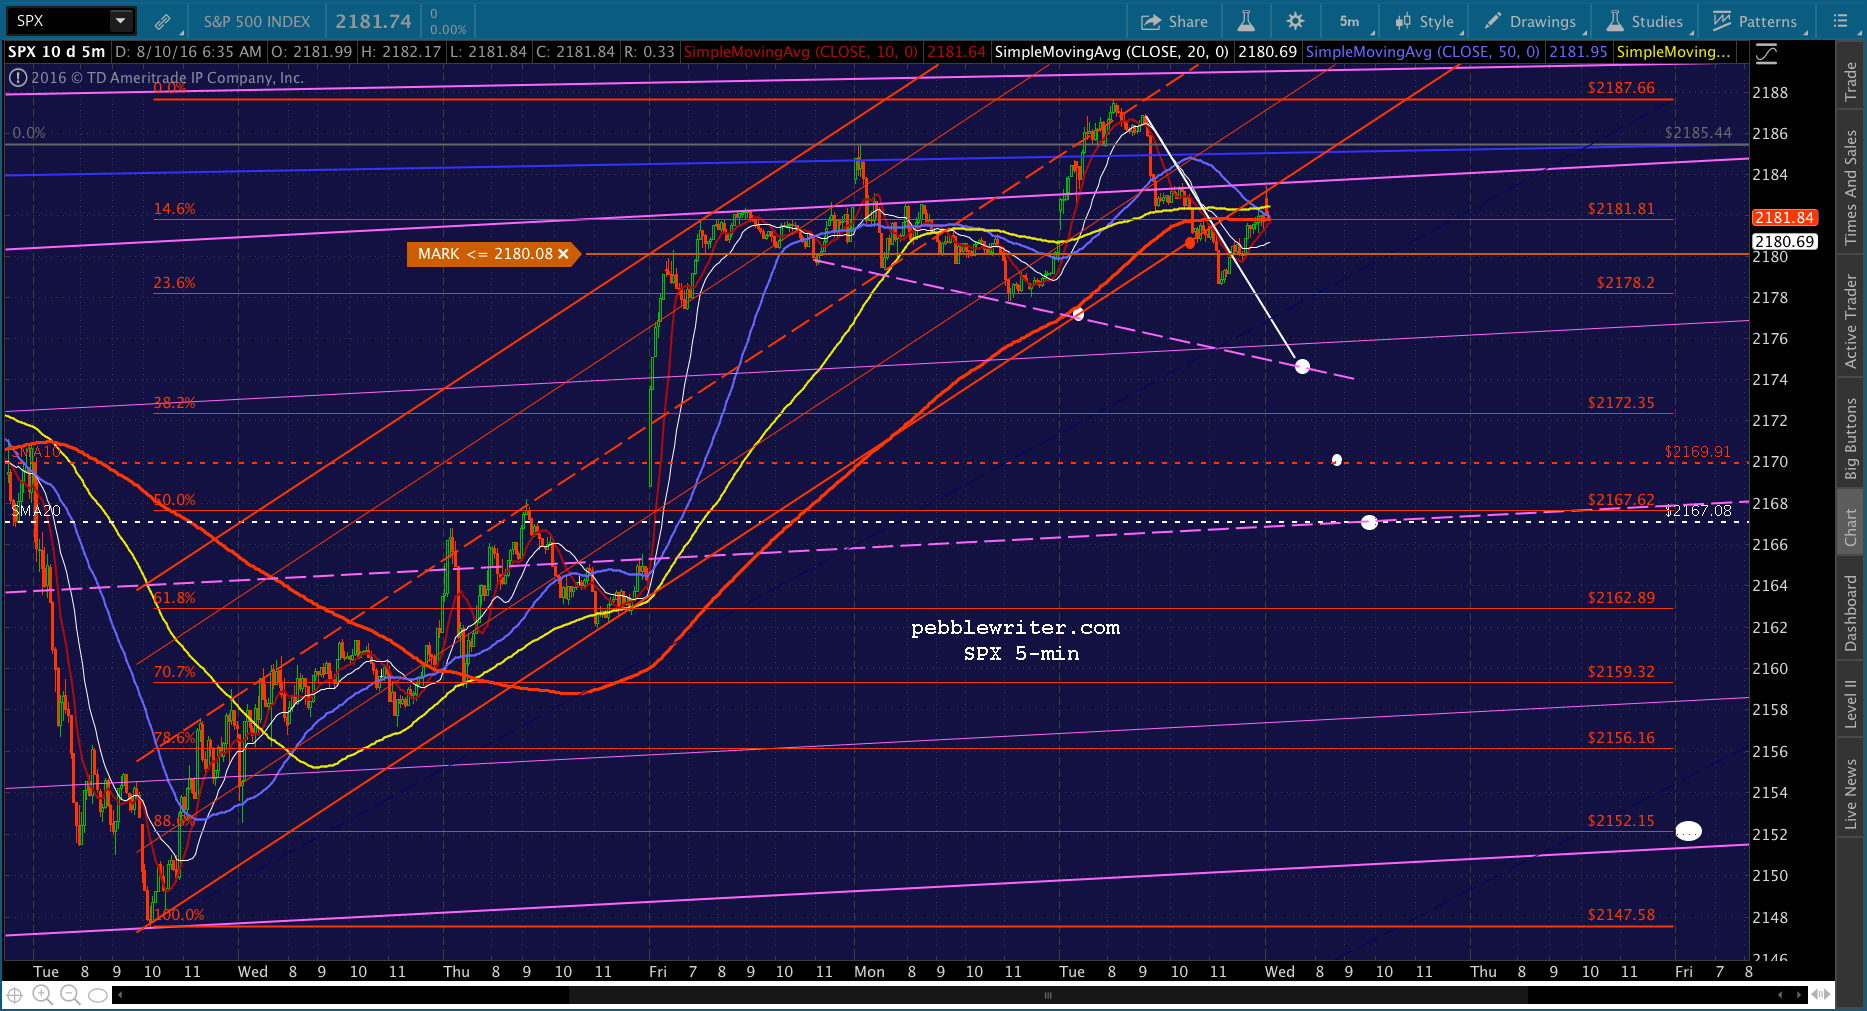
A close-up:
UPDATE: 11:24 AM
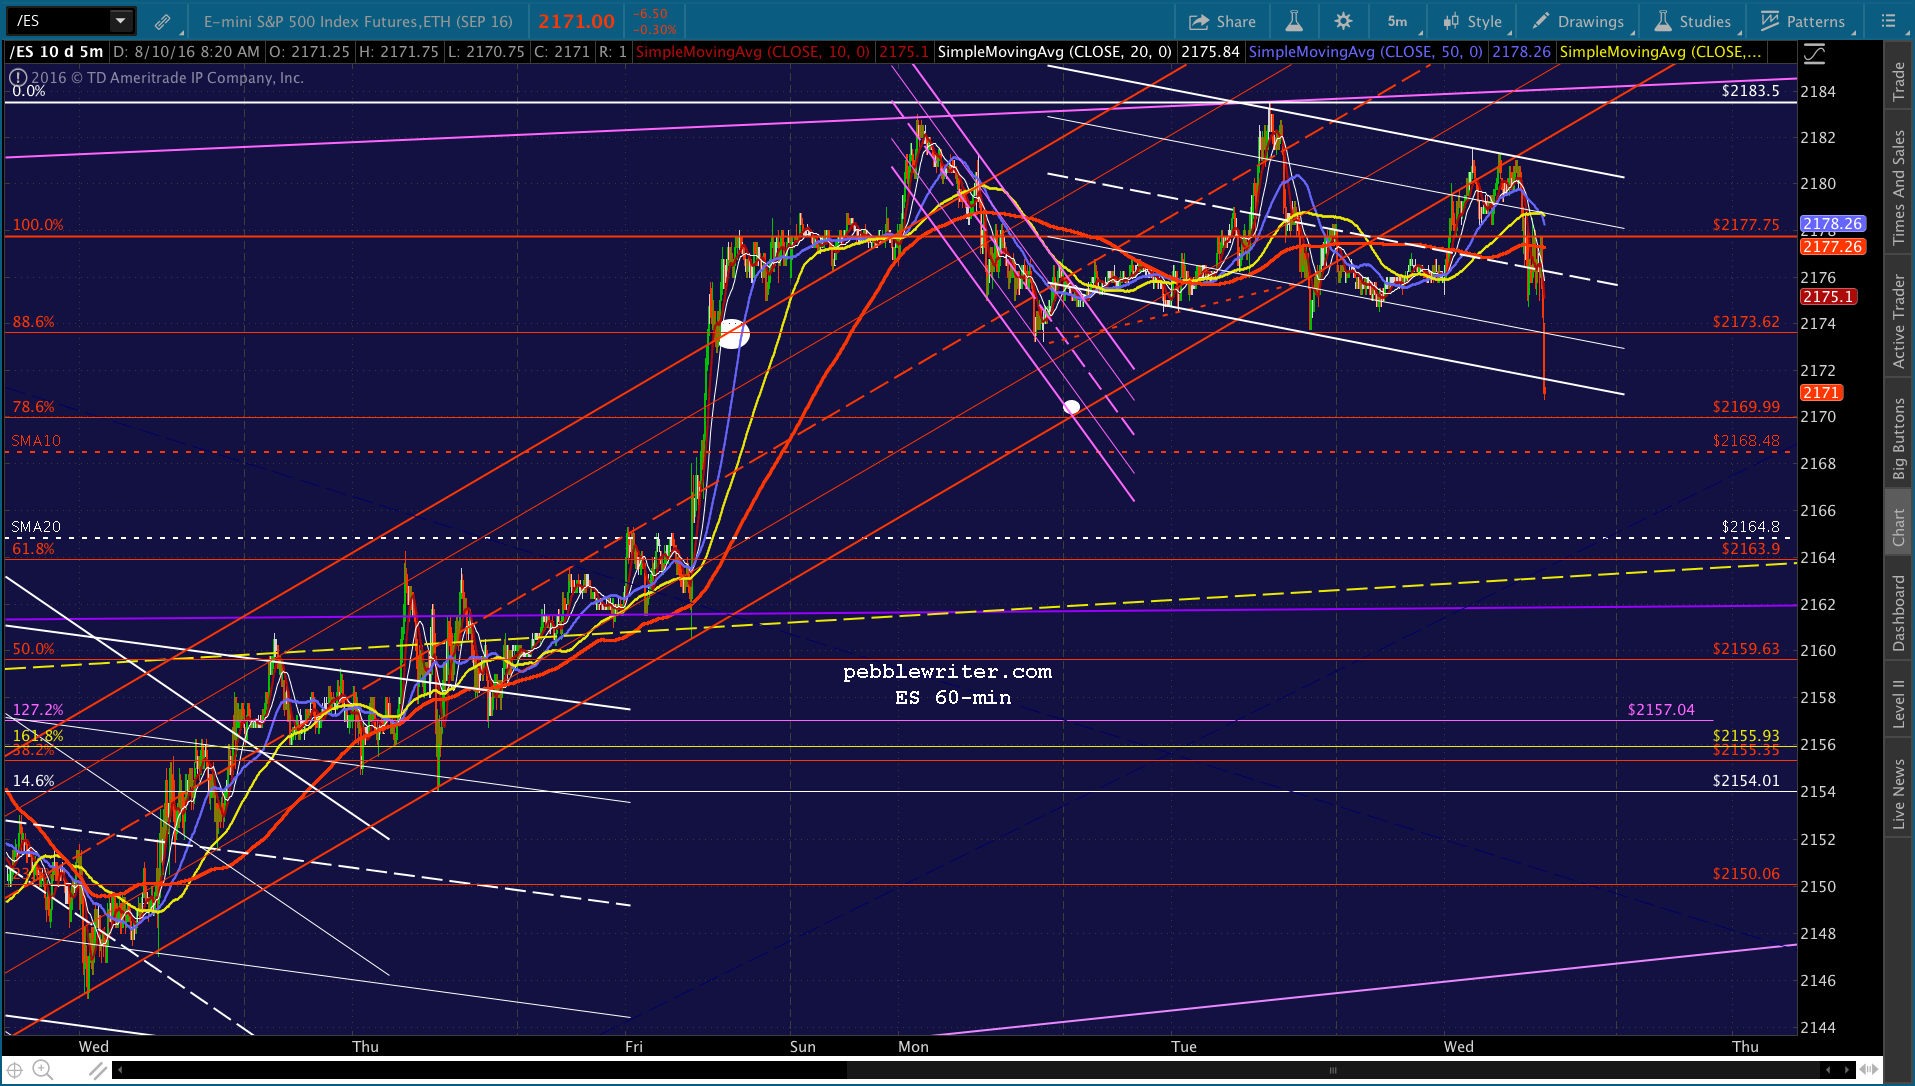
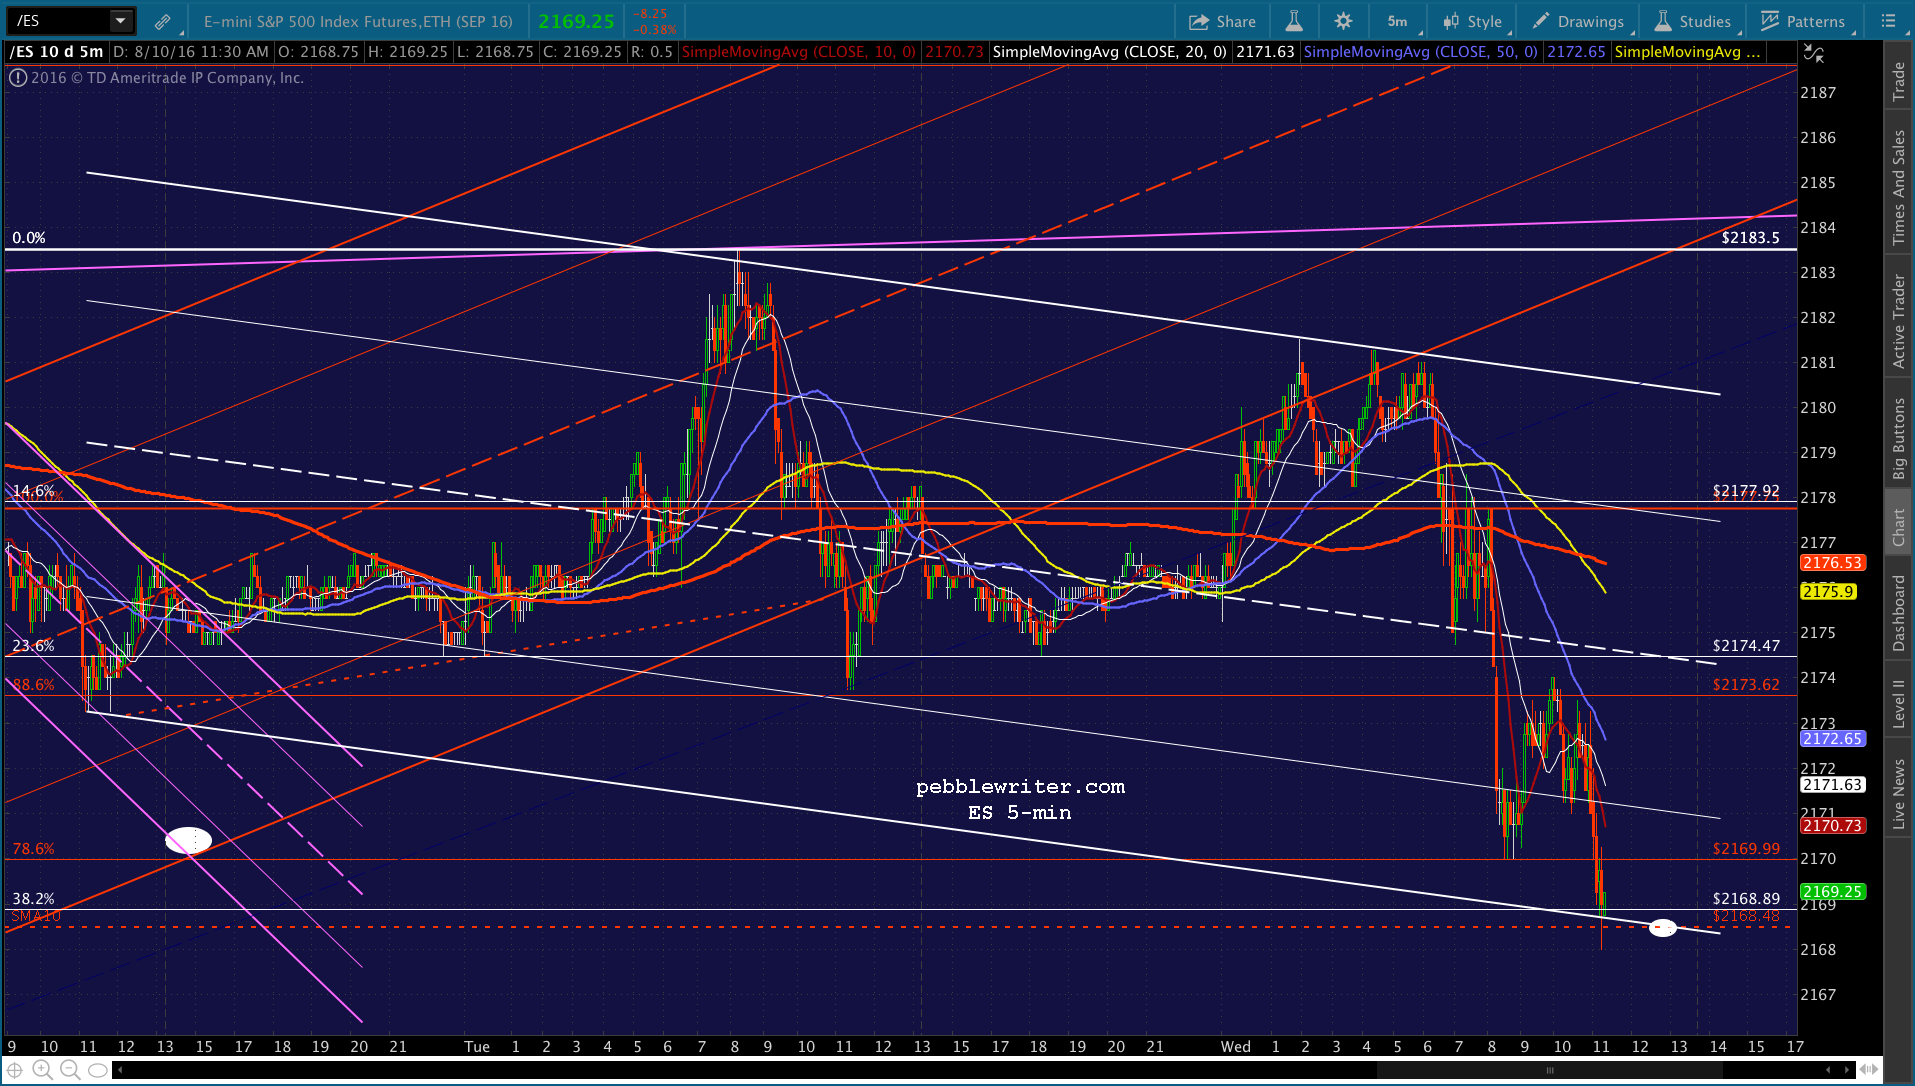
Approaching the purple TL and our first level of potential support. Note that ES’ SMA10 is about 2 points lower at 2168.48, while SPX’s is about 5 points lower. So, playing a bounce here is a little iffy.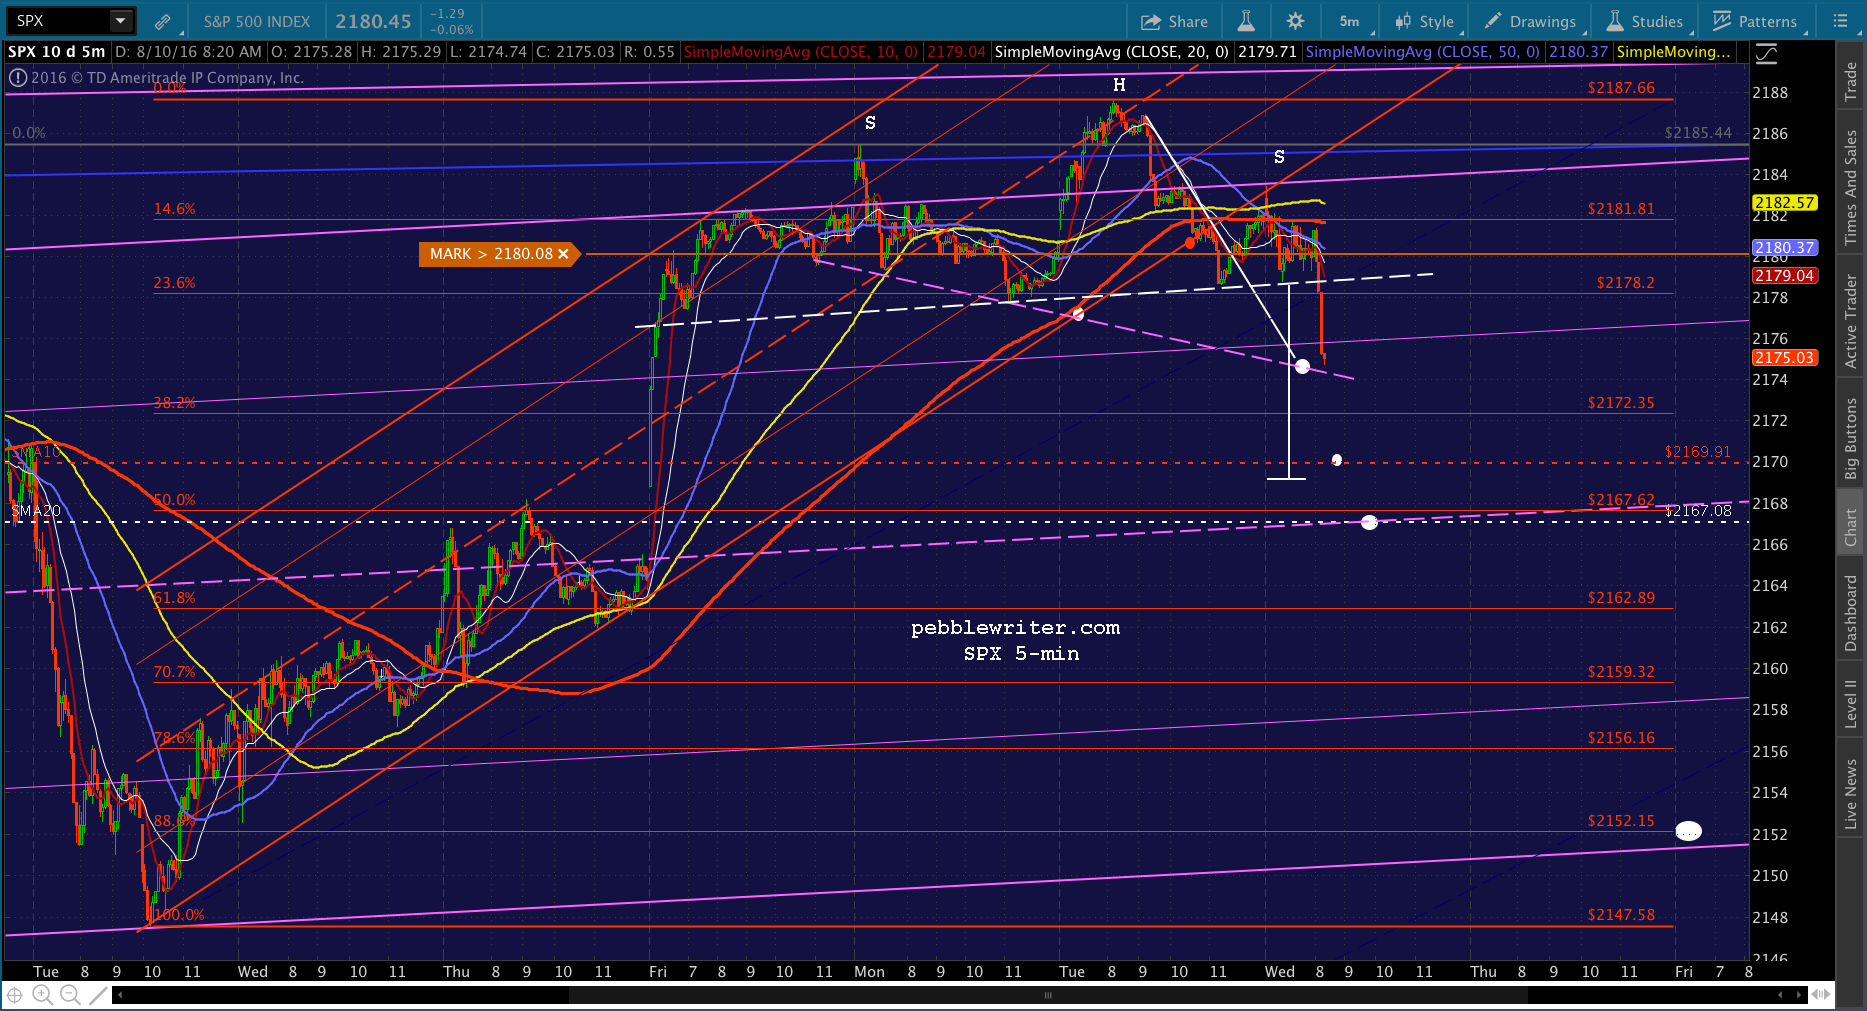
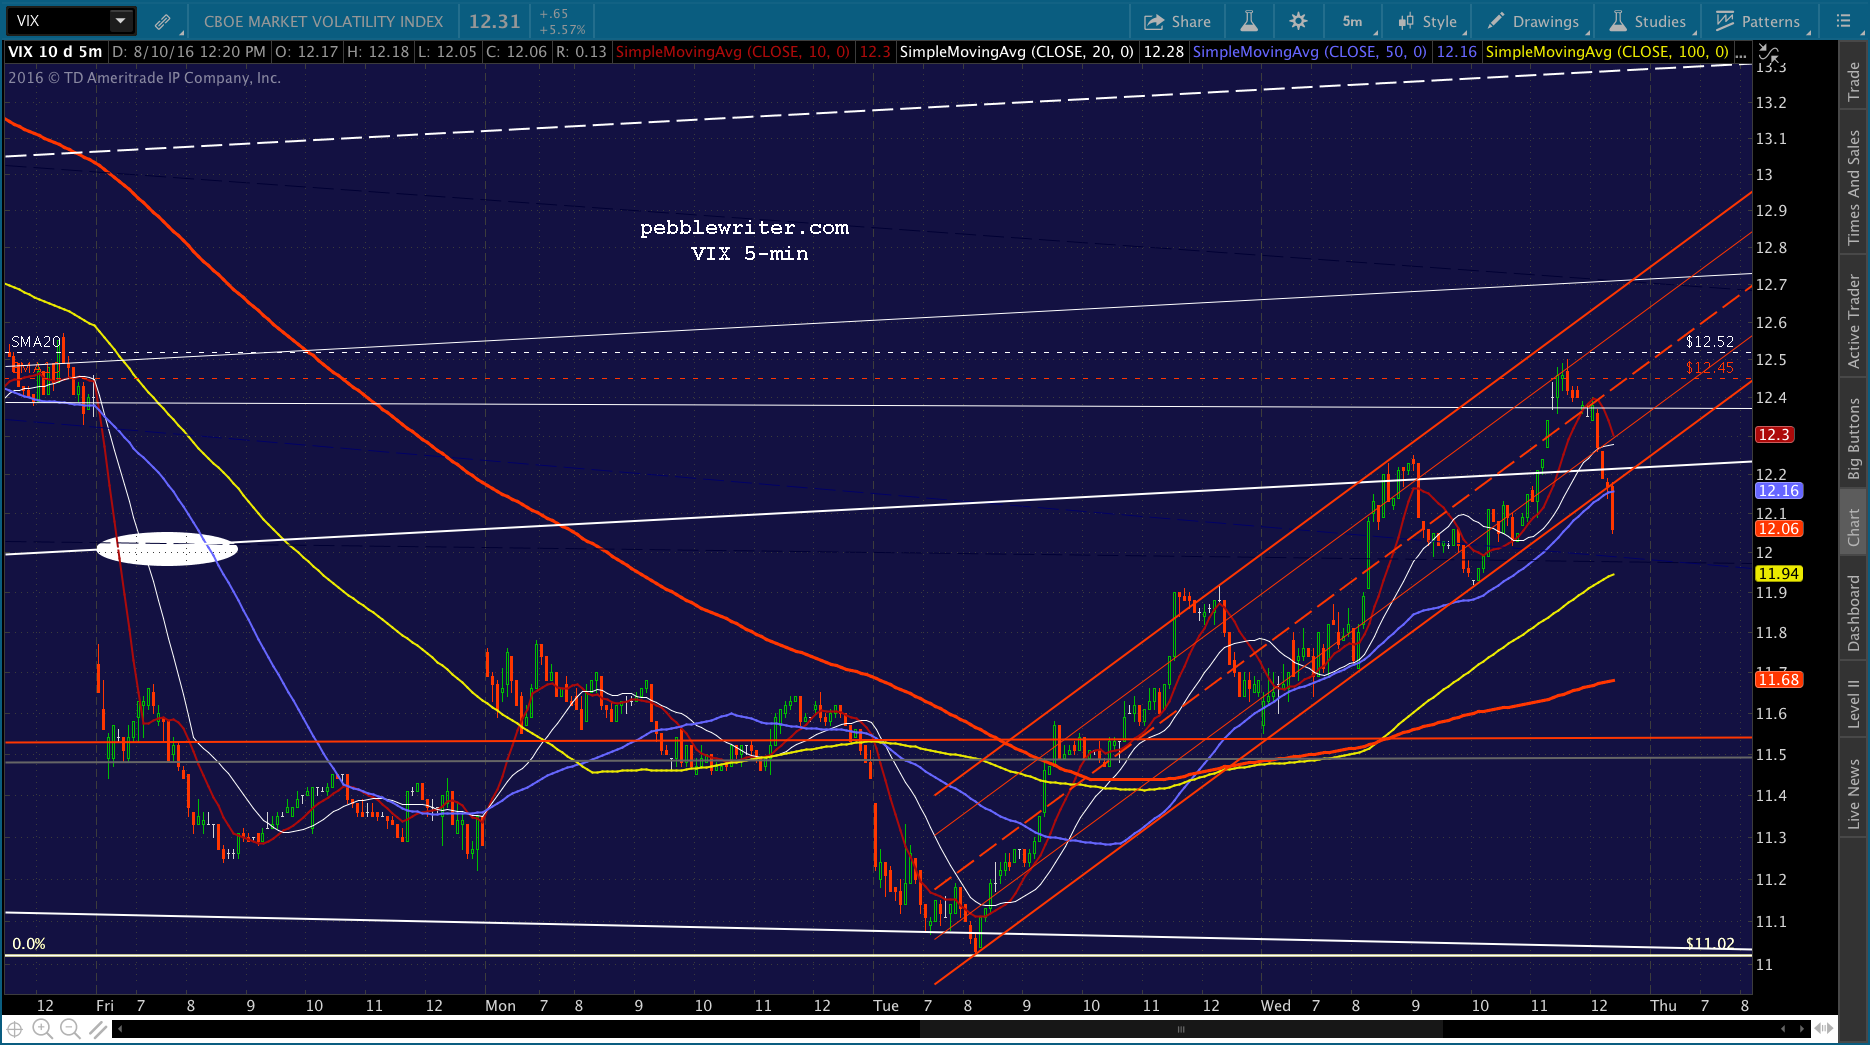
VIX suggests we could very well get a nice bounce. I’ll be watching to see if it pops up over the bottom of the little flag pattern completed last week.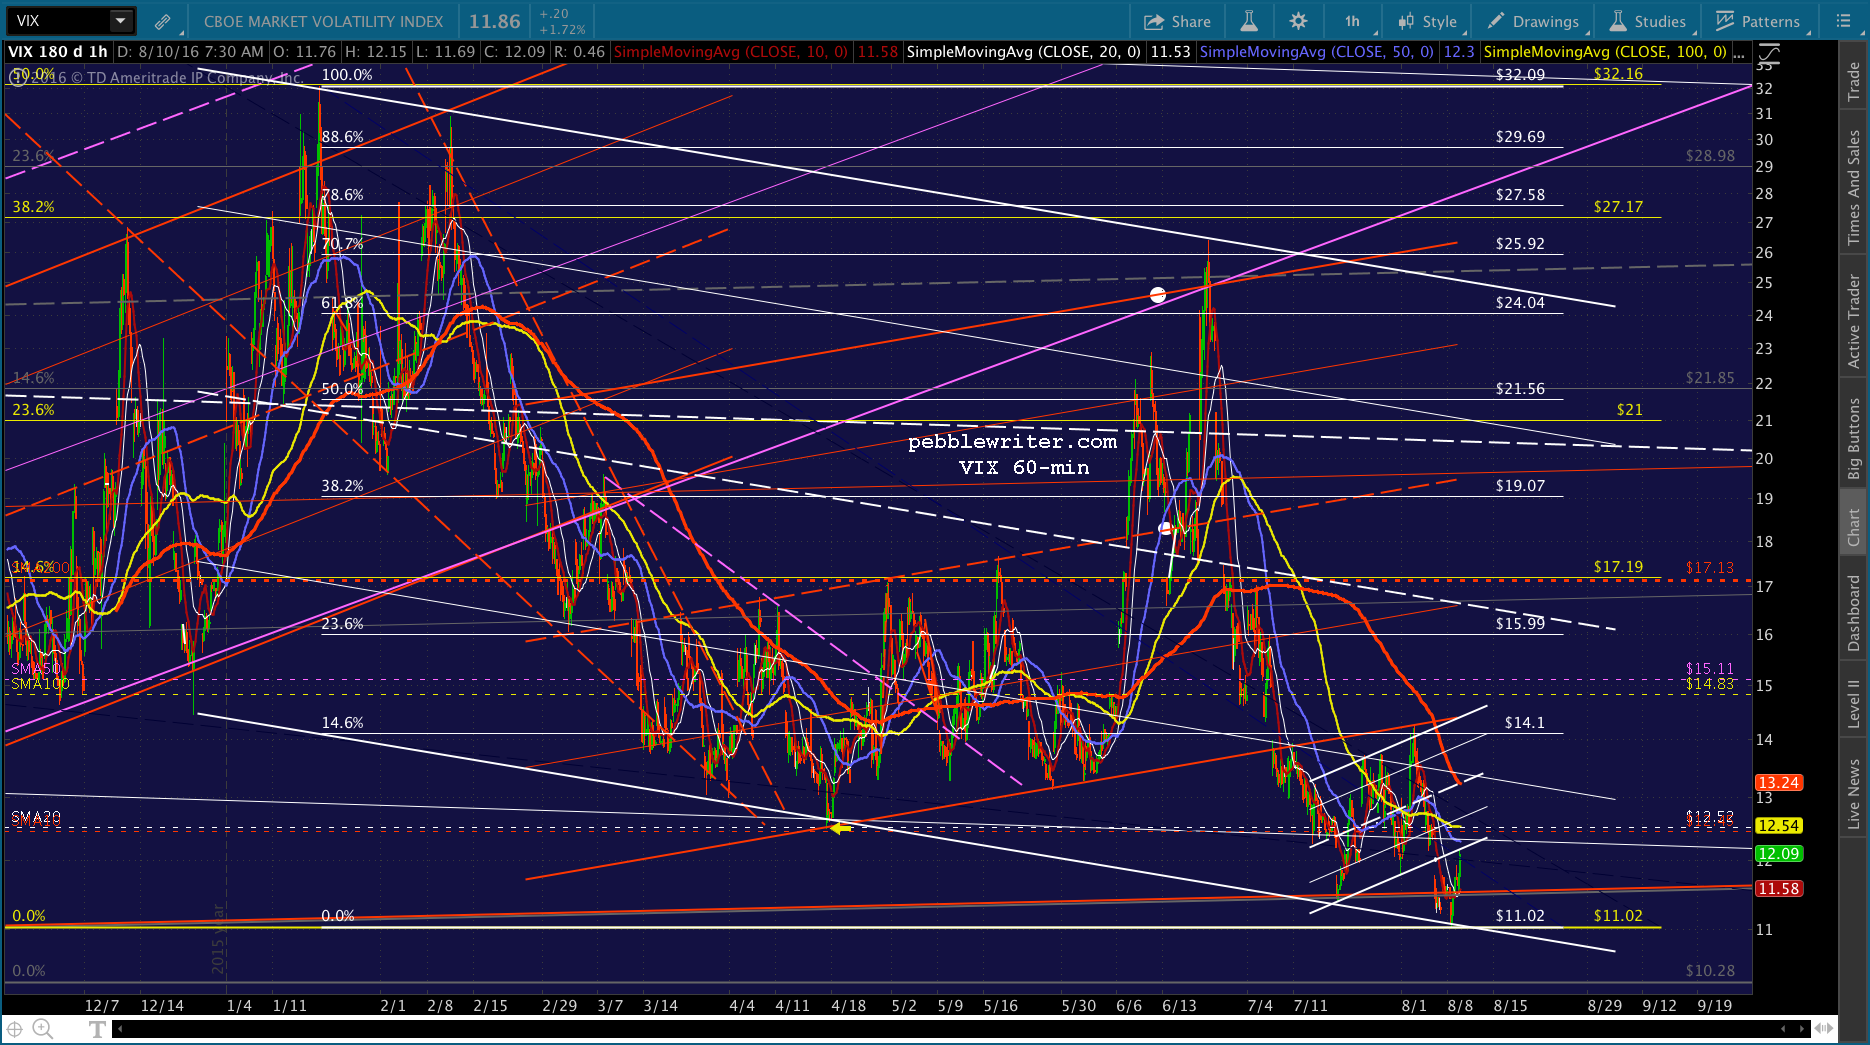
UPDATE: 1:35 PM
Quick update…ES suggests 2168.50 at the close, which would equate to 2172.35 for SPX. 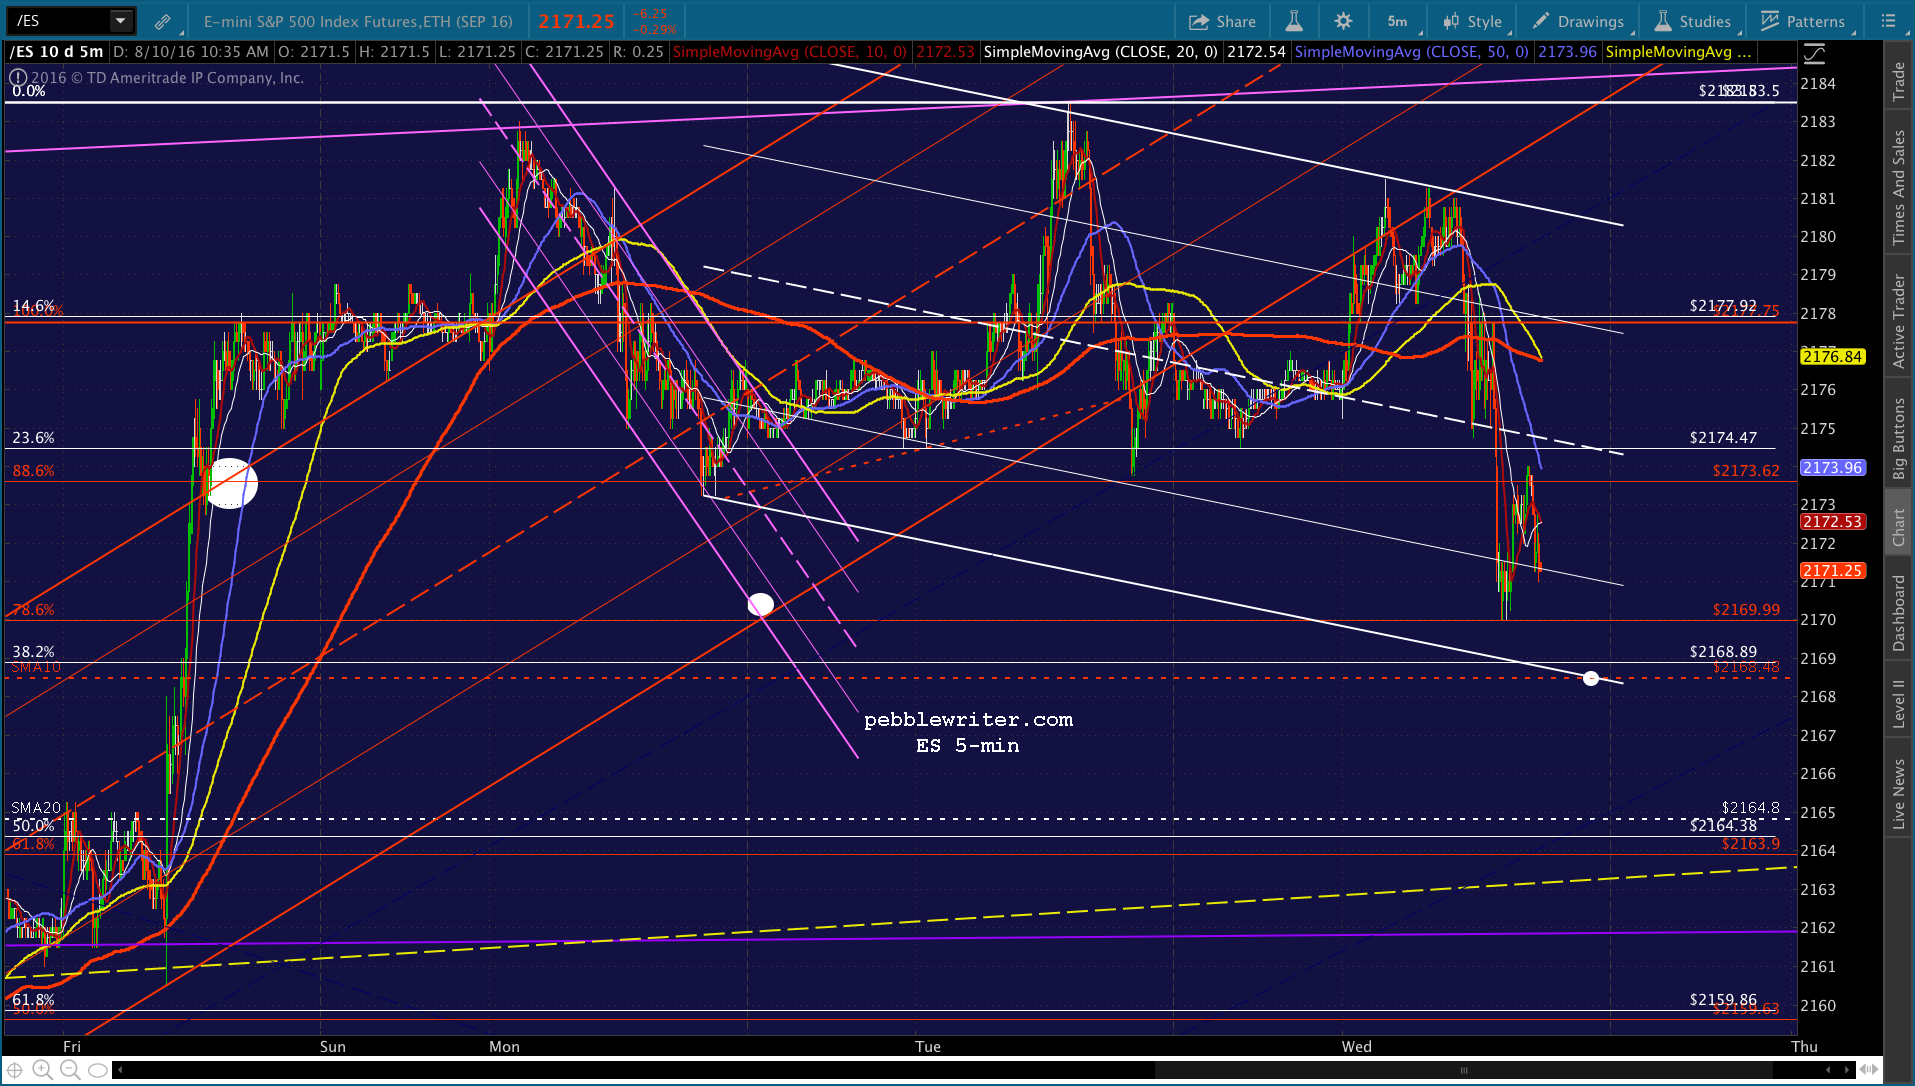
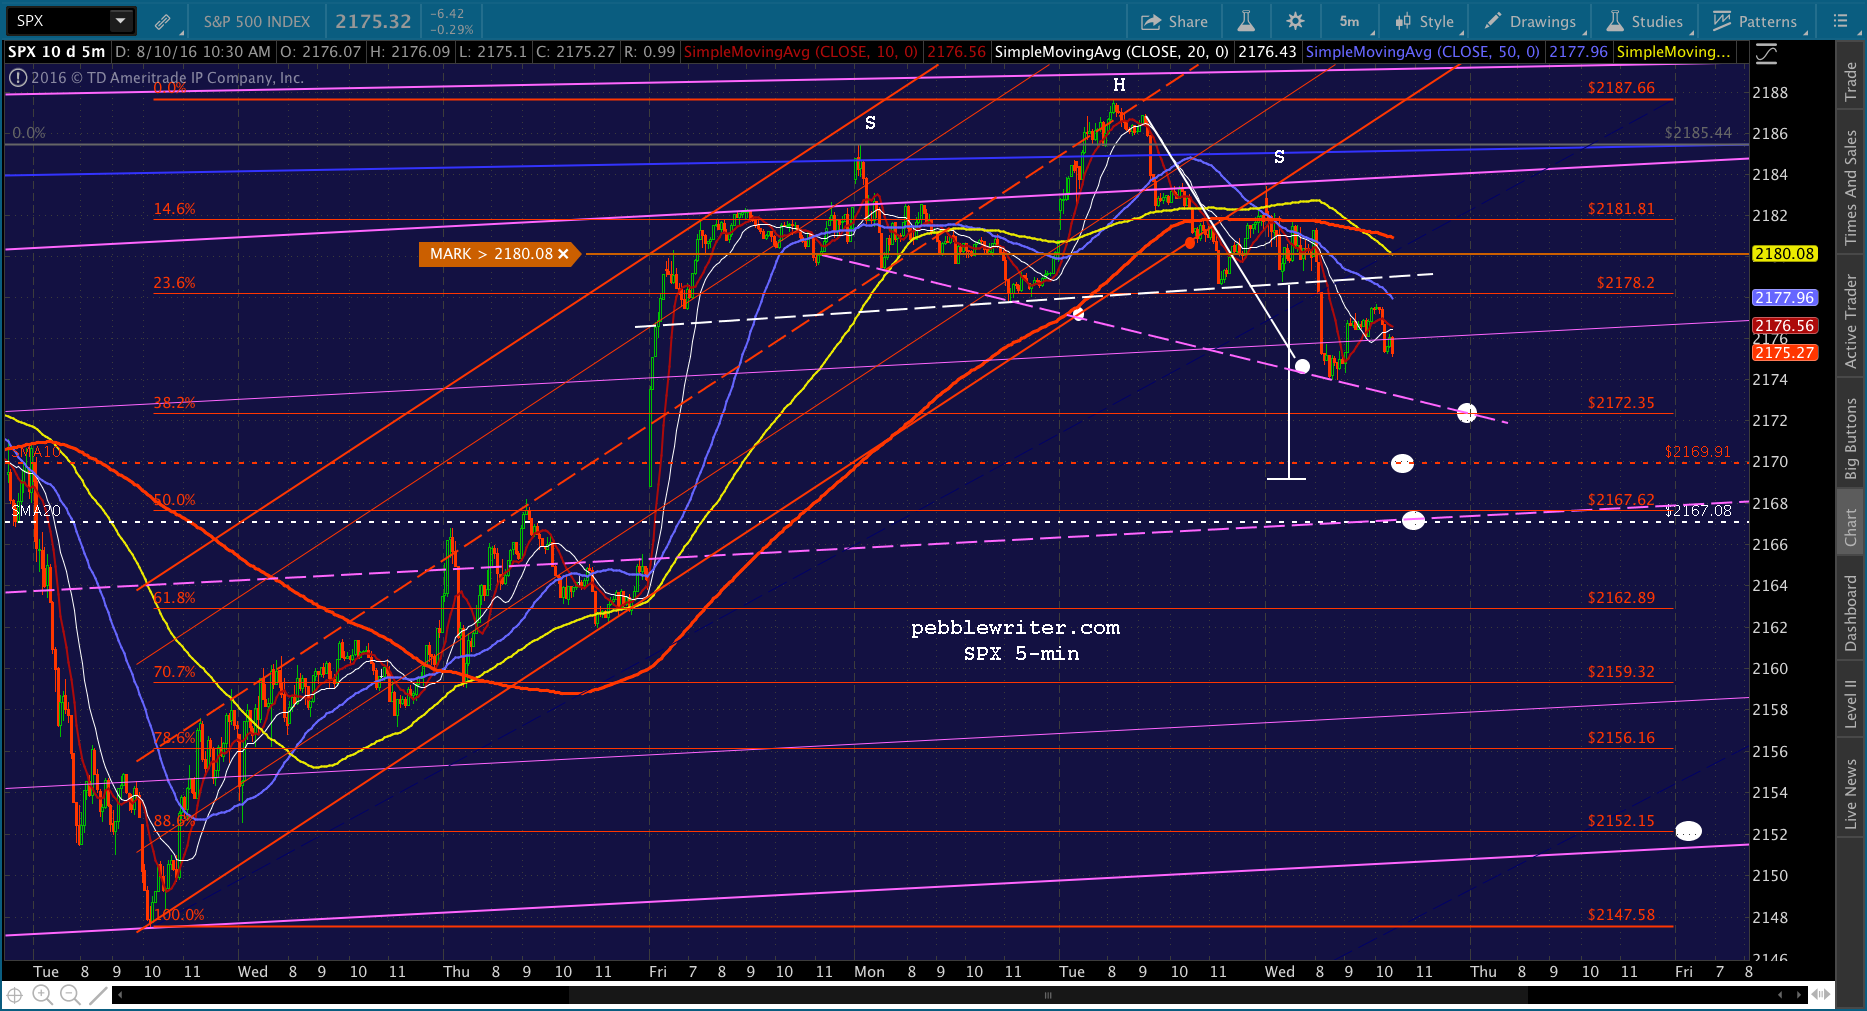 In fact, if it waits until tomorrow morning, SPX’s SMA10 will probably be up to 2172.35.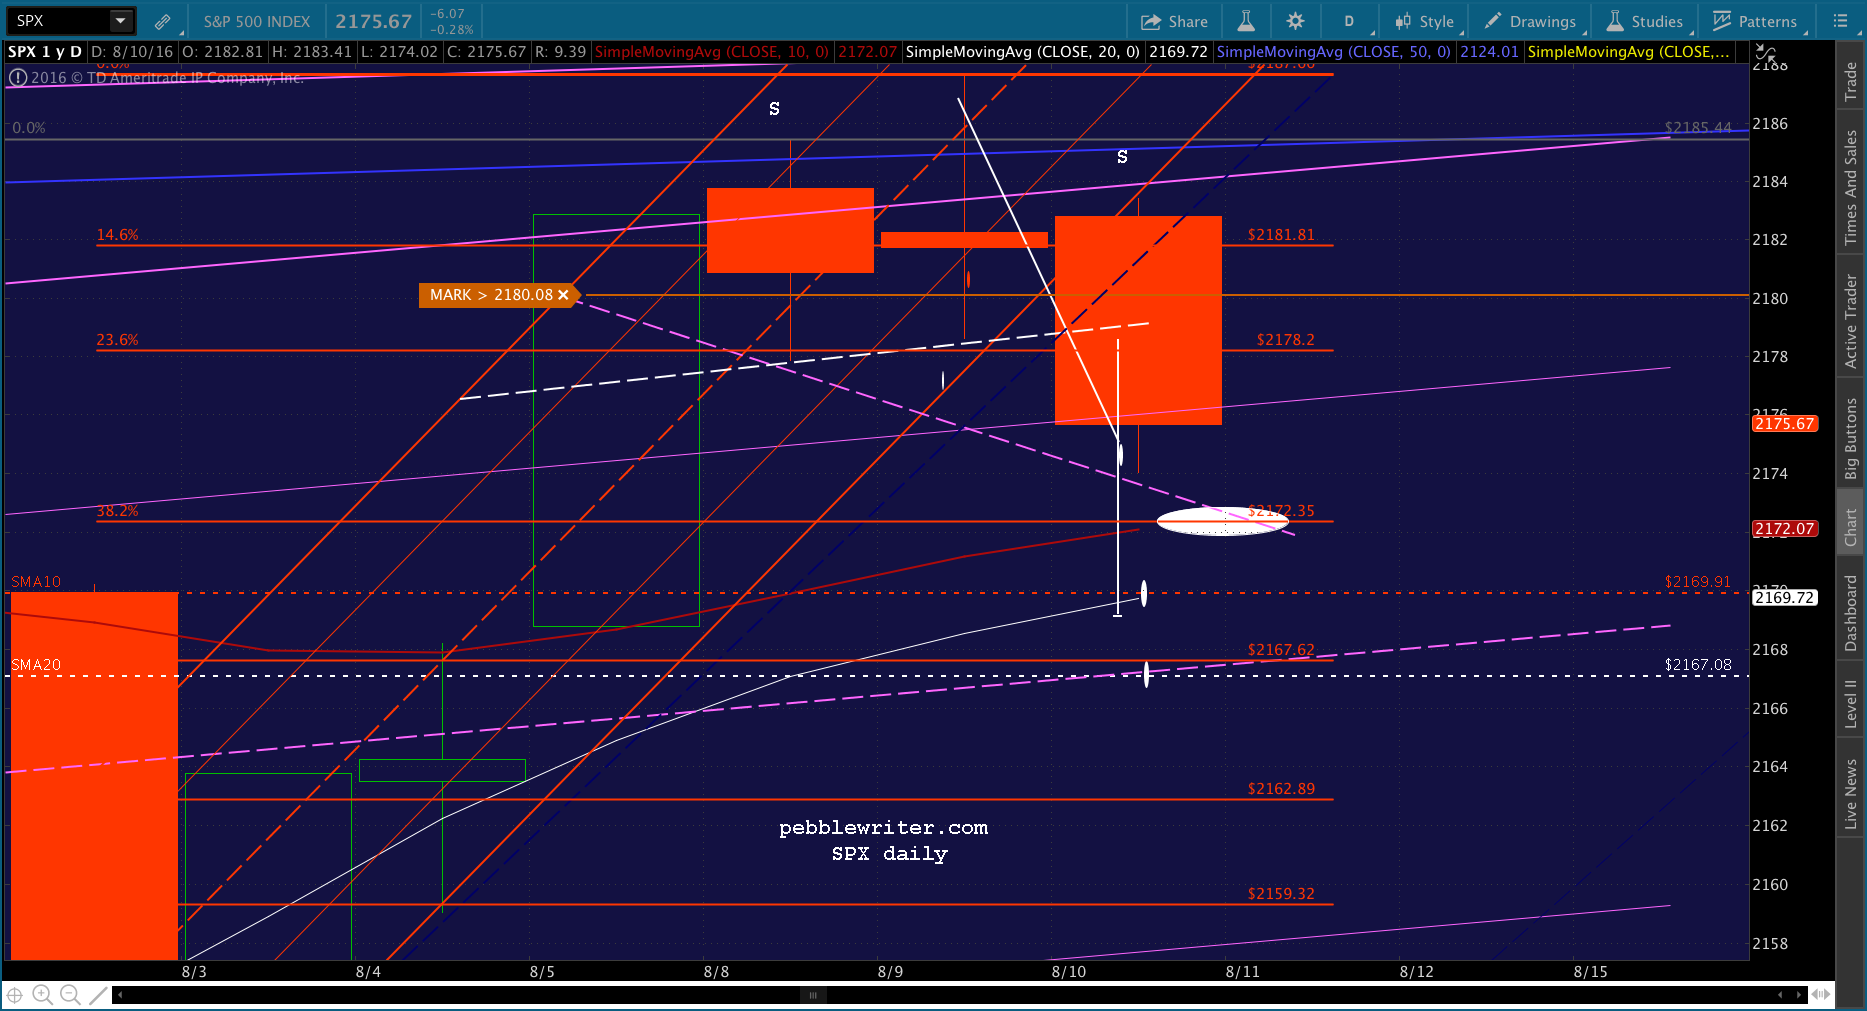
UPDATE: 2:28 PM
CL just broke down and VIX just popped, allowing ES to reach its SMA10 and SPX the next lower target. With 90 minutes left to go, we could get the rest of the decline to the midline here. But, as always, watch out for a bounce. 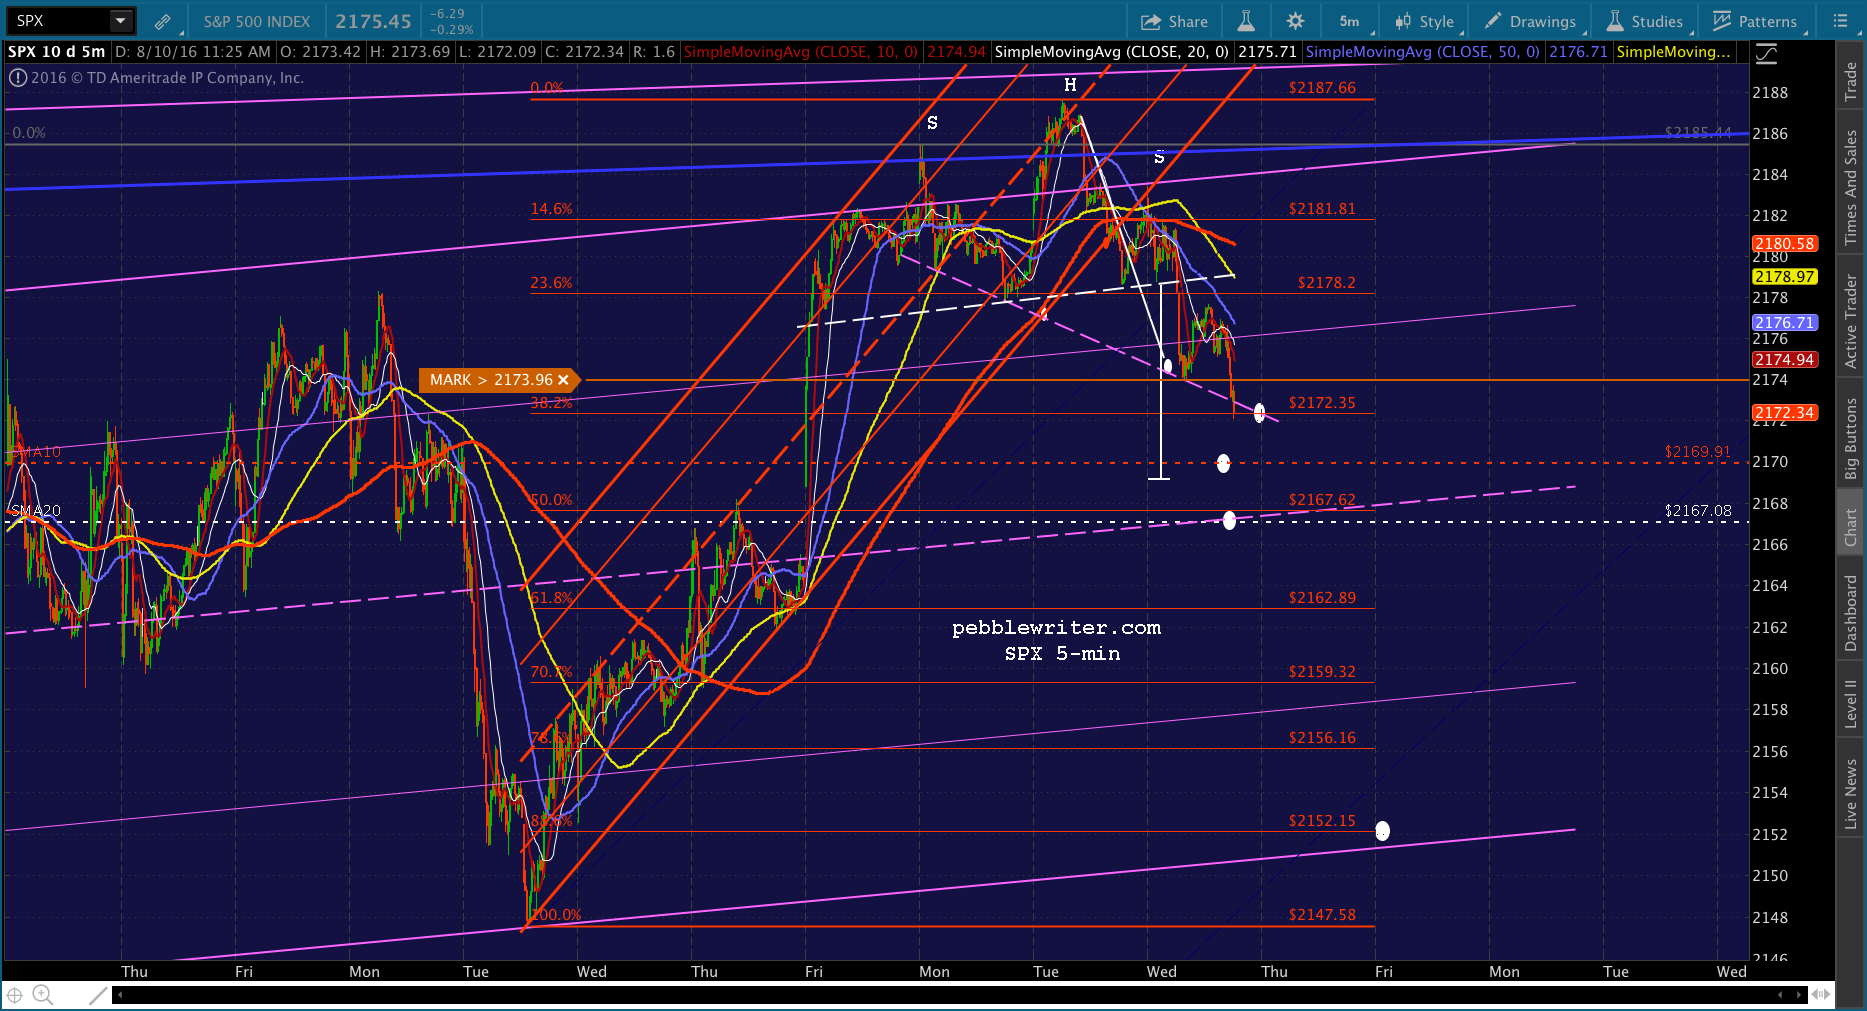
VIX hasn’t quite reached the SMA20, which could provide a little more downside. But, I suspect it’ll react off the SMA10 first, meaning a potential bounce before SPX is done declining.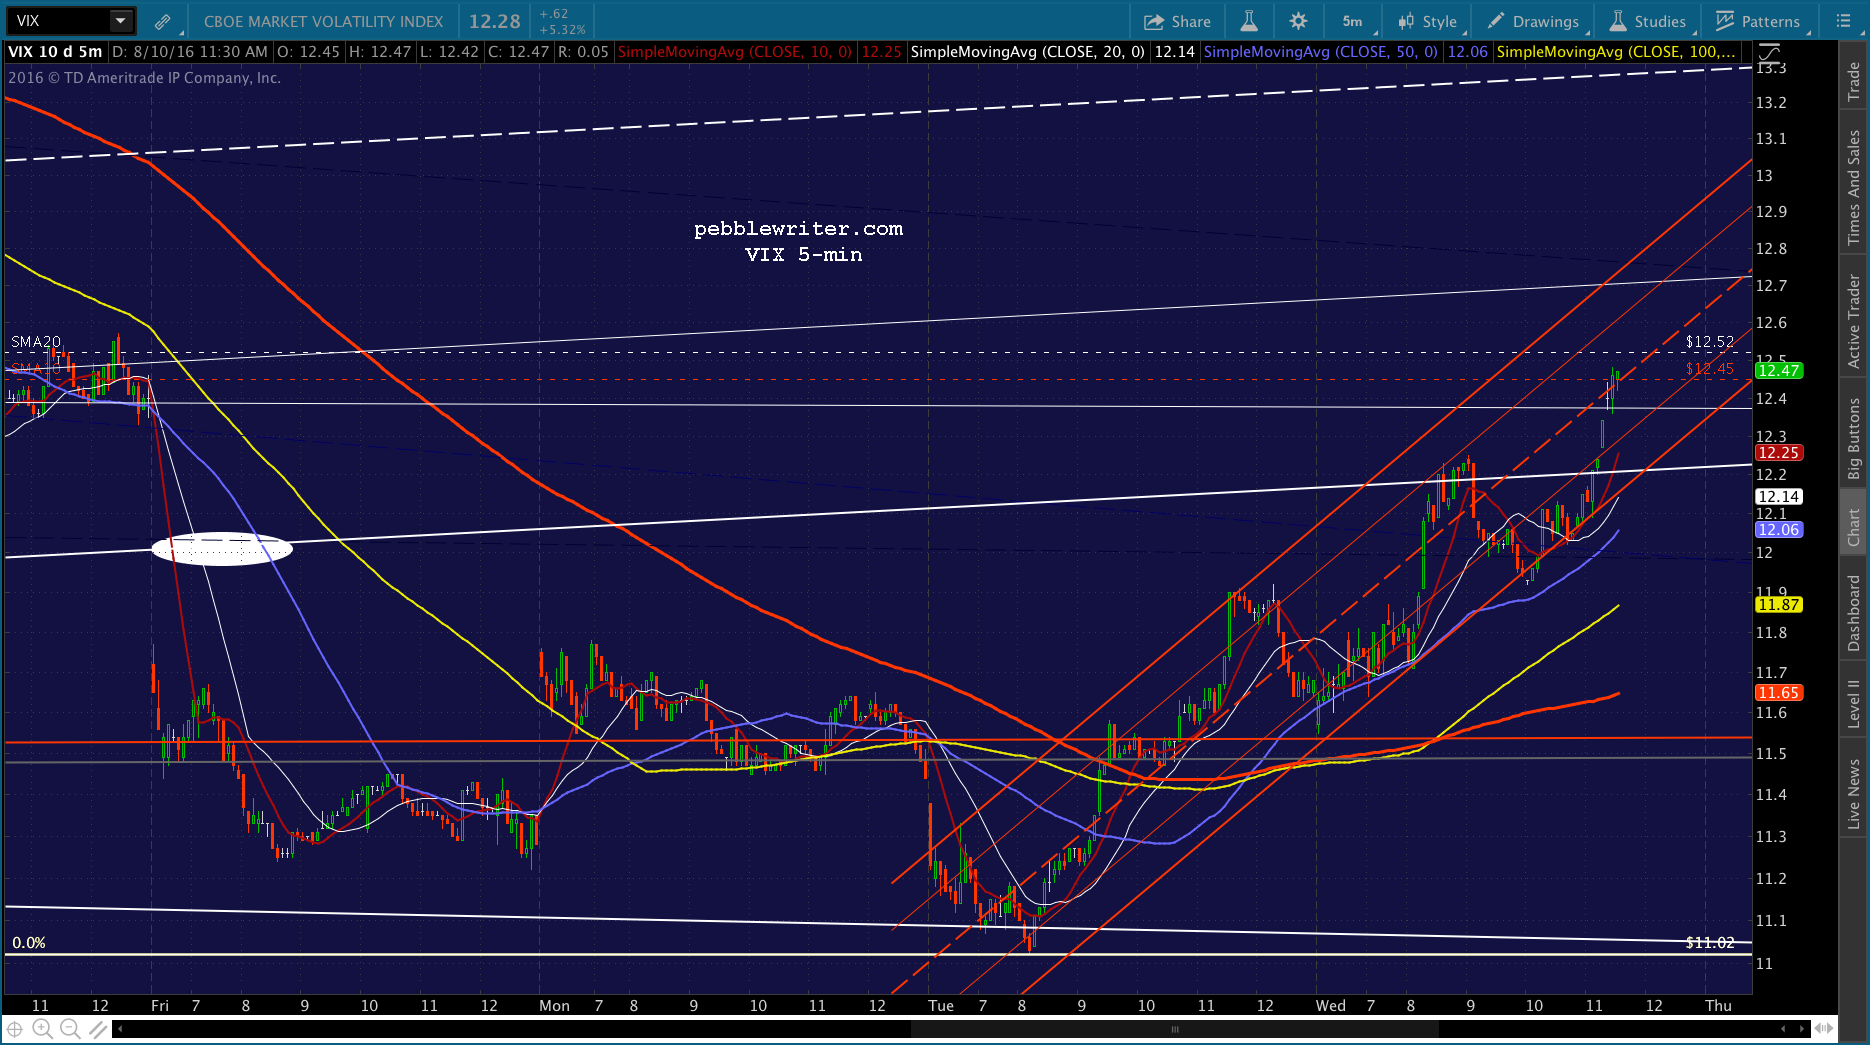 CL has reached its SMA10.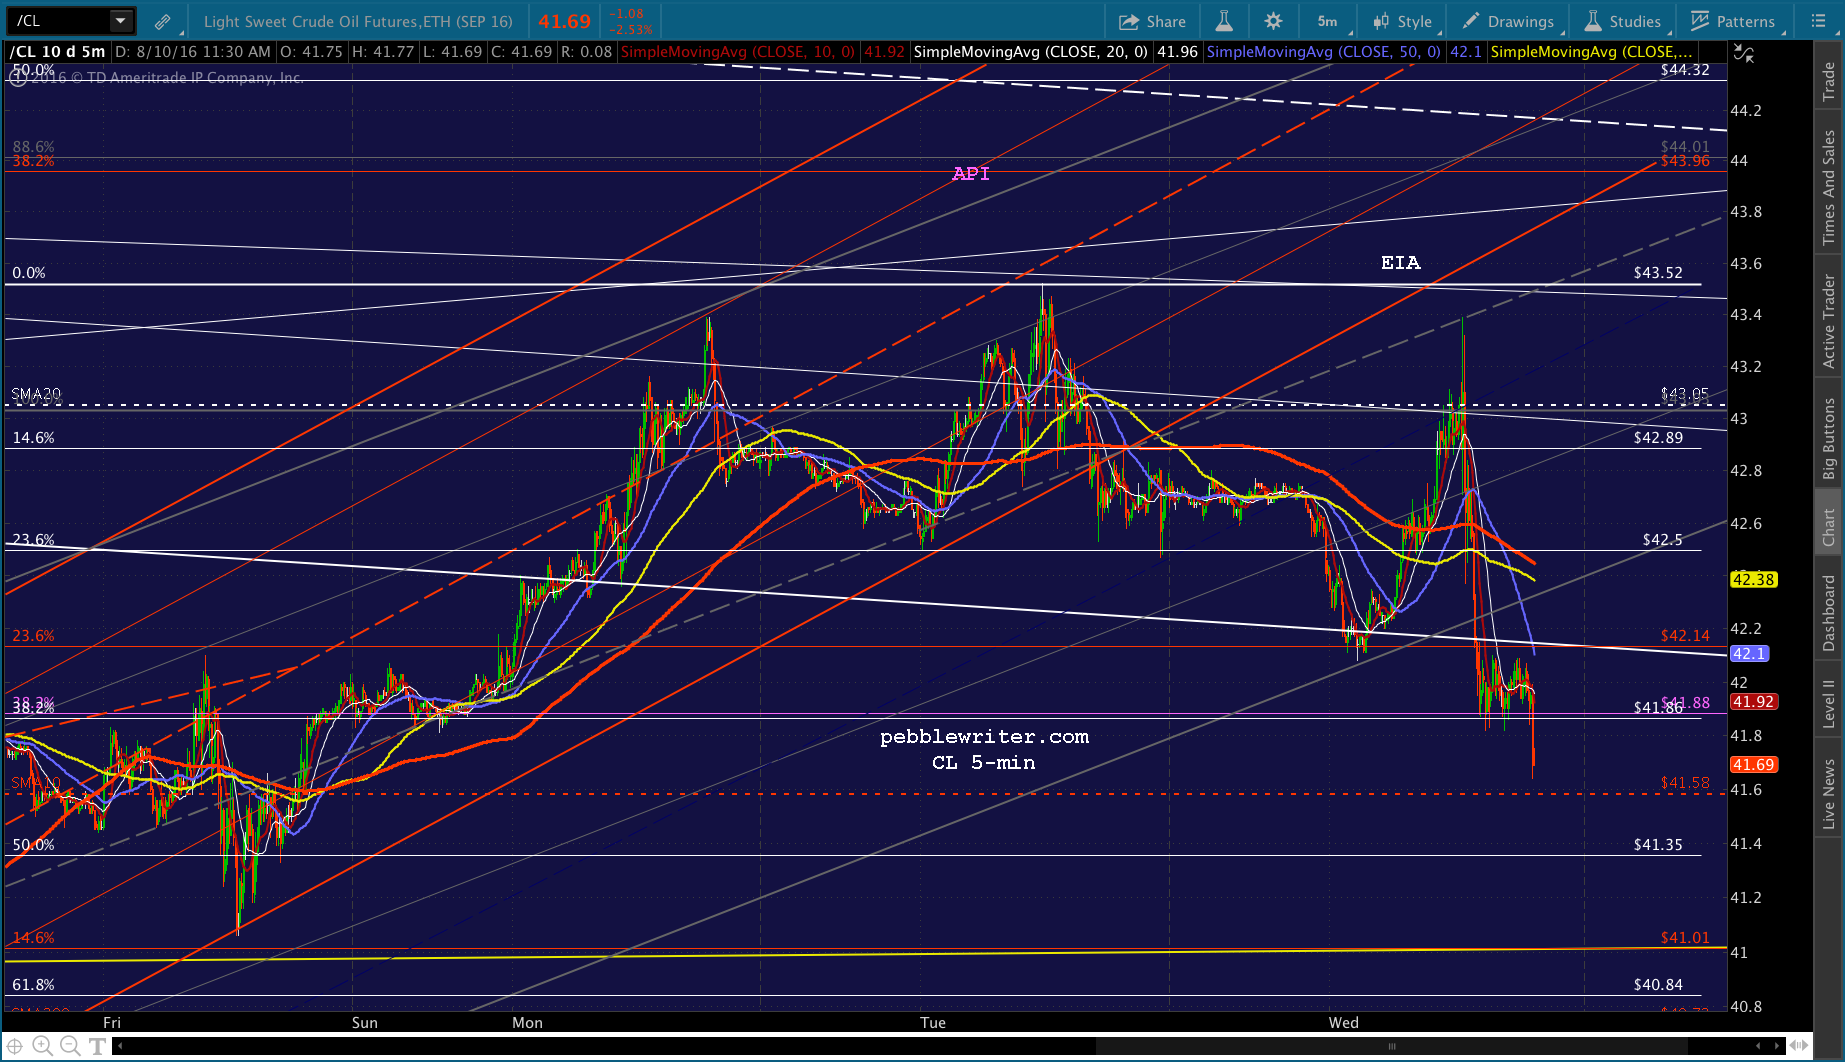
The most telling charts should be CL — what it does relative to the SMA10 at 41.58 — and NKD, which is hinting at breaking down.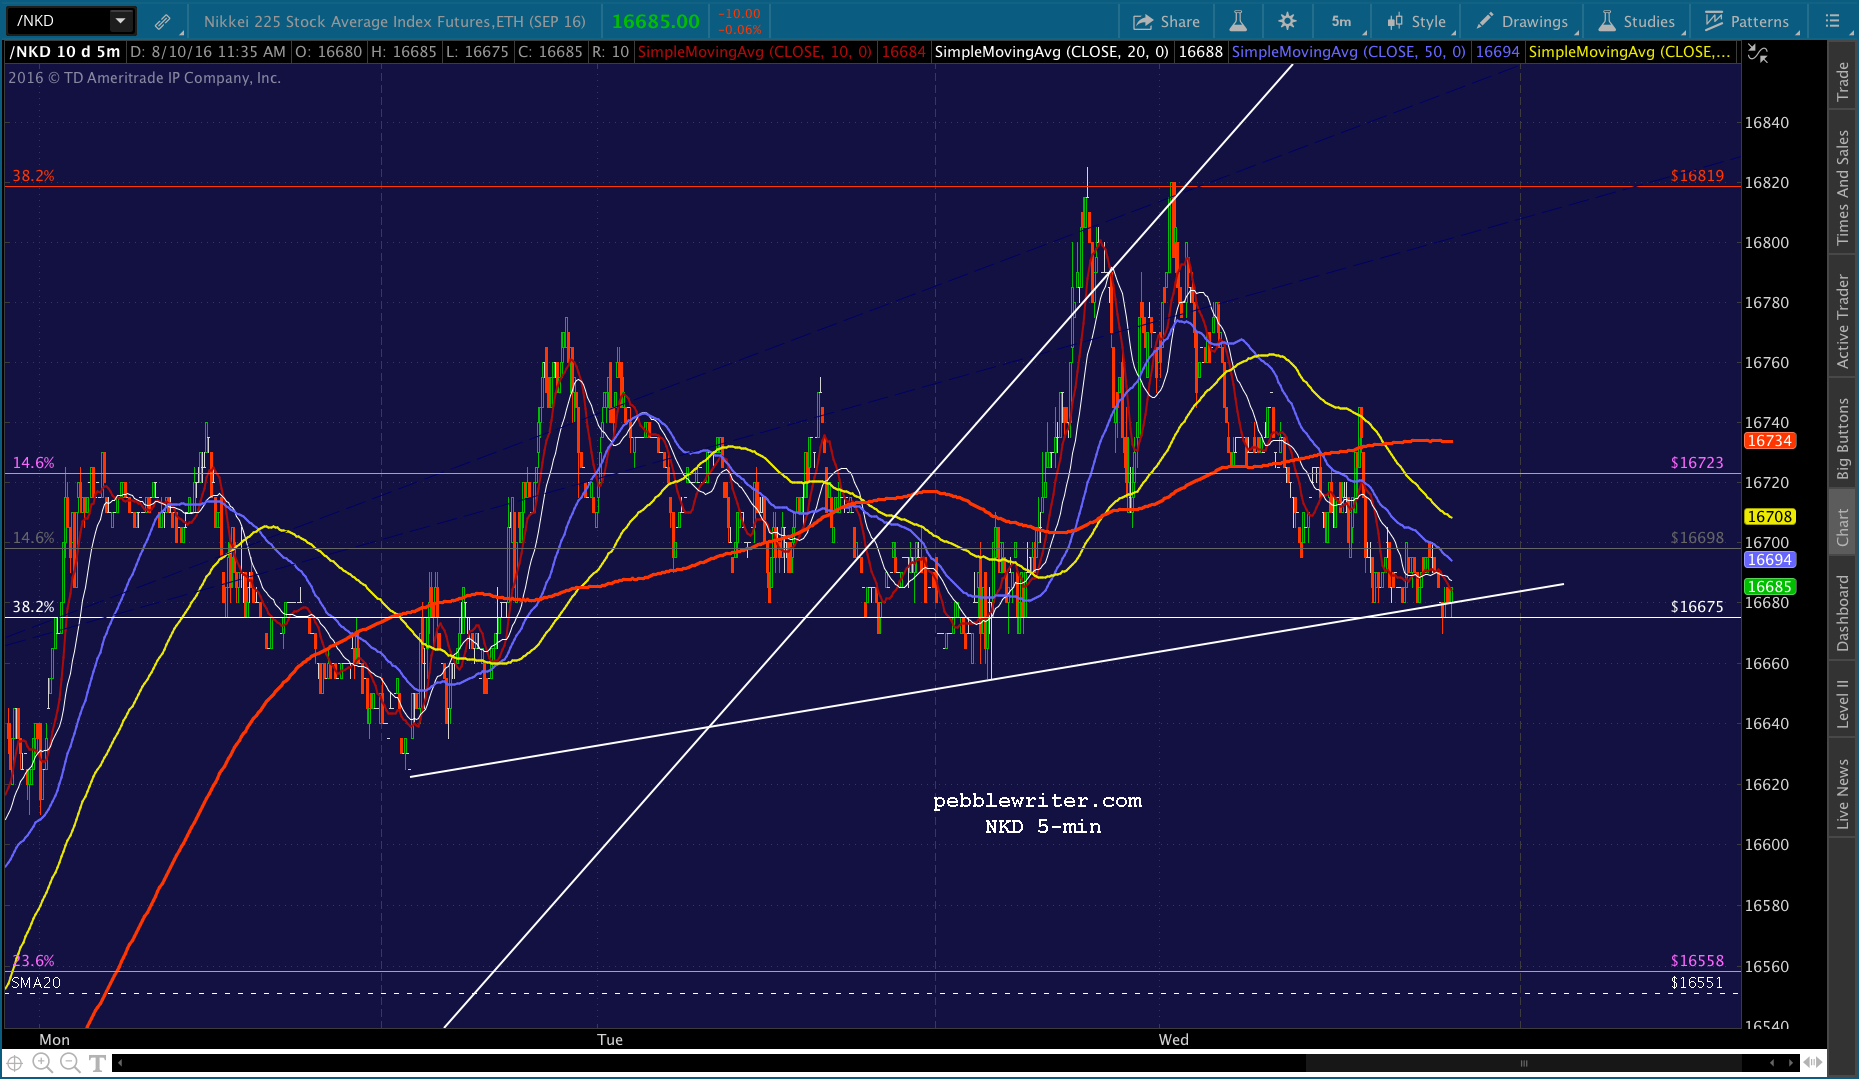
UPDATE: 12:14 PM
CL continues to hold below the SMA10, signaling that SPX might have a shot at tagging its SMA10 at 2169.91 in the last hour. Yet, SPX is pushing up against its SMA5 20 and might have the SMA5 50 in mind. 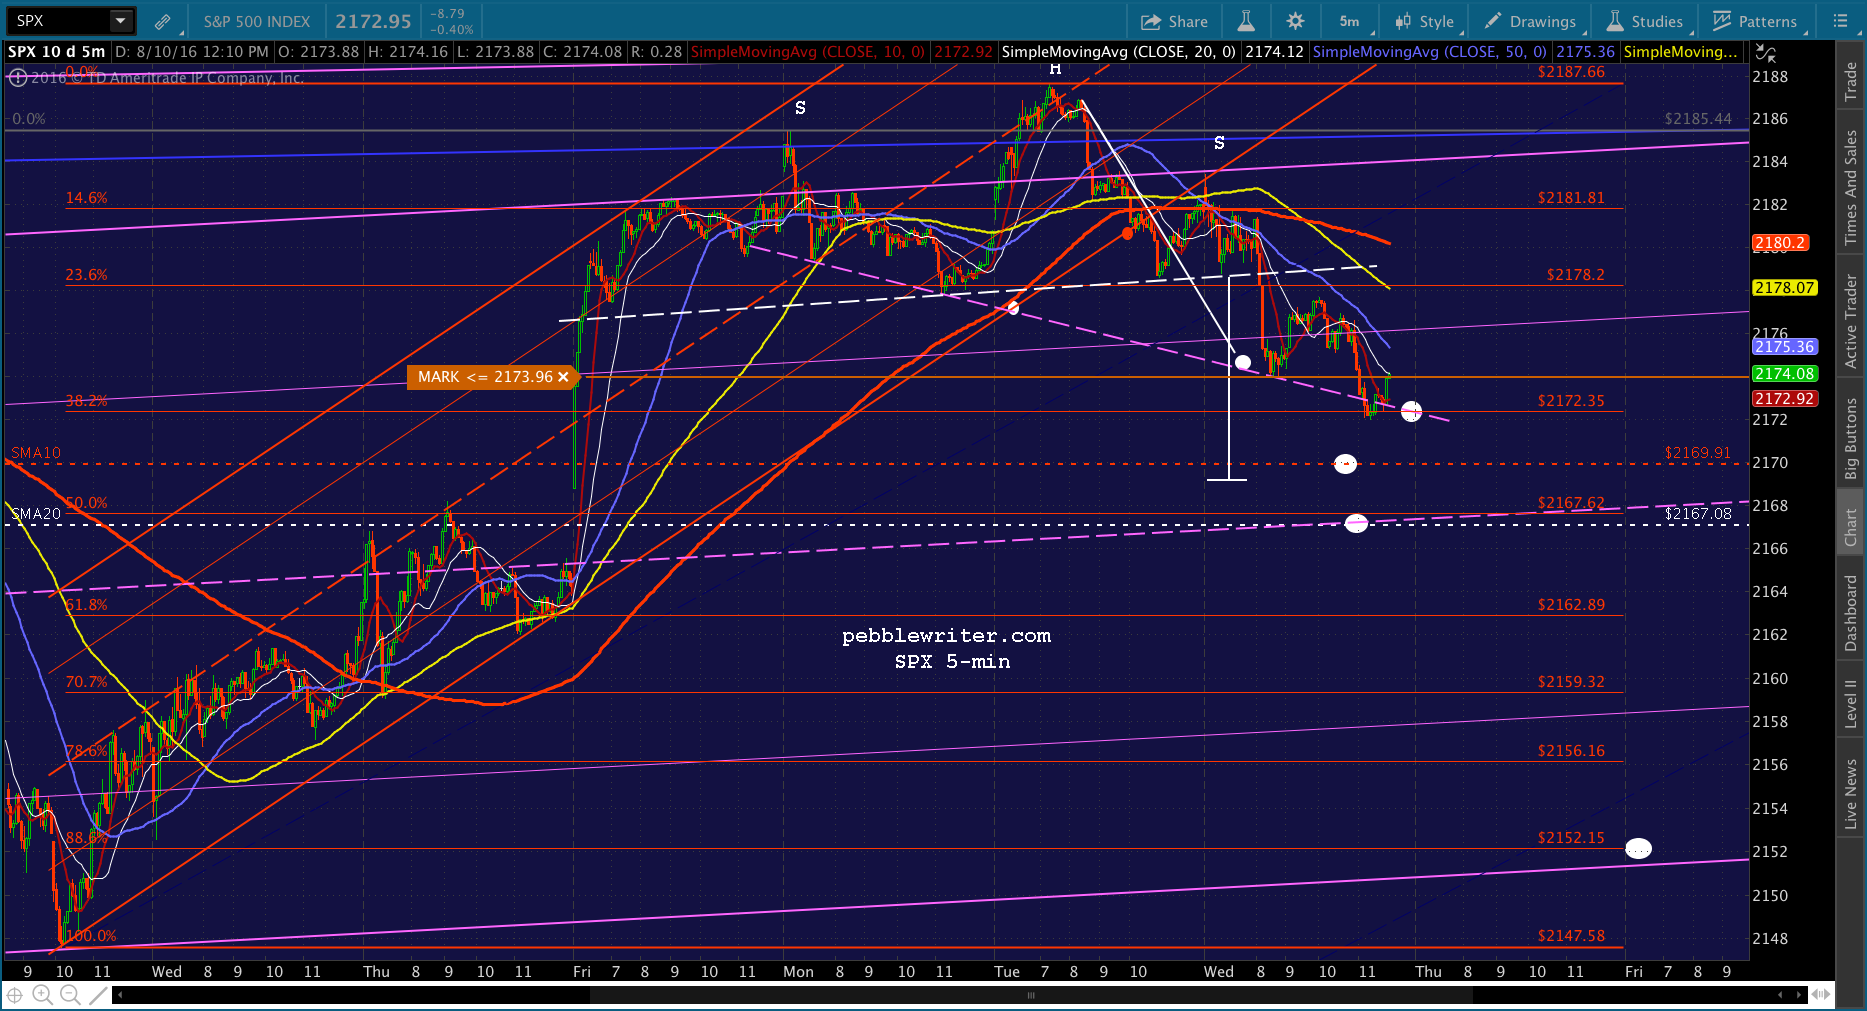
VIX suggests more downside.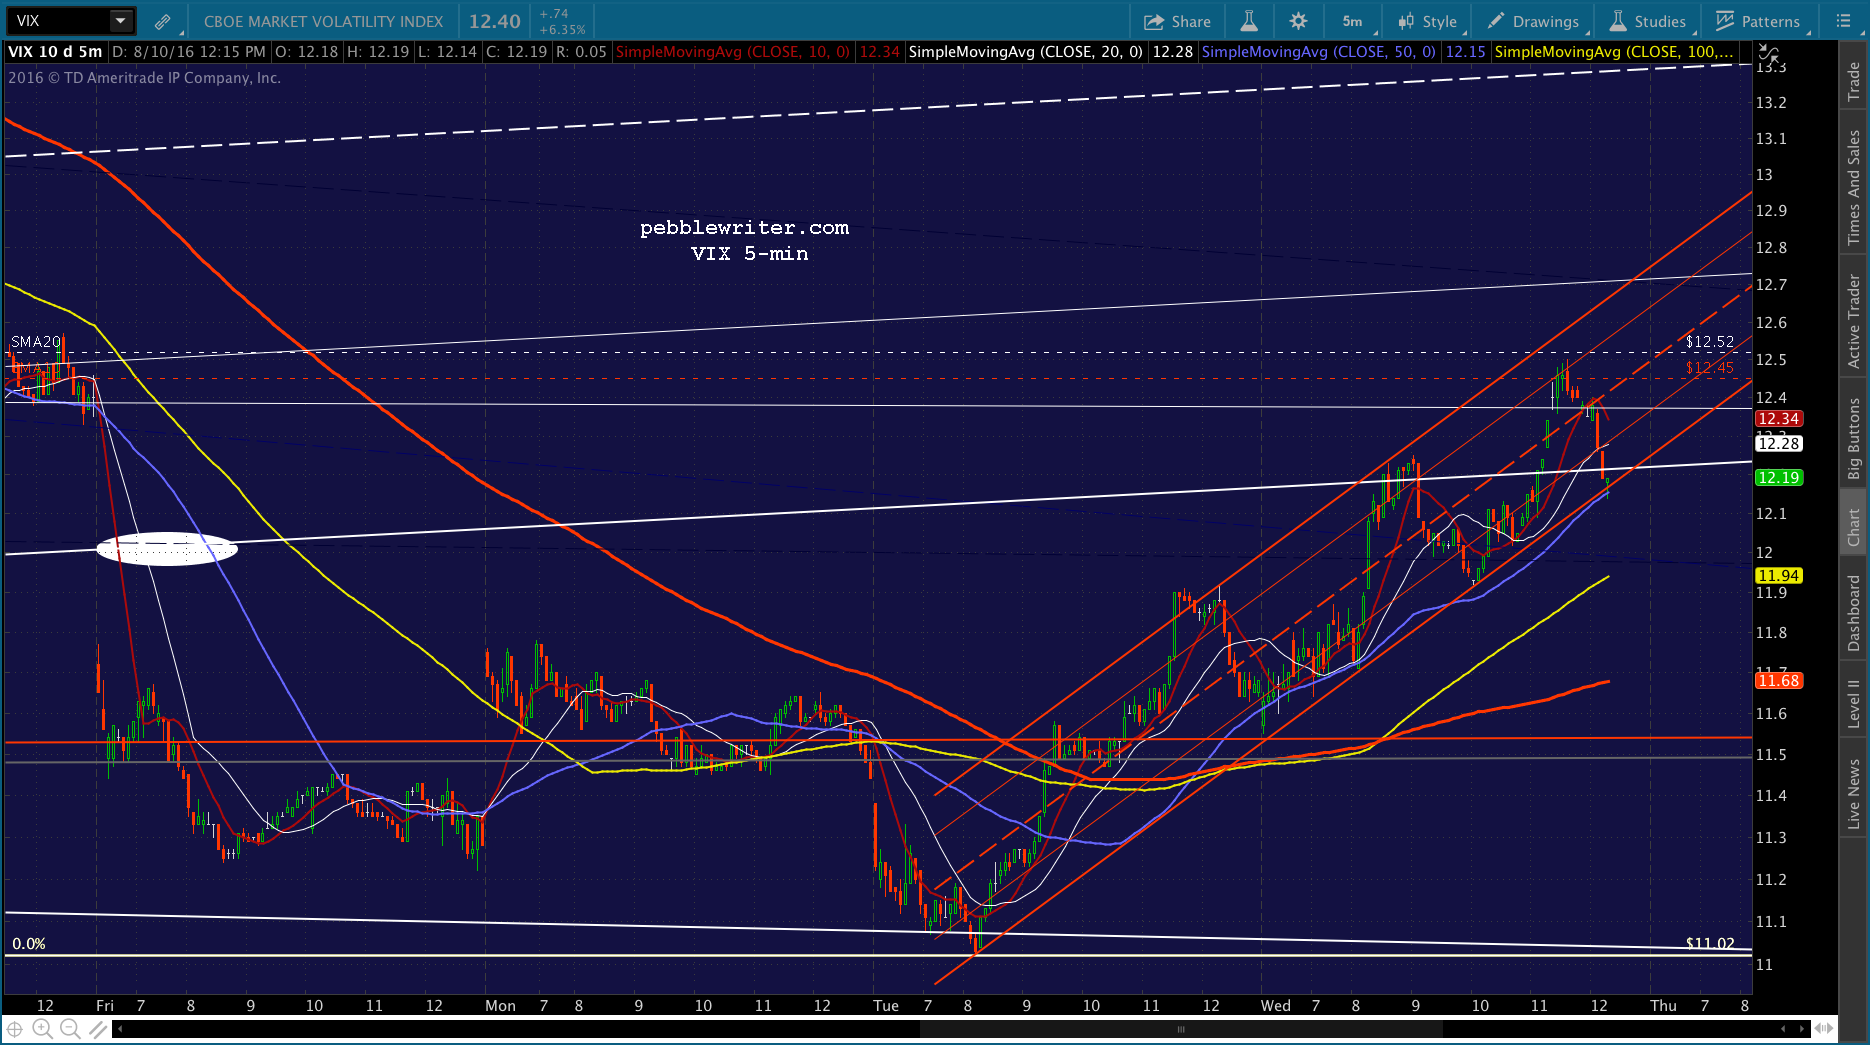
UPDATE: 12:21 PM
Bailing on the short here, but will gladly get back in if it reverses back below the SMA5 50.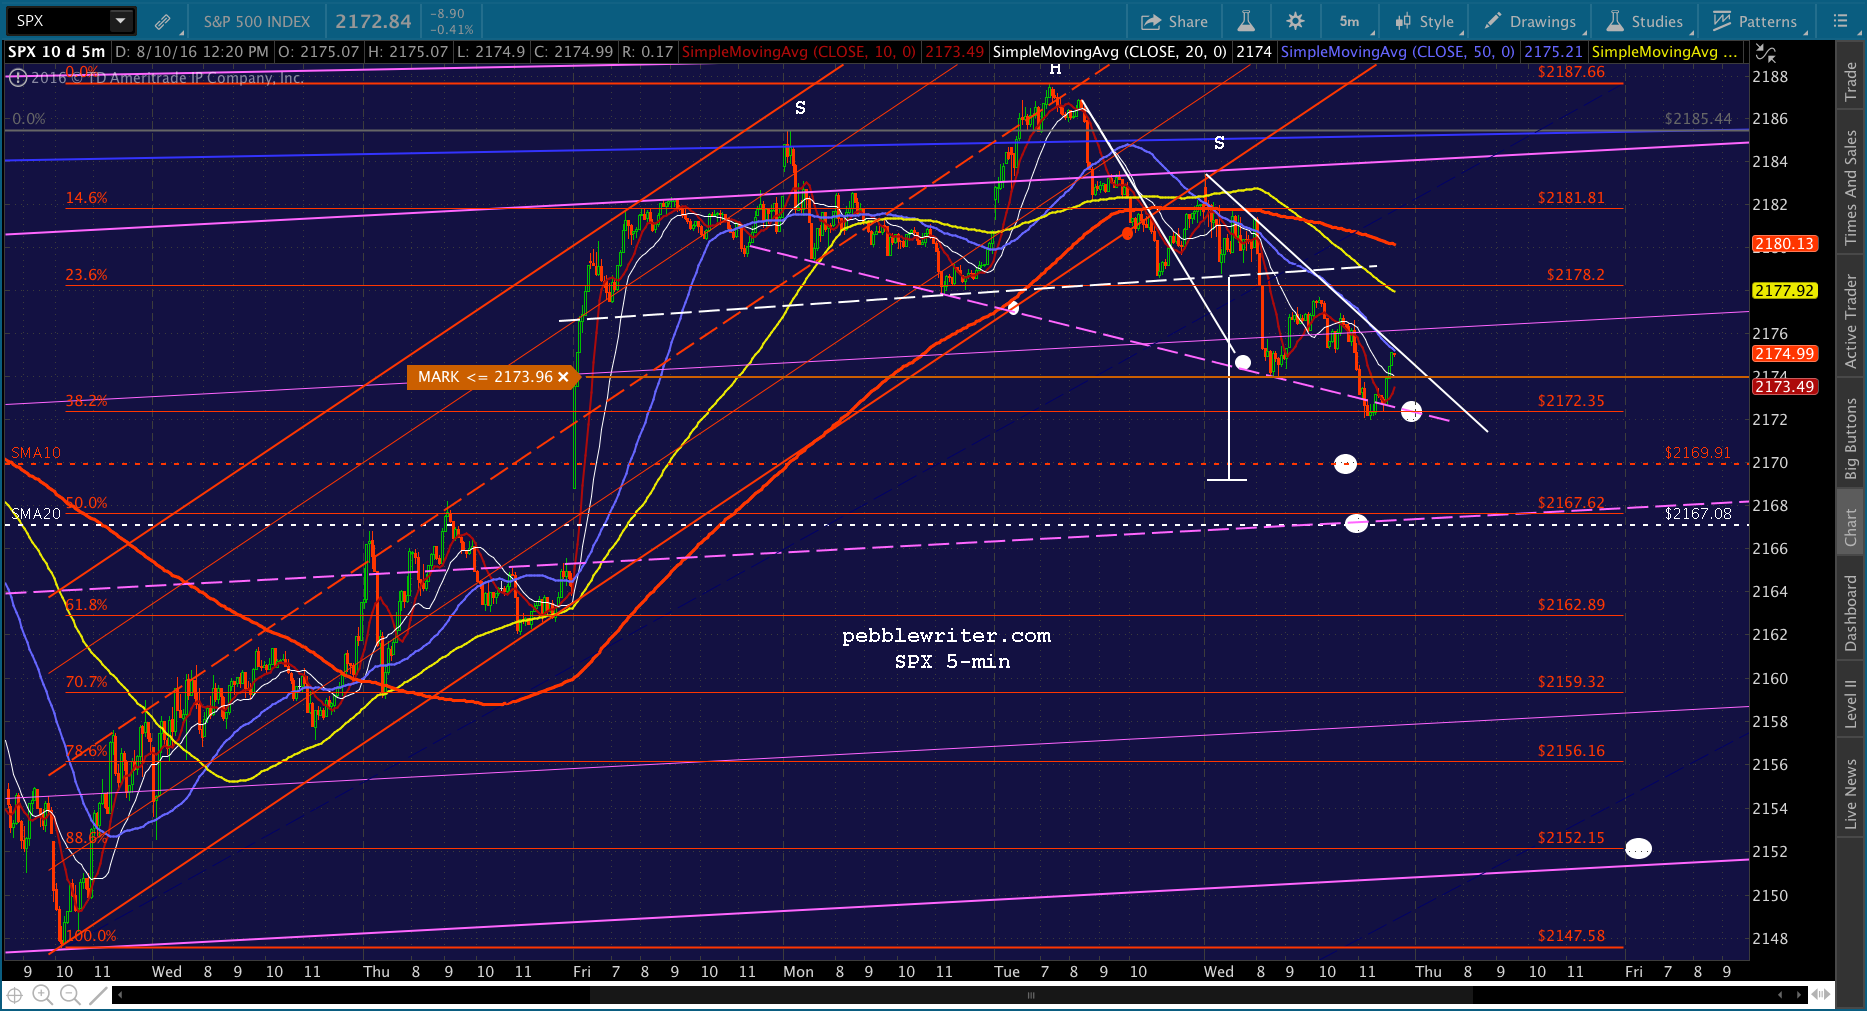
UPDATE: 3:36 PM
I could be way off, but I think SPX will drop back through the SMA5 50 here. Back to short into the close. Either lower prices to come, or a pretty good head fake.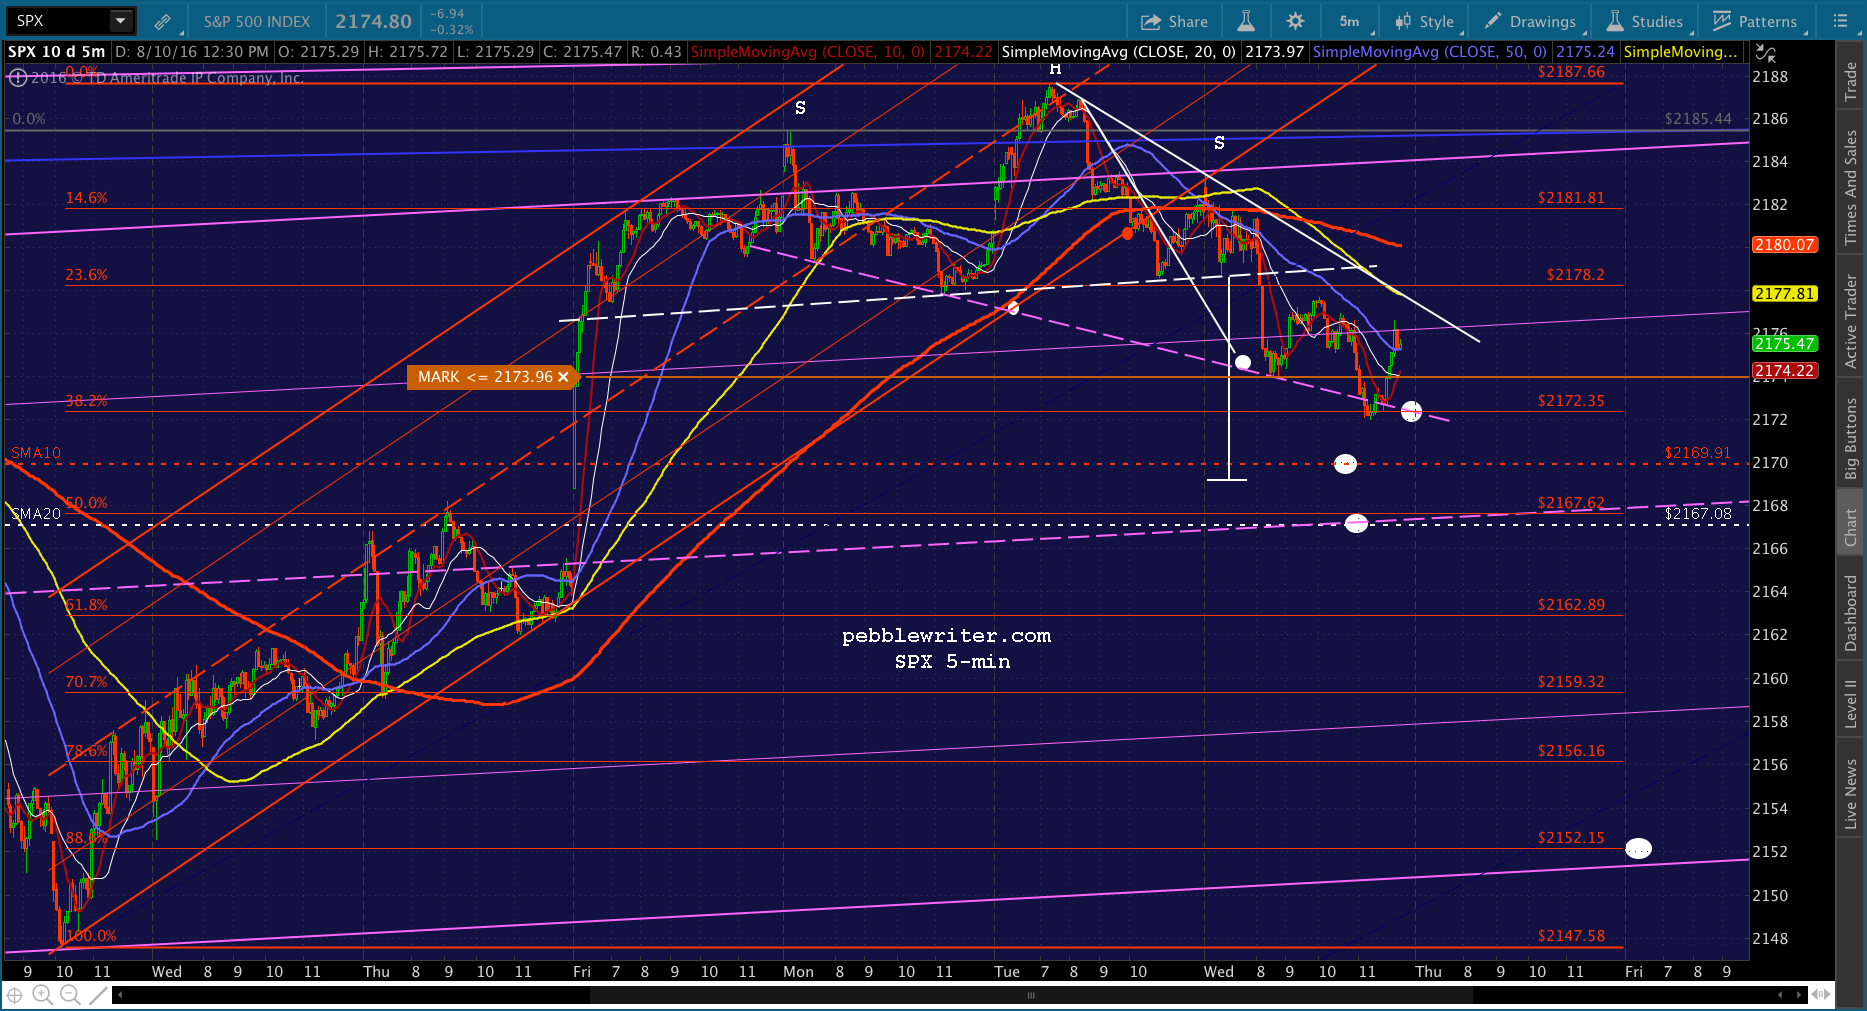
I think VIX is either setting up an alternative channel, shown in purple, or is just backtesting the broken red channel. And, of course, the SMA20 is still sitting up there at 12.52.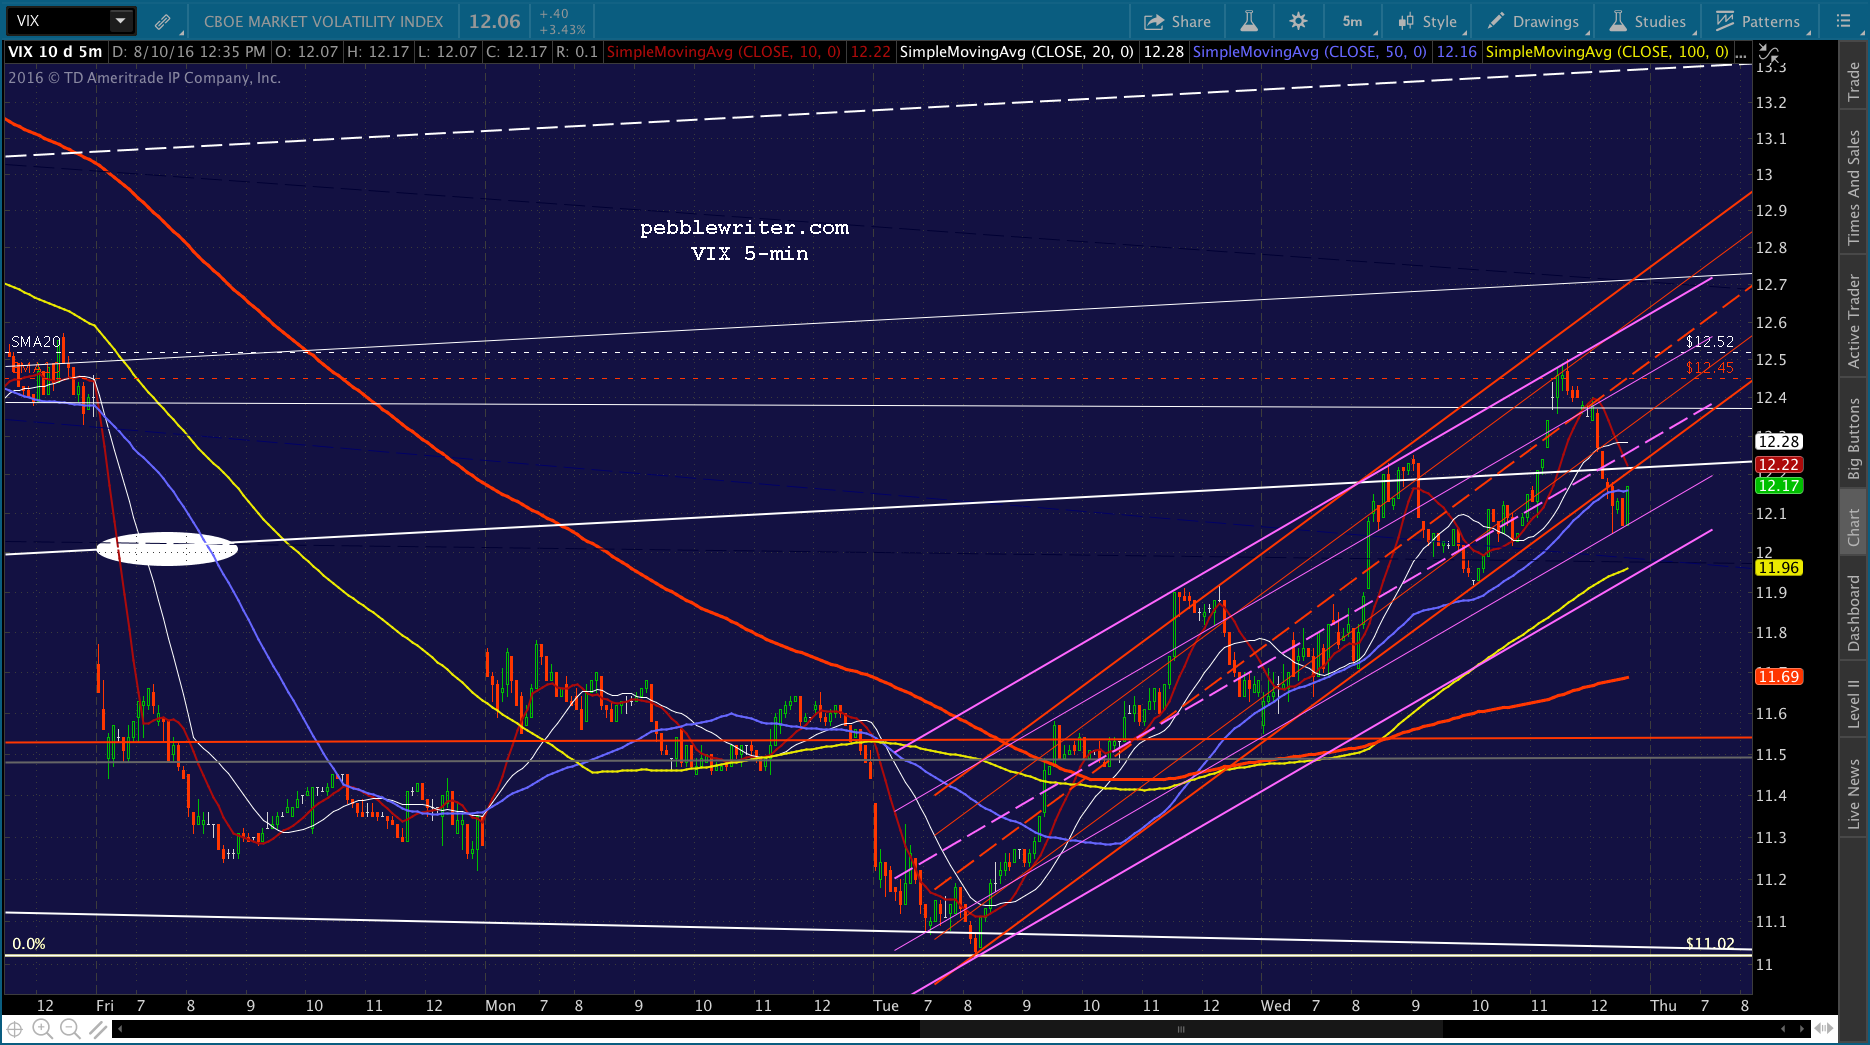 Note that CL is also moving lower.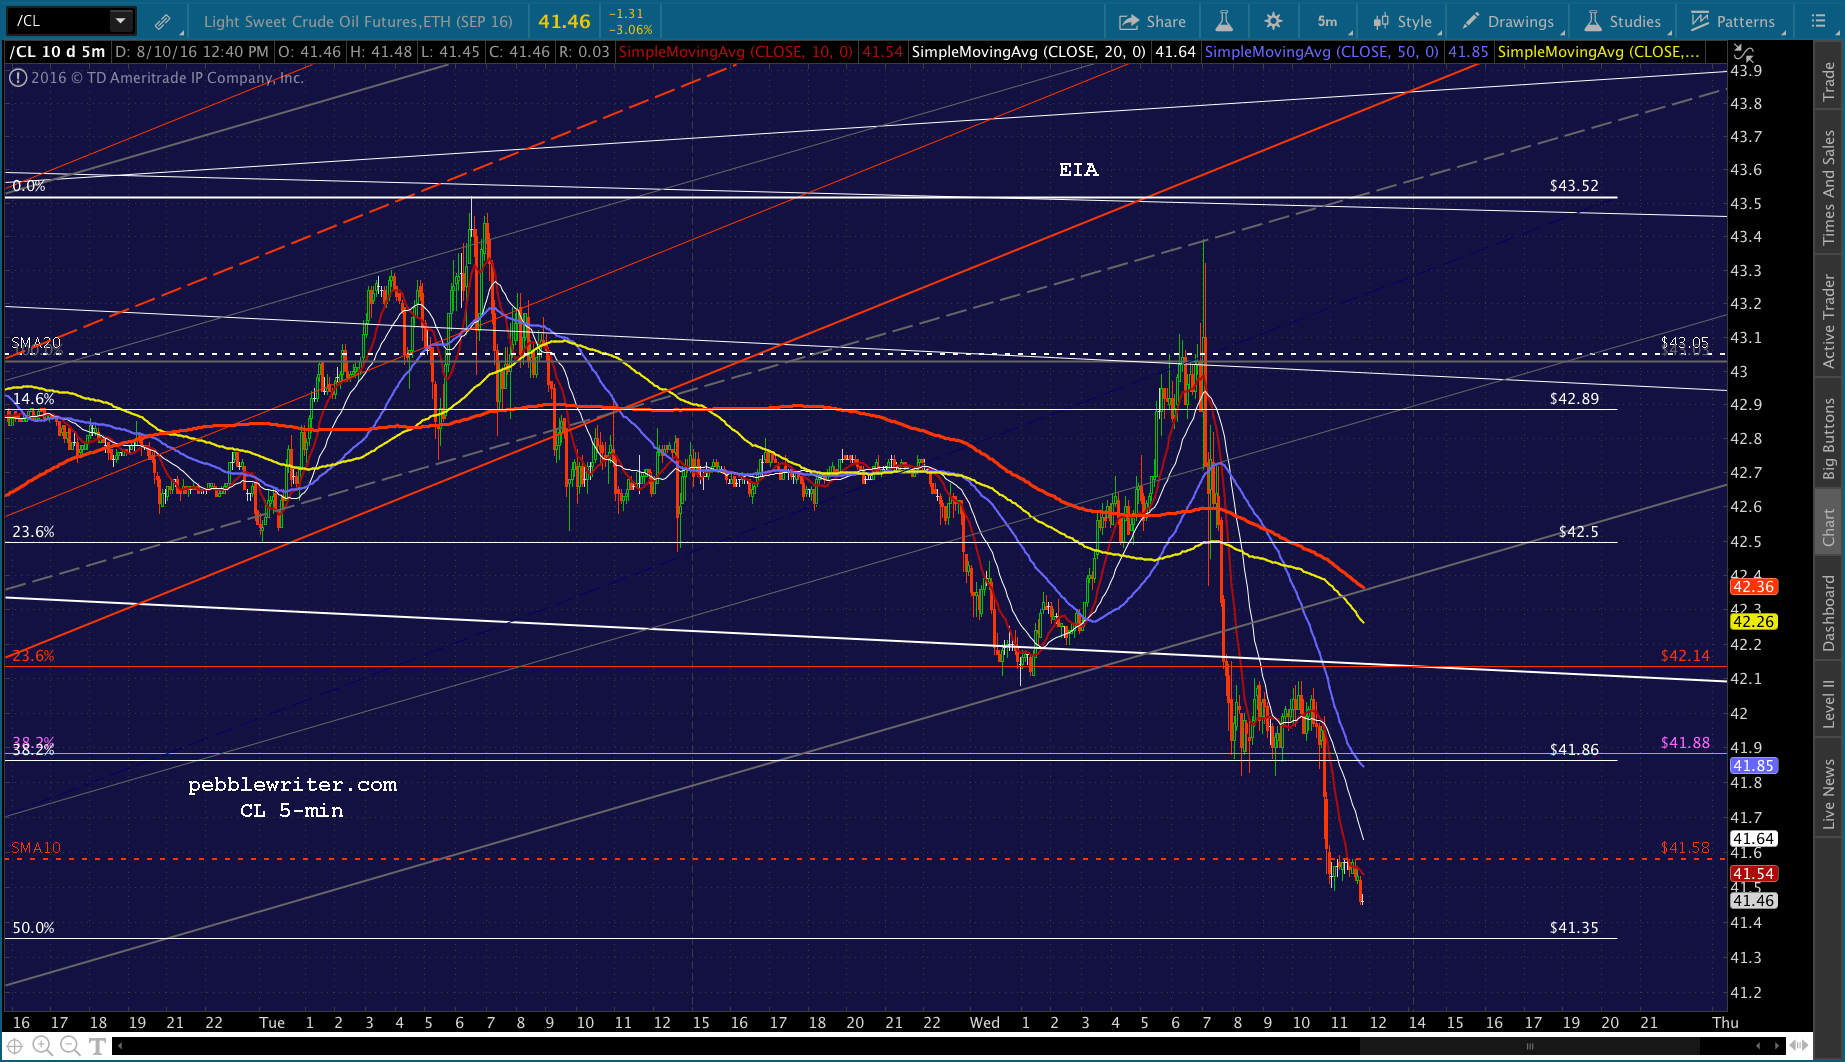
Gotta love the manipulators…put you to sleep with 1 cent moves all day, then a big head fake at the end of the day, only to close it on a bearish note?
Don’t be surprised if we’re once more put in a position to make an overnight bet. The SMA10 should end up around 2171 tomorrow, so I’m still looking for the rest of the move before the close or in the morning. I don’t think they brought it all the way down here just to miss the mark.
Comments
One response to “Backtests”
Out with profits! I’m starting to like you Pebbles.