LAST NOTE (MAYBE):
Couldn’t help noticing all the registration notices floating past on TOS Live News just now. For some reason, insiders don’t seem all that bullish on their own stocks…

Lots of talk about the McClellan Oscillator (MCO) today. For anyone interested, here are the relevant points:

Note that we’re in good shape in terms of a suitable place to take a little plunge.
ADDITIONAL NOTE:
Obviously we’re extending both time-wise and price-wise compared to 2007/8. The price aspect makes sense, this being P3 and all.
The time aspect is a little thornier. I take it to mean there is more second-guessing as to what’s going on. After all, we’ve been here before. There is a huge amount of disbelief/denial that we’re going through it all over again.
It’s been 17 trading days since the 1346 interim high on 7/22 (the equivalent 2007 date was 12/26.) Back then, it took 18 days for the market to hit bottom. If the pattern continues to take a “little longer” than in 2007, we should expect wave 5 to play out sometime this week, possibly even tomorrow.
If, thanks to OPEX, it doesn’t happen till early next week — that’s okay, too. I won’t start freaking out unless we bump up past 1258 without reaching a new low first.
As far as targets go, I’m hoping for but not counting on a huge downdraft. This could all be over as high as 1070. The rally, probably the result of a Jackson Hole pronouncement, should be pretty quick. If it follows the 2008 pattern, it would take us back most of the way to 1258 within 7-10 trading days.
ORIGINAL POST:
Setting aside the economy for the moment, how do we look relative to 2007-2008? I’ll focus on three key price moves.

(1) The first major move down off the top. Here, the time was almost identical, but 2007 was the greater percentage move by a substantial margin.
2007 2011
10/11 – 11/26/07 5/2 – 6/16/07
31 TD 32 TD
1576 – 1406 (10.8%) 1370 – 1258 (8.2%)
(2) The corrective wave back to the interim high. The 2011 move took several days longer, even though the percentage move wasn’t as great.
2007 2011
11/26 – 12/11/07 6/16 – 7/7/11
11 TD 14 TD
1406 – 1524 (8.4%) 1258 – 1356 (7.8%)
(3) The initial collapse. This is the 28th day since the 1356 high, which is the amount of time it took to reach the 2007 low. And, the percentage move has been significantly greater. But, it appears to be unfinished relative to 2007. That is, there’s no discernible 5th and final wave yet.
2007 2011
12/11/07 – 1/23/08 7/7 – ???
28 TD 28 TD ?
1523 – 1270 (16.6%) 1356 – 1101 (18.8%)
If the pattern holds, it seems to me the final wave down should begin right away. There are plenty of potential catalysts, as PPI, CPI, initial claims and existing home sales all report in the next two days. In addition, there could very well be additional follow-through from today’s action in the Euro-zone markets.

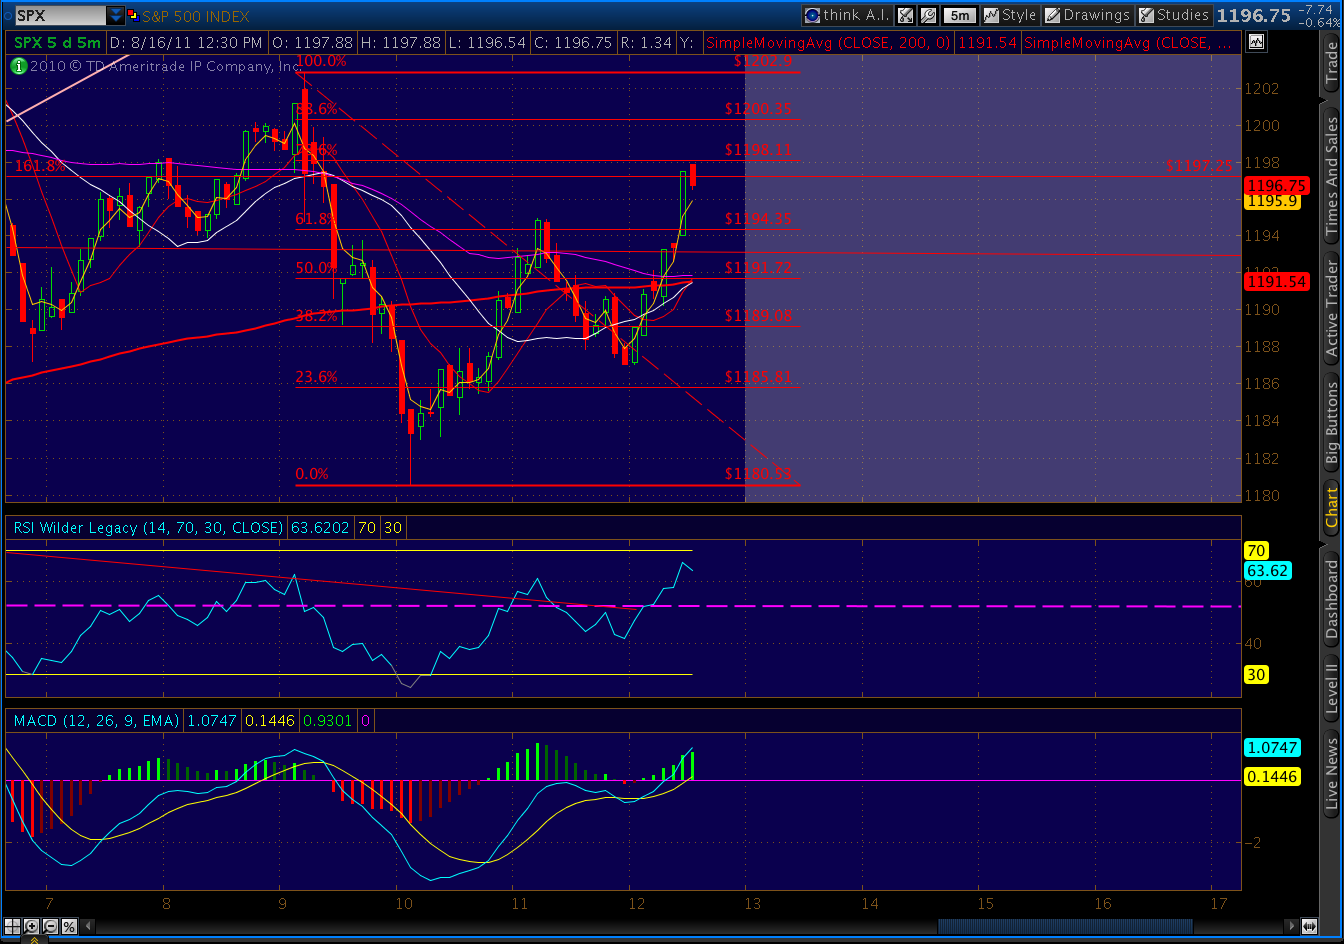
The SPX chart appears to be trending bearish again, as this past week’s rally seems played out. We had a good start with the breakdown and backtest of the rising wedge and two intra-day bearish Gartley patterns. In any case, we’re no longer oversold.

If we can resume the downdraft by tomorrow, my initial target is 1070.