Author: pebblewriter

  • Why Are Stocks Rising?

    Ever wonder why the S&P 500 keeps rising, even though there’s so much crummy stuff going on in the US economy and the world in general?  Ever wonder how the market can shrug off crappy retail sales, lousy earnings, or a plunging NASDAQ?  It’s as though those things don’t even matter, right?  The truth is, they don’t.  I’ll explain.

    Leading up to and since USDJPY topped out on Jan 2, I’ve written extensively about the impact the reversal should have on stocks.  In short, every time the pair has backed off of the trend line that connects latest top to the 1998, 2002 and 2007 ones, stocks have dropped anywhere from 22 – 57%.

    2014-05-09 USDJPY v SPX 0757

    This time, it hasn’t — at least not yet.  The moving averages are bearish.  The channels are mostly bearish.  The harmonics are bearish.  But, the yen is still being aggressively trashed by the Bank of Japan in an effort to increase Japanese exports (a cheaper yen makes Accords more affordable in the US.)

    Without devolving into a lengthy discussion of whether or not Abenomics will ultimately work (it won’t), suffice it to say that it’s doing a great job of maintaining the bull market for US equities.  Meet the yen carry trade.

    In the good old days, a carry trade involved borrowing at a low interest rate and re-investing at a higher rate.  It could be done in different currencies, as long as the currency in which one borrows depreciates or at least doesn’t appreciate relative to the one in which one invests.

    So, one could borrow in yen at 0% and reinvest in US dollar denominated paper at 0.25% (or Brazil, Iceland, etc at much higher rates) and have no risk as long as the yen doesn’t appreciate against the dollar.  Done in enough volume, this is essentially a risk-free way to print a lot of money.  And, thanks to the BOJ trashing the value of the yen, there was no risk for a long time.

    But, why reinvest the proceeds in overnight paper at .25% when stocks are gaining over 50% per annum as did the Nikkei?  Money flowed into the Japanese stock market — as well as those in Singapore, Hong Kong, Philippine, Indonesia, Korea, etc.  The BOJ even buys ETF’s of Japanese stocks directly, just in case the market isn’t stimulated enough by $80 billion per month of quantitative easing.

    2014-05-13-NKD daily

    Only problem…it stopped working. The Nikkei stalled out when the USDJPY did and fell by over 15% — hardly a risk-free proposition.  If only there were a stock market whose prices were guaranteed by a central bank to never decline…. oh, wait!  How about these guys!?


    "I promise to never allow the market go down!"
                             “I pledge to never allow the market to decline!”

    It’s a marriage made in heaven.  Between the BOJ and the Fed, there’s plenty of 0% money for the asking — especially if you’re a TBTF bank with Janet Yellen on speed dial.

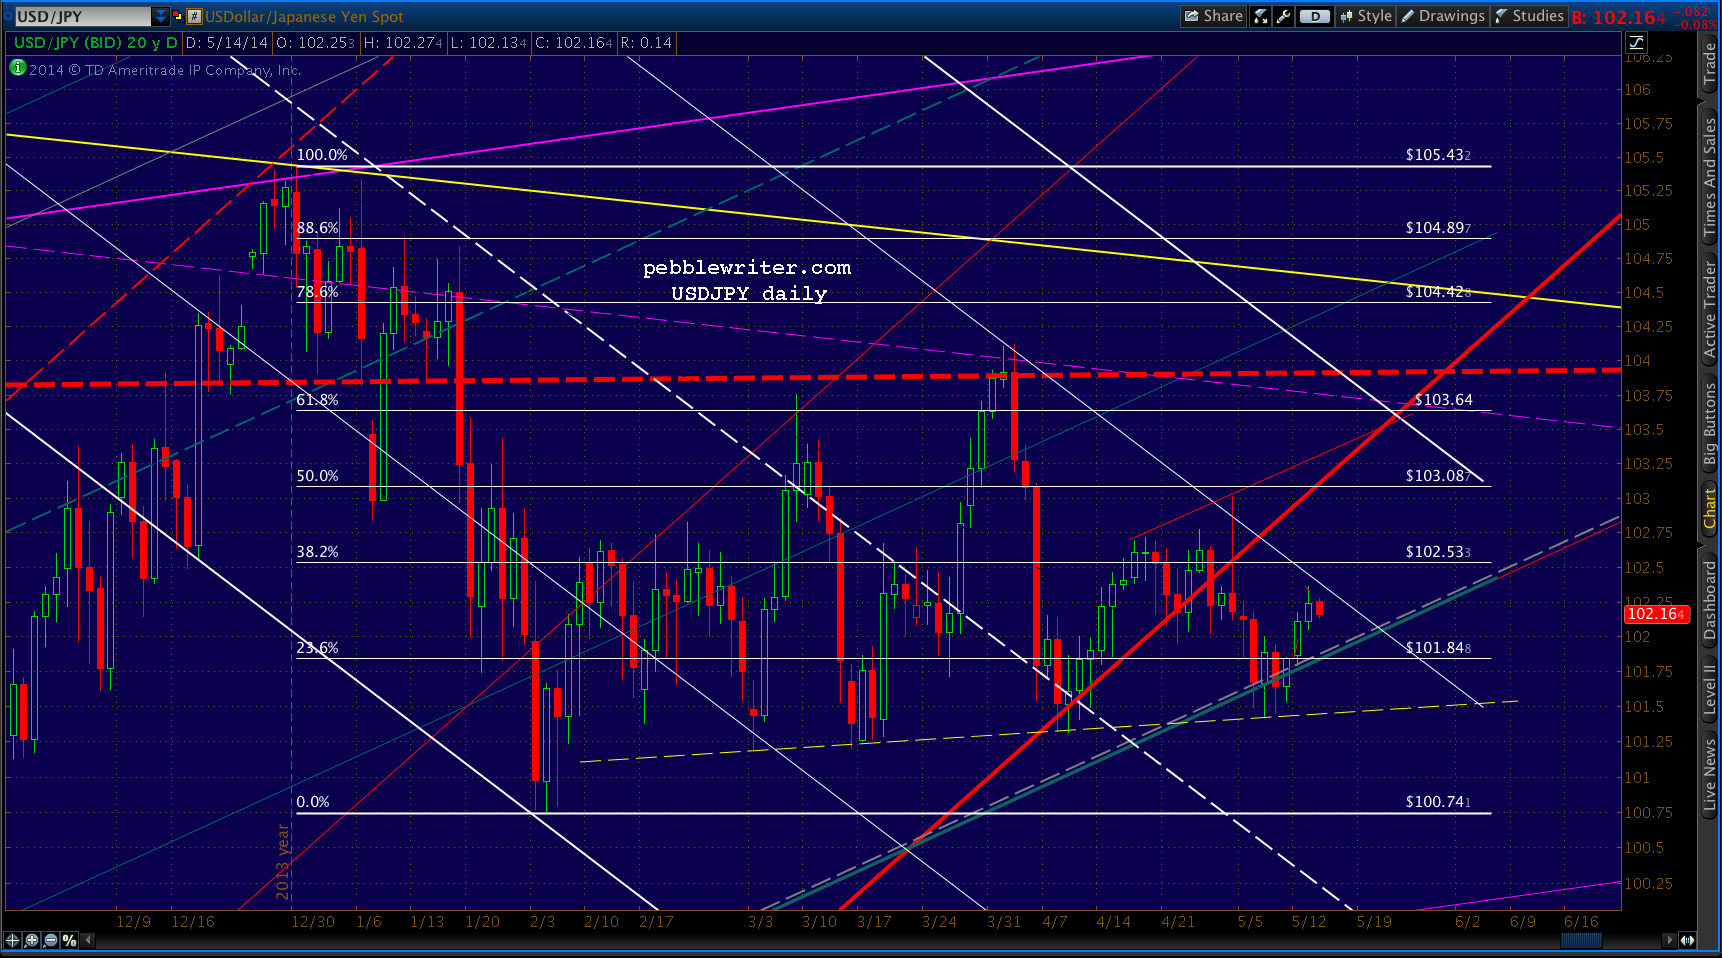
    The process is pretty simple.  When the yen declines (meaning the USDJPY rises), it’s stock-buying time.  In other words, a rising USDJPY means a rising ES/SPX.  Of course, USDJPY can’t go up all the time.  In fact, it fell from 105.43 to 100.74 between Jan 2 and Feb 3.  It bounced there, and has since chewed up a lot of real estate, see-sawing back and forth for 3 1/2 months just like NKD (same neckline and unfulfilled H&S Patterns.)

    2014-05-13-USDJPY daily

    Remember, they’re both being propped up by the BOJ — and, not that namby pamby wink-and-a-nod propping up like the Fed.  We’re talking outright manipulation whenever and wherever they feel like it.  Gazing at that dashed yellow neckline (just like NKD’s), it’s pretty easy to tell when they felt like it.  And, if they’re ever asleep on the job, the bankers benefiting from the trade are only too happy to jump in and “stabilize” things.

    I know what you’re thinking…if USDJPY see-saws back and forth, why doesn’t it unwind all the benefits of its rallies every time it declines?  I’m glad you asked.

    The trick is to allow the USDJPY to reset at a time when stocks aren’t affected, i.e. the after-hours market.  After a full day of follow the leader where stocks chase USDJPY higher, the cash markets close.  SPX, having pocketed its 10-15 points, can sleep peacefully even while USDJPY and the Nikkei drop like a bad transmission.  Why?

    At night, the volume in the futures is so low that the same guys playing this game during the day can easily prop up them up.  We’re talking $50mm or less most nights.  All they have to do is put in a big bid at a critical support level; 500-1,000 contracts on the e-minis usually does the trick (I know, I’ve pulled all-nighters trying to get the 3-4 points a pattern promised.)

    Anyone trying to short ES had better have deep pockets, because that bid won’t budge until the big banks feel like it — usually in the dead of night when US investors are sound asleep.  Then, after USDJPY (and, often NKD) have been brought back into alignment with whatever patterns they’re completing, TPTB are free to start pumping ES.  Generally speaking, it’ll be in the early morning — an hour or so before the cash market opens.

    If timed properly, investors will wake up and see the futures up 5-10 points, and race to the office conditioned to Buy-Buy-Buy!  It happens over and over again, resulting in new highs even when there’s little to justify them.  I’ll finish with a few charts for illustration purposes.  These are from the past few days — nothing special about them.  I could just as easily have picked a few days from last week or last month — same results.

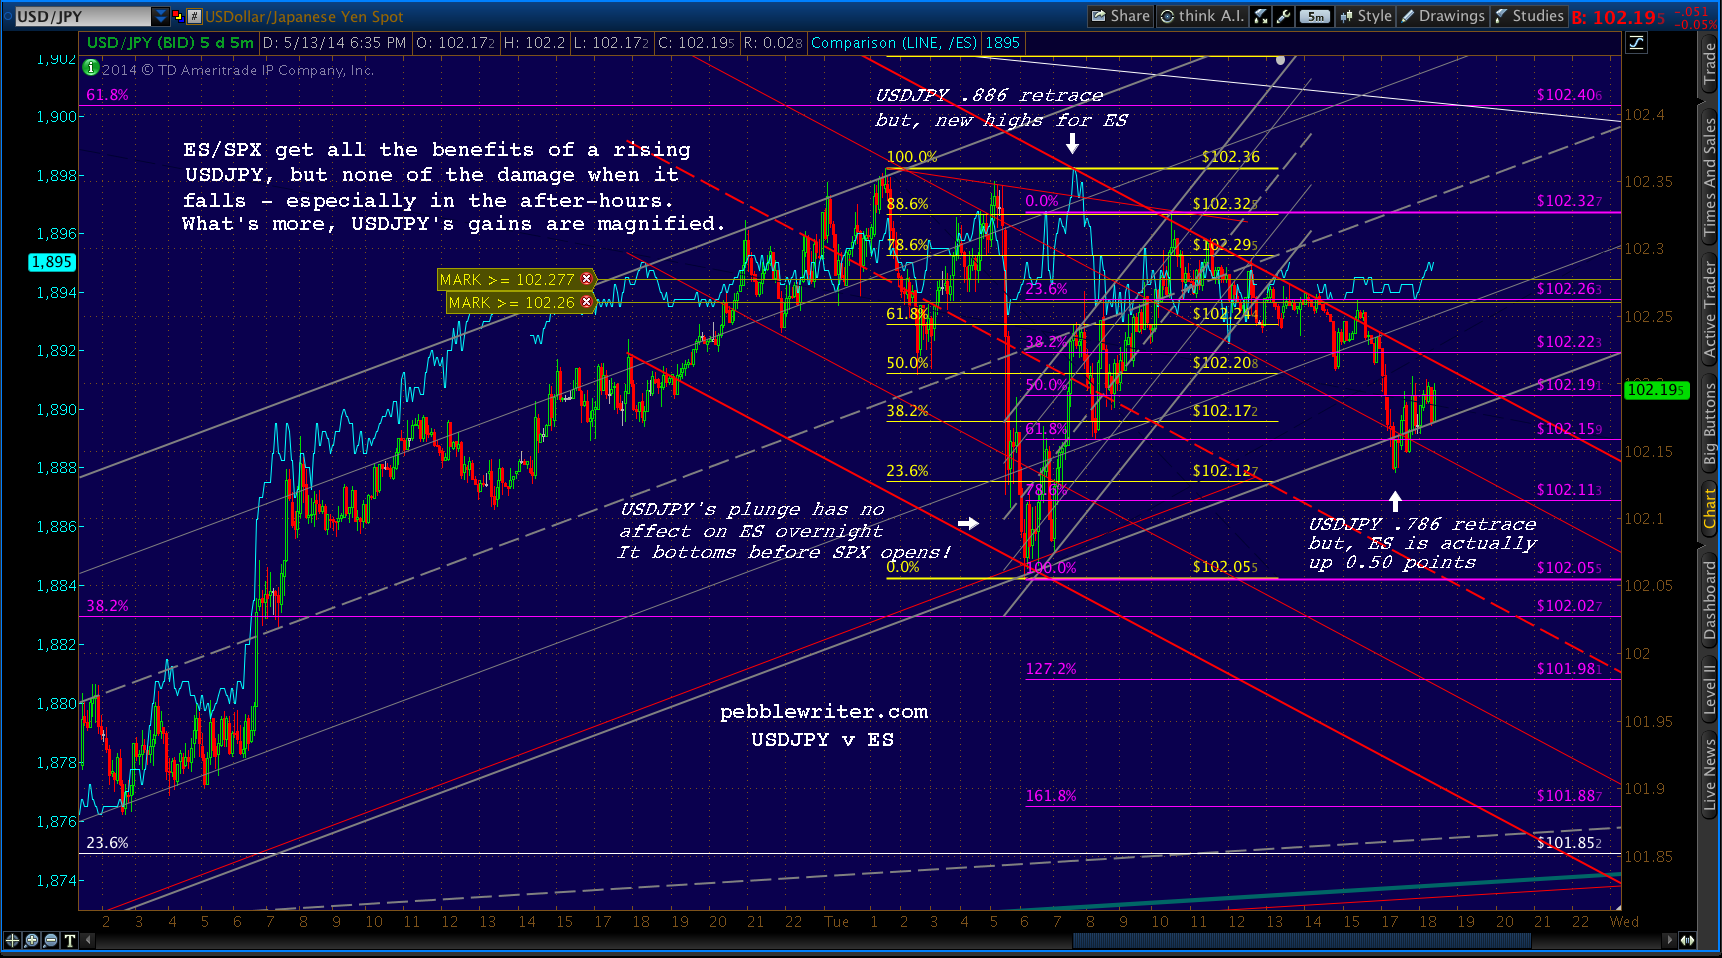
    This is the e-minis since yesterday morning.  Note the huge plunge in USDJPY that was arrested right before the market opened.  Two higher lows in a row established enough of a trend that ES rallied strongly on the opening, even after the crappy retail sales figures.  USDJPY kept climbing, so ES did as well — at least until SPX bagged 1900 (the objective.)

    The lighter shaded area represents the overnight session.

    2014-05-13-ES 5 min 2000


    After that, USDJPY’s job was to keep ES’s decline manageable until the close.  And, it worked like a charm.  Despite two lower lows, there was no follow-through.  After the close, USDJPY plunged while ES barely budged.  As I write this, ES has actually risen — and, much more than USDJPY has.

    Here’s another chart going back to last week that shows more of the same.

    2014-05-13-USDJPY v ES w notes

    And, another from the perspective of USDJPY (ES in purple):

    2014-05-13-USDJPY v ES w notes 2

    And, last, here’s one showing NKD over the same time period:

    2014-05-13-NKD after close 1733

    It’s hard to say how long this can go on.  The target is clearly the S&P 500, as COMP, RUT and NDX can attest.  There are probably trillions of dollars at play, though I’ve been unable to find any statistics.  The BIS might touch on it in their June report, but who knows?

    A significant enough event will probably bring it all crashing down one of these days.  It will require a big drop in stock prices and/or sustained strength in the yen (the object of a flight to safety for Asian investors.)  A fighting war in Ukraine directly involving the US and Russia would do it.  An announcement from the BOJ that they were going to stop manipulating the yen would work.  And, the termination of the Fed’s QE will no doubt help.

    And, here’s a wild card for you: the de-dollarization of global finance.  Zerohedge just posted a thought-provoking article about meetings going on between China, Russia, et al designed to unseat the dollar as the medium for global trade (including the petrodollar.)  It needn’t be a clean sweep in order for the dollar to weaken relative to the yen (USDJPY falls.)

    Bottom line, it’ll keep on working until it doesn’t.  Chart patterns, harmonics, technical analysis, support and resistance — all this stuff is pretty meaningless as long as the yen carry trade game goes on.  It’s a very frustrating situation for those of us who rely on these normally reliable tools to anticipate market moves.

    But, there will come a day.  And, the force of all that leverage unwinding and bubbles popping will probably make 2007-2009 seem mild by comparison.  Remember the $1.5 quadrillion in derivatives that are still out there — carried at book value (under the illusion that they will all somehow net out) at over twenty times the Gross World Product and hundreds of times the Tier 1 capital of the banks that gave them birth.

    Those who are now mindlessly buying all the dips will experience some long, dark days during which they can reminisce about the good times — when central bankers ruled the world and nothing bad ever, ever happened.


    *  *  *  *  *

    Epilogue:

    After yesterday’s lackluster performance, ES needed to tag downside support in order to get a boost for higher prices.  The best candidate (meaningful, and not too far down) is the neckline of the recently completed IH&S pattern.  Only problem, ES was in a decent uptrend most of the night.  The neckline was getting further and further away.

    USDJPY to the rescue.  The pair took a timely dive starting around 3am EDT and didn’t let up until ES had reached the IH&S neckline.  They were careful to leave a higher low in order to establish a rising trend in USDJPY — a cue for investors looking for some direction.

    2014-05-13-ES 5 min 0552

    If ES can break out of the falling red channel and get a nice bounce off the rising white channel, USDJPY will have done its job.  ES will be in a position to take a run at new highs, ideally reaching its IH&S target of 1917ish.

    Will it get there?  Who knows.  If you’re a big bank managing $500 billion and have mutual funds to sell, you need it to.  If you’re a market maker, you’d like traders to think it will, betting heavily before you pull the rug out from under them — preferably on a weekend or overnight.

    USDJPY needs to get back above the key support represented by the grey channel bottom.  But, if that’s the plan, you can bet that USDJPY will lead the way.

    2014-05-13-USDJPY 30 0615

    One obstacle, this morning’s PPI figures did a number on the 10-year.  A reversal off the .886 down at 25.35 (125’225ish) would be helpful in providing a floor for stocks.  Maybe corresponding with a backtest of the former highs for SPX/ES (1891.33/1886.00), 14275 on NKD, and the red .786 or .886 for USDJPY (101.64 or 101.55)?

    2014-05-13-TNX daily 0800

    GLTA.


  • Charts I’m Watching: May 13, 2014

    Apparently, it wasn’t the polar vortex after all (as anyone with half a brain already knew.)  Retail sales fell off a cliff in April, too.  Maybe it was too warm?

    Screen Shot 2014-05-13 at 6.18.29 AM

    Will it ruin the “market’s” plans to make new highs at 1900+ in SPX?  Probably not.  But, it might set up yet another nominal new high with no follow-through…unless the MSM comes up with a positive spin real fast.  My guess: “this will definitely taper the taper!”

    2014-05-09 SPX daily 0600

    Yesterday’s IH&S targets the white 1.272 at 1919.83.  But, it might not be a straight line to it as was planned.

    2014-05-13-SPX 15 0600

    UPDATE:  9:50 AM

    Just got to 1900, thanks to a bounce manufactured in USDJPY.  This would be an opportune time for a backtest of the neckline or a moving average (SMA10=1880.)  The actual level will, of course, be set by the USDJPY — which looks like it’ll backtest the grey channel bottom around 101.85.

    2014-05-13-SPX 60 0651


    More later.

  • Your Market Forecast for May

    Thanks to the Fed, the only legitimate remaining opportunities for shorting appear to be May 15, 21, 23 and 26.  But, the 15th is the day the Philly Fed survey, Empire State survey, CPI and initial claims come out.  And, even bad news (which is rarely permitted) hasn’t had much of an impact on markets lately. FOMC minutes come out on the 21st — nuff said.  And, new home sales come out on the 23rd (after last month’s dismal showing, look for the numbers to be “fixed.”)

    That leaves the 26th as the one potentially negative day in the month — unless the MM’s decide to cut the legs out from under those playing the just-completed IH&S pattern.  Who would be surprised?

    No, the only thing that surprises me anymore is that the bobbleheads on CNBS can even utter the word “market” anymore without breaking out laughing.

    GLTA.


    Screen Shot 2014-05-12 at 7.23.16 AM


  • Charts I’m Watching: May 12, 2014

    Why are the futures up 7.50?  Why not?  It’s a POMO day, tomorrow’s Tuesday, and USDJPY … well, it hasn’t tanked.

    2014-05-09-ES v USDJPY 60 0613

    It sets up a tricky situation for the bears.  If USDJPY’s flag pattern doesn’t play out — i.e. a nice little sell-off to 99.95ish — then the rally will certainly add fuel to ES’s fire.

    2014-05-09 USDJPY 60 0613

    And, it seems that the BOJ is pretty serious about defending the 101.30 level.  That, in a nutshell, is the rub for bears.

    If stock prices are being driven almost entirely by the yen carry trade (they are), and the yen is being propped up by the BOJ (it is), how in the world will any downside momentum ever develop?  It’s the primary reason why chart patterns are blowing up left and right.

    There’s no fundamental rationale for upside given the eroding margins, disappearing revenue growth, high margin debt, etc.  And, the technical picture is exceptionally bleak.  Yet, the carry trade marches on, driving prices higher at every opportunity.

    Some of the harmonic patterns are playing out.  In fact, ES just completed a  Bat Pattern at 11882.25.  But, the reversals are continually being but short based on the flimsiest of patterns.  So, we’re seeing two steps forward, one step back over and over again.

    What will break the cycle?  If the BOJ actually reduces their QQE — declining to expand it was good for a small drop for a few days — or backs off buying equities, it might make a difference (yes, they actually buy equity ETFs outright.)  If Japanese interest rates rose meaningfully, it would definitely make a difference.  If actual war breaks out in Ukraine or elsewhere…ditto.  Otherwise, I’m beginning to have my doubts.

    Keep an eye on USDJPY this morning.  The way things have been going lately, it’ll rally just enough to help ES (and, possibly SPX) make a new high (i.e. trash the harmonic patterns and complete an IH&S) and then back off.  The SMA10 is at 102.056.   Follow through has been in very short supply lately.

    Stay tuned.

  • Charts I’m Watching: May 9, 2014

    Nice reversal yesterday — just when it seemed SPX was impervious to downside pressure.  There’s a good chance we’ll see some follow through today.  But, even as I type this, they just ramped USDJPY/NKD and ES seems to be responding.

    2014-05-09-USDJPY 15-min 0621

    The key will be whether ES can remain below the SMA10 at 1872.50.  In an unrigged market, we’d push through the SMA20 and 50 (1863 & 1859) and be down 35 points today with more to come.  These days, who knows?  In any case, here’s my best downside scenario.

    continued for members… (more…)

  • Charts I’m Watching: May 8, 2014

    The “market” makers are doing an excellent job of propping this puppy up today.  SPX just tagged two .886 Fib levels, and has barely reversed at all.  Perhaps after the 12:00 print is in.  Or, it could be because the IH&S target of SPX 1893 is still out there. In either case, it continues to be all about the yen carry trade.

    2014-05-07-SPX 15 min 0833

    Be careful about chasing any push past the former highs, as these have frequently occurred simply to stop out those paying attention to the technicals.  The key is to pay attention to the USDJPY and NKD.  When they’re rising, so are stocks.  When they’re falling, stocks are following along if they feel like it (except in the after-hours, when declines are only allowed when SPX breaks out and closes at the high for the day.)

    Watching Yellen today, I have started thinking of the “market” as a building that she and Bernanke built that rises to the sky.  It features elevators, of course, but they only go up.  If you want to go down, you must take the stairs.  But, there’s a team of snipers on every landing with orders to shoot to kill.

    At this rate, I suspect TPTB have decided we’re going to tag SPX 1900 come hell or high water (or lousy macro data/earnings/war/pestilence/locusts/asteroids…okay, maybe an asteroid striking the Eccles Building would do it.) It will break all kinds of technical and chart pattern rules to get there.  And, it’ll probably happen in the after hours or over the weekend — so good luck catching it.

    From Zerohedge — because no other news organization would dare touch it…

    Spot the Unrigged Market

    Screen Shot 2014-05-08 at 9.35.12 AM

  • Charts I’m Watching: May 7, 2014

    Bulls are going for an IH&S on the post-Yellen melt-up.

    2014-05-07-ES 5 min 0932Can it get there?  Perhaps.  But, NKD and USDJPY argue against it.  The Nikkei’s rising white channel broke down yesterday. And, this morning’s rally should be seen as a backtest.

    2014-05-07-NKD 60 1052Likewise, the USDJPY got a bounce off a .886, but merely backtested the broken grey channel.  The flag pattern/SMA200 target remains.

    2014-05-07-USDJPY 60 1052With the yen continuing to strengthen, Japanese econ data continuing to weaken, and the BOJ sitting on their hands for now, it’s hard to envision a change in direction until the SMA200 is reached.

    The tricky aspect of it, though, is that much of the damage is being done at night, when ES can be and is propped up.  For instance, a 2,500 contract order sat on the books at 1861 all night — preventing the .618 tag at 1860.  So, it’s hard to say whether ES/SPX can remain untouched by all the bedlam surrounding it.

    GLTA.

  • Charts I’m Watching: May 6, 2014

    It’s all about USDJPY, today.  The flag pattern completed as expected and the pair has broken down from the white rising channel, plunging to 101.53 so far.

    2014-05-06-USDJPY 15 min 0600The pattern targets 101.02, though there is potential Fib support at multiple levels including 101.51, 101.46 and 101.31.

    Most of the action occurred overnight, so the impact on ES has been muted.  But, there should be more downside after the latest backtest completes.  The .786 at 1864.99 would make for a good target once the .500 at 1871 falls.

    2014-05-06-ES v USDJPY 60 min 0600

  • Charts I’m Watching: May 5, 2014

    USDJPY’s white channel broke down yesterday as expected, and the grey channel bottom and yellow midlines are currently providing support.

    2014-05-05-USDJPY 60 0620 2014-05-05-USDJPY 4hr 0620The strong reversal off the SMA100 on Friday was a pretty good confirmation of a negative picture going forward. I suspect the next moving average test will be the 200-day just below 101.

    ES retraced to the white .500 in the bullish pattern, but could easily slip to the purple .618 (1860.04) or .786 (1853) if things get going to the downside.  Note that the .786 is aligned with the red channel bottom.

    2014-05-05-ES 60 0620UPDATE:  11:20 AM

    Follow the leader again this morning, with USDJPY’s bounce leading stocks higher by about 3-5 minutes.  As usual, stocks were only to glad to catch up to and surpass the pair’s move.

    2014-05-05-USDJPY 5-min 0821Only problem for stocks is that USDJPY, while taking out last night’s highs, has also completed a bearish flag pattern that targets the SMA100 at around 100.95.

    And, it’s just a pimple on the but of the large flag pattern (below, in white) that targets 100.20 or lower.

    2014-05-05-USDJPY 4hr 0821Whether it’ll be allowed to play out is another matter.  Remember, tomorrow is Tuesday.  In fact, Thursday is the only day this week without scheduled POMO.  In other words, there’s a decent chance that this bearish pattern will play out in the after hours when the banksters can more easily keep the futures afloat.

    Stay tuned.

  • Charts I’m Watching: May 2, 2014

    Some big tickets were dropped at the jobs report announcement this morning, spiking USDJPY to test the SMA100 at the top of the white channel — where it promptly reversed and tagged the bottom of the channel.

    2014-05-02-USDJPY 30 0819It seems to me that the odds are about equal of a spike to 103.8 or a plunge to 99.84 in the coming week — with the outcome largely dependent on how bad things get in Ukraine [LIVE FEED FROM ODESSA] this weekend.  The upside case would take the pair back to the LT red trend line, the .886 of the recent drop, and the top of the falling yellow channel.  Whereas the downside case is to the bottom of the channel and a number of important Fib levels.

    2014-05-02-USDJPY daily CU 0830The large red rising channel has always had two different possibly placements.  The steeper of the two would characterize everything since Apr 10 as a backtest, with the upside case at 103.8 potentially completing the backtest.  I’d keep an eye on the moving averages, about which the pair is currently bouncing.

    2014-05-02-USDJPY daily 0830The 10-year note briefly dipped below the Feb 4 lows, only to be kicked back above.

    2014-05-02-TNX 60 0846Like the Nikkei and the USDJPY, TPTB have put a very effective floor on any breakdowns — thus preventing stocks from plunging.  Like USDJPY and the Nikkei, the swings have had lopsided effects.

    Plunges in TNX have brought minimal corrections to stocks, while spikes back to former highs have produced new highs in stocks.  And, lately, the spikes have formed a series of lower highs to go with the lower lows — even as stocks make new highs.  This divergence is becoming hard to ignore.