Author: pebblewriter

  • Charts I’m Watching: Jun 6, 2014

    A lot of chop this morning in the futures following the jobs report.  In addition to USDJPY — which is mired in between all its daily moving averages,  keep an eye on SPX’s acceleration channel.

    2014-06-06-SPX 60 0600

    UPDATE:  11:20 AM

    FWIW, SPX just tagged the purple 1.618 set up by the drop from 1897 to 1814 in early April.  In an unrigged market, not run by algos, I’d say this is a good spot for a reversal to at least the yellow 1.618 at 1918.36.  In a more normal market, maybe even the purple .786/yellow 1.272 at 1879.  In a market reflecting the real economic state of affairs, interest rates, earnings, etc. — more like 1800 or lower.

    2014-06-06-SPX 60 0819

    Enough “what-ifs.”  The bears will be lucky to get a gap fill at 1940.66.

  • Charts I’m Watching: Jun 5, 2014

    SPX has broken through the previous highs and appears headed for the purple 1.618 at 1848.52.  On the other hand, it just reached the TL connecting May 2, 2011 and Dec 31, 2013 again.

    2014-06-05-SPX daily 0906

    Watch how the bell cows of NKD and USDJPY behave at this juncture.  USDJPY, in particular, has had trouble breaking out — even after successfully backtesting its SMA100 again.  Probably just needs to consolidate a bit.

    The e-minis have reached a minor 1.272 in what has been essentially a straight shot higher.

    2014-06-04-ES 5 915

  • Charts I’m Watching: Jun 4, 2014

    Another day, another snap-back rally to test the top.  This one reversed exactly at yesterday’s lows (probably just a coincidence.)  SPX’s Crab Pattern target of 1926.77 is still out there, so be careful of any new highs here on SPX/ES.

    2014-06-04-ES 30 0715S

    USDJPY may have topped out for now, but the white .618 is still a possibility — and, a likely ally in any push higher in the “market.”

    2014-06-04-USDJPY 30 0715

    We should see more of this chop until Draghi’s big announcement tomorrow.  What will the ECB do?  Smarter guys than me are certain it’ll be negative interest rates.  I happen to believe more LTRO s and an expansion of relieving the “dead banks walking” of more of their crappy paper/derivatives.  Whatever the announcement, the “market” will probably sell off viciously for all of 30 seconds before rallying to new highs.  Sigh…

    I have more Comcast issues, so will sign off now.  GLTA.

    UPDATE:  11:15 AM

    Quick update…ES and SPX just made new highs, so all those pretty harmonic patterns showing potential downside targets are garbage. Remember the SPX 1926.77 target, though.  If SPX should reach it during trading hours, we could see a decent sell-off.

    The way the algos have been working lately, however, is to push to a new high (to stop out the shorts, if there are any still alive) and then linger there near an obvious harmonic or chart pattern reversal point to keep the newly minted bulls in the game until the rug can be pulled out from under them — preferably in the after-hours.

    If the talking heads on the boob tube really wanted to discuss where all the traders went (why this is the most-hated bull market in history) they’d spend a day or two talking about algorithmic trading.  It is undermining the integrity of the “market” just as surely as is the Fed and is slightly more important than driverless cars or the latest funny-money acquisition.

  • Charts I’m Watching: Jun 3, 2014

    Watching the USDJPY this morning, as it tries to decide whether to push through the SMA100.  A reaction off the channel line and .500 Fib would make sense.

    2014-06-03-USDJPY daily 0600

    The direction should determine whether stocks continue their run or not.

    2014-06-03-USDJPY 30 0600

    The Nikkei had a big day yesterday, breaking out of the triangle it’s been in since the beginning of the year as well as the SMA200.  Now, it’s bumping up against some potentially important Fibs.  Backtest of the SMA200 at 14811 or the triangle itself?

    2014-06-02-pebble

    Harmonics haven’t been terribly effective lately, but there is a potential Gartley Pattern at work in ES.  If it’s to play out, we could see a backtest of the broken white midline first.

    2014-06-03-ES 30 0600

    GLTA.

  • Chart’s I’m Watching: Jun 2, 2014

    Nothing new from last week, which includes the “market” completely ignoring this morning’s ugly economic news and PMI data that seems rather obviously managed.

    2014-06-02-SPX daily 0917

    TPTB ramped SPX up over important Fib levels in last week’s holiday low volume, but are having a bit of trouble defending the new highs. USDJPY (and a quick phone call to ISM) to the rescue.

    Screen Shot 2014-06-02 at 9.31.59 AM

    But, it’s not rigged…

  • Charts I’m Watching: May 30, 2014

    Today should be a carbon copy of yesterday: ignoring dismal economic news, ignoring the 10-yr note warning signs, ramping on USDJPY/NKD, BTFATH, etc.  Chart Patterns, Elliott Wave, technical analysis do not apply on the last day of the month which, for PR purposes, has been green for the past three months.

    Unless a true black swan event pops up, look for new highs above the Crab Pattern 1.618 Fib of SPX 1918.36.  A logical target would be the smaller, red 1.618 (1926.77.)

    2014-05-30-SPX 60 0616

    The bigger picture:

    2014-05-30-SPX daily 0616

    Come Monday, it could be completely different story.  But, I can’t imagine TPTB yielding the larger scale 1.618 that they spent so heavily to achieve.

    UPDATE:  1:25 PM

    What happened to the nice little rally we had going?  Loretta Mester is the incoming president of the Cleveland Fed — and a voting member.  At a conference on inflation the Cleveland Fed is sponsoring, she made comments about the risk of inflation (right, not deflation as we hear over and over.)  This brands her as a potential hawk, and opens a window on the changing dynamic in the FOMC’s thinking.

    10-yr yields broke a rising trend line — though they were quickly neutralized by TPTB.  SPX and ES retraced .886 of the rise from this morning. USDJPY fell back below the SMA20. And, SPX is back to that 1.618 and trying to rebuild some momentum.

    2014-05-30-SPX 5 min 1037

    As I was typing this, John Wiilliams (SF Fed) was on CNBC talking about the possibility of overshooting 2% inflation.  The “market” isnt’ so happy about all this crazy talk!

  • Charts I’m Watching: May 29, 2014

    I’m having intermittent technical issues today, so will not be posting intra-day.  The daily charts tell the story: a 1.618 Fib line just overhead at SPX 1920.63 and ES 1910.50.  The only issue…the markets have routinely ignored harmonics when it comes to limiting rallies (while choosing the most bullish Fibs to limit declines.) Note the veritable absence of Points B & C in the proposed Crab Pattern (in yellow.)  Today is the biggest POMO day of the month, and the end of the month is tomorrow (photo opp.)  So, don’t put too much stock in technical analysis, chart patterns, the contracting economy or crappy earnings.  Revel in the fact that Apple is paying $3 billion for some headphones.  In other words, trade safe and pay attention to what price action is telling you — no matter how contrived (yes, rigged) it obviously is.

    2014-05-29-ES daily 0630

  • Charts I’m Watching: May 28, 2014

    The PPT swinging into action this morning in the unrigged “market.”  The 10-yr note is coincidentally bid at the former lows…

    2014-05-28-TNX 15 0545

    NKD catches a bid at the channel bottom…

    2014-05-28-NKD 15 0600

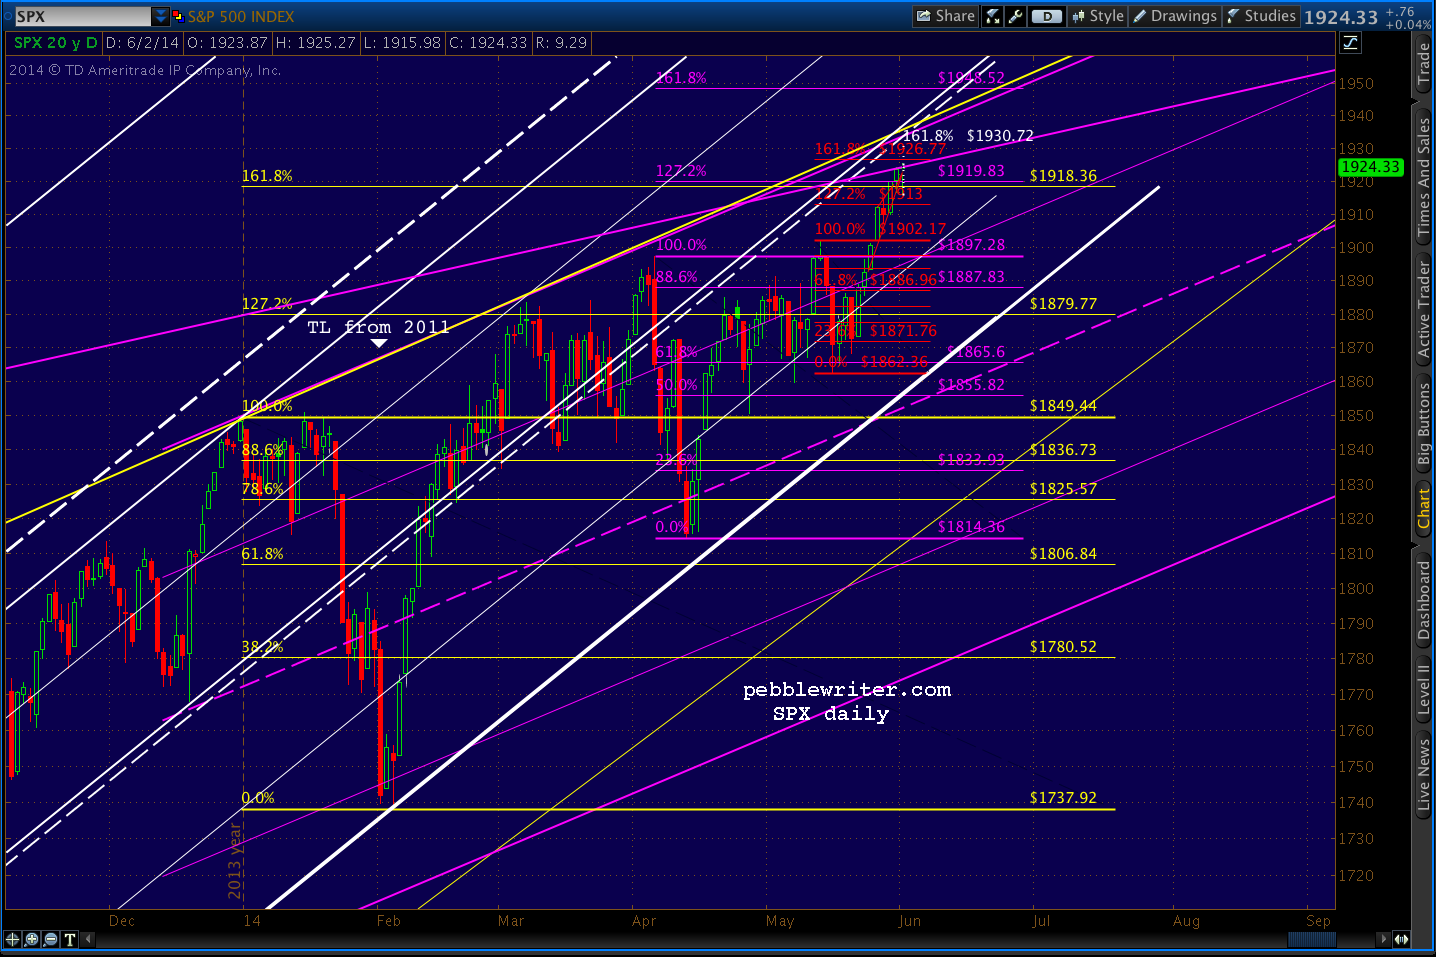
    …and, ES catches a bid at the 1.618 it should be reversing off of.

    2014-05-28-ES 5 0600


    Make no mistake, the market should be tanking.  But, the month end is Friday, and it would look really bad if it ended on a sour note. So, it’s time to pull some tricks out of the bag, like this takedown in the 10-yr futures last night.

    2014-05-28-ZN 5 0600

    By far the most startling data I’ve seen lately was posted on Zerohedge yesterday.  For those who have been wondering where all the buying pressure at all-time highs is coming from… wonder no more.  Per Zerohedge:

    According to the most recent CapitalIQ data, the single biggest buyer of stocks in the first quarter were none other than the companies of the S&P500 itself, which cumulatively repurchased a whopping $160 billion of their own stock in the first quarter!

    Screen Shot 2014-05-28 at 9.46.04 AM


    Should the Q1 pace of buybacks persist into Q2 which has just one month left before it too enters the history books, the LTM period as of June 30, 2014 will be the greatest annual buyback tally in market history.  And now for the twist.

    Unlike traditional investors who at least pretend to try to buy low and sell high, companies, who are simply buying back their own stock to reduce their outstanding stock float, have virtually zero cost considerations: if the corner office knows sales and Net Income (not EPS) will be weak in the quarter, they will tell their favorite broker to purchase $X billion of their shares with no regard for price: the only prerogative is to reduce the amount of shares outstanding and make the S in EPS lower, thus boosting the overall fraction in order to beat estimates for one more quarter.

    Compounding this indiscriminate buying frenzy is that ever more companies (cough-apple-cough… and IBM of course) are forced to issue debt in order to fund their repurchases. So since the cash flow statement merely acts as a pass-through vehicle and under ZIRP companies with crap balance sheets are in fact rewarded (as even Bloomberg noted earlier) the actual risk of the company mispricing its stock buyback entry point is borne by the bond buyer who in chasing yield (with other people’s money) serves as the funding source for these buybacks.

    Happy trading!

    UPDATE:  1:15 PM

    The “market” is stuck trying to decide whether the stick save will suffice.  Note the distinctive flag pattern on 10-yr note yields.  There’s much more potential downside, but they’ve done a fair job of turning it sideways for now.

    2014-05-28-TNX 5 1014

    ES shows a likely IH&S Pattern in the works (targets 1918.55.)  The only problem is that 1.618 extension at 1910.51. The neckline at 1911.50 matches up with SPX’s high of 1913.62.

    Note: the equivalent 1.618 for SPX is way up at 1918.36 — an obvious mismatch and another source of the “market’s” confusion.

    2014-05-28-ES IHS 0952

    The upside is having trouble getting going because USDJPY — which is stalling at the SMA20 — badly needs a trip down to the 200 SMA and purple channel bottom, and TNX has plenty more downside.  In short, the USDJPY/ZN/NKD ramp hasn’t shown up yet — and might not, today.

    Tomorrow is setting up as a weak market on the face of it.  But, if the rampers can reset overnight, the upside targets have a shot — especially since it’s the biggest POMO day of the month.  Keep a close eye on the futures tonight.

    GLTA.

  • Charts I’m Watching: May 27, 2013

    Holiday weekend + Tuesday + 1900 barrier broken = strong ramp.  NKD hit an imporrtant Fib level and the SMA100, but is probably aiming for the SMA200 and purple .618 combo at 14787/14796.  At some point, folks will start to realize the yen carry trade is nearing an end.

    2014-05-27-NKD 60 0500

    While, USDJPY features a nice Fib target of the combination red .618/blue .886 at 102.18 — just below the SMA50 at 102.22.


    2014-05-27 USDJPY 60 0545

    What does it mean for stocks?  continued for members… (more…)

  • Charts I’m Watching: May 23, 2014

    Remember, no POMO today.  Our thesis about NKD was weakened as it popped a bit overnight.  There is still overhead resistance and a rising wedge, but not as compelling since it exceeded the 5/13 high.

    2014-05-23 NKD v ES 0600

    Likewise, USDJPY was ramped a bit after the close yesterday, fell during Tokyo trading, and was ramped again after their market closed — testing the SMA20.

    2014-05-23 USDJPY 30 min 0615

    The near-term bounce should continue, but there remains the issue of the broken grey channel bottom and all those bearishly-aligned moving averages…

    2014-05-23 USDJPY daily SMAs 0615

    …not to mention decent channel resistance.

    2014-05-23 USDJPY daily 0615

    The e-minis have gone essentially nowhere after selling off at the close.

    2014-05-23-ES 15 0557

    While ES tagged its .886 yesterday, SPX never reached its.  So, we could see another cycle up powered by USDJPY.  The only problem is e-mini buyers are reluctant to bid up over 1894.  By my calculations, getting SPX to 1897.63 will require ES reaching roughly 1895. Who’s going to bite the bullet?

    It’ll take a big spike in USDJPY — pushing through the SMA20 at 101.92? — which normally would have occurred at 15-30 minutes prior to the close yesterday.  HP’s goof seems to have put a damper on the normal algo action.  Now…they’re a bit confused.

    Back in the old days, before the word “market” required quotation marks, this wouldn’t be an issue.  Investors would look at things like earnings, the economy, geo-political events, etc and decide whether they justified higher prices.

    I suspect it’ll happen, and what better time than a holiday weekend?   Low volume and minimal attention from real investors can work wonders — especially when the land of milk and honey lies just beyond 1900.


    GLTA.