In last month’s update on VIX, we noted it had fallen below and backtested the rising purple channel bottom.
Should the backtest hold, the message is that stocks have fallen as far as they need to. VIX will settle lower in order to prevent things from getting out of hand. But, remember, we’re expecting a fair amount of chop through year-end. So, don’t be surprised if VIX vacillates around this [level] for days or weeks to come in order to set the stage for stocks’ next push.
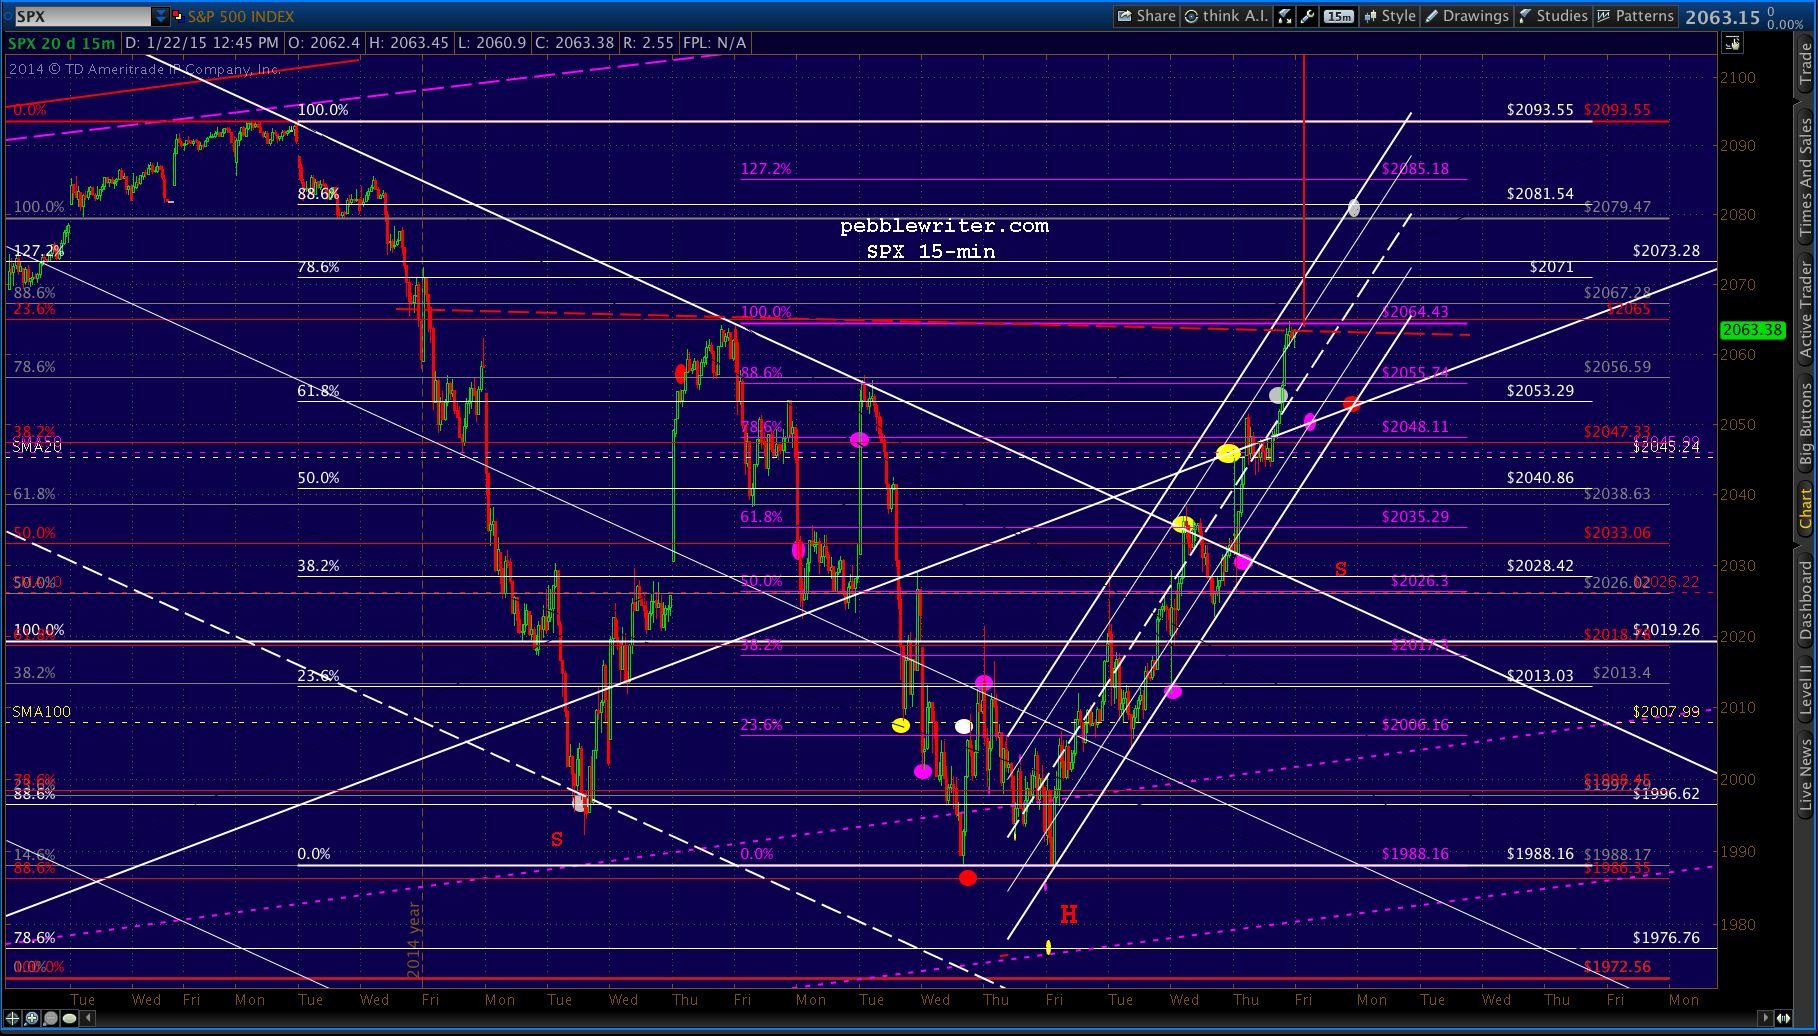
The backtest was, itself, a head fake. VIX dropped for exactly one more day before shooting back up through the channel bottom as SPX logged a 100-pt decline through mid-December.
 From there, it was a very wild ride as SPX regained all the losses (and, then some) before shedding 105 points through mid-January.
In my opinion, VIX has lost much of its predictive ability. It is frequently manipulated by the Fed’s proxies — not to mention other central banks and hedge funds — in order to prop up stocks (particularly at the end of the trading day.)
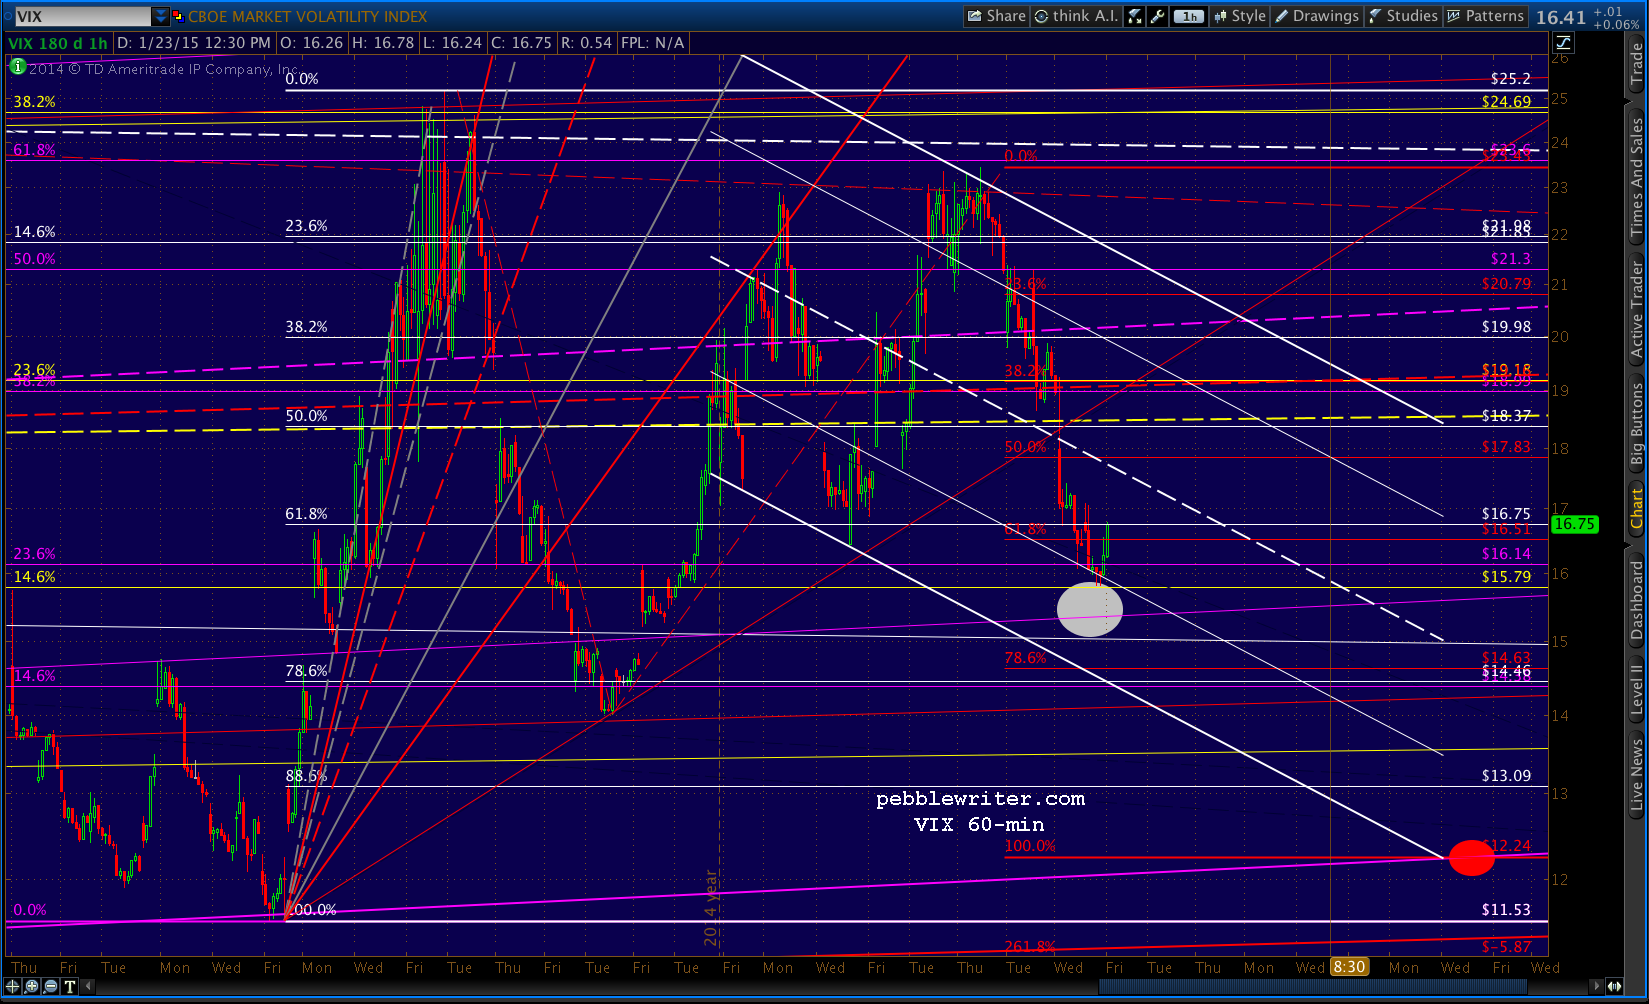
So, instead of a valid barometer of the level of fear in the markets, it has become more an indicator of when TPTB are stepping in to prevent any further declines. When things get out of hand — as they seemed to in early October, early December and early January — a monkey-hammering of VIX is just the thing to help “markets” recover. Note the falling white TL connecting the tops of Oct 15, Dec 16 and Jan 16.
Nevertheless, it might provide some clues to the script which guides the day-to-day moves. Following a general downtrend from its highs of Oct 2008, VIX spent the couple of years going sideways.
The spike in mid-October reached 31.06, which was roughly a .236 retracement (white grid) of the drop from 89.53 in 2008 to 10.28 this past year, and a .500 retracement of the drop from Aug 2011 (yellow grid.) Note the general uptrend since then as depicted by the revised purple channel.
 In the world of harmonics, we might put a pin in that yellow .500 tag and speculate about a potential Bat Pattern leading to the yellow .886 at 43.70. Note that it’s closely aligned with the purple 1.618 at 43.13. And, that price level is roughly equal to the previous peaks of the past five years: 48.20 in May 2010 and 48 in Aug 2011.
If the rising purple channel is valid, it wouldn’t happen until July or so, and would slightly violate the .786 falling white channel line. It would also represent an official breakout of the falling wedge from 2009 (the red, dashed TL and white channel bottom as upper and lower bounds respectively.)
In order to get there, though, VIX would need to rebound at the white channel’s .236 line (currently around 15) and the purple channel would need to hold. Note that the purple .236 has been tagged already, and the yellow .146 is just below, intersecting with the rising purple channel .236 line (the white dot.)
Again, TPTB know these spots, too (or, at least should) and might well have special plans to smash VIX lower at that point. The purple channel has already tilted to a lesser slope once. They could be angling for something like the red channel or yellow channel sketched in below.
 And, the decline from 25.2 on Dec 16 doesn’t look complete from a wave or harmonic standpoint. A decline to the white .886 at 13.09 or even the purple channel bottom at 12ish would make all the sense in the world in the short run.
If, on the other hand, VIX reverses around 15, our next upside target is the purple .886 at 29. The chart below depicts the new purple channel as well as the targets mentioned above.
 GLTA.
GLTA.


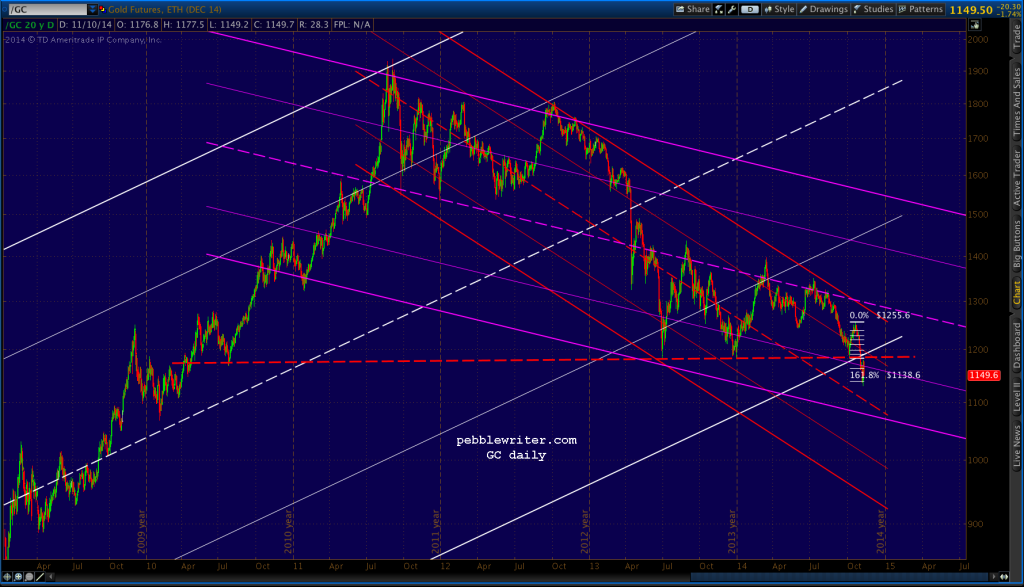
 If they don’t, the close-up shows the strong case that could be made for a drop to the yellow .500 Fib at 1089.40. But, of course, that would require the trend line and previous lows (1140ish) to break down again.
 Bottom line, the argument is for a reversal here at the white .500 at 1302. It also represents a backtest of the yellow .382, the midline of the purple channel and the top of the iffy red channel.