Author: pebblewriter

  • Charts I’m Watching: Jan 13, 2015

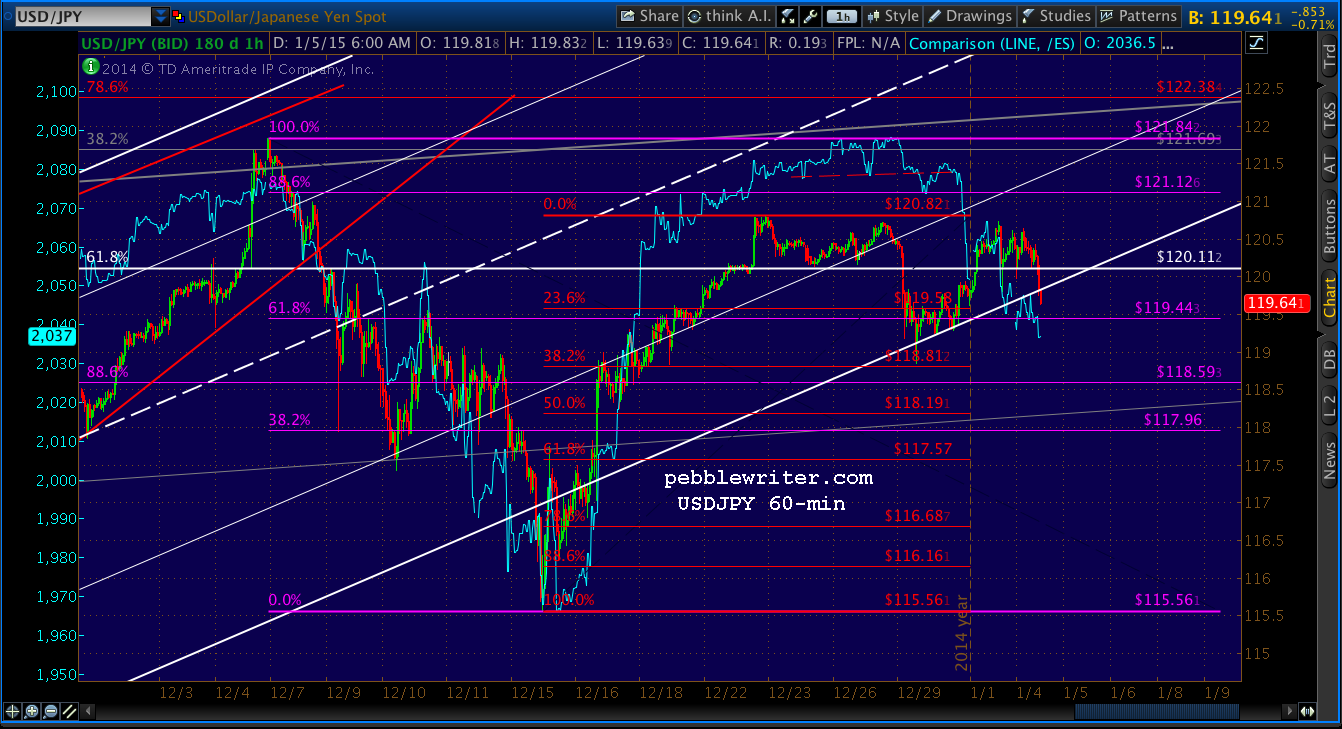
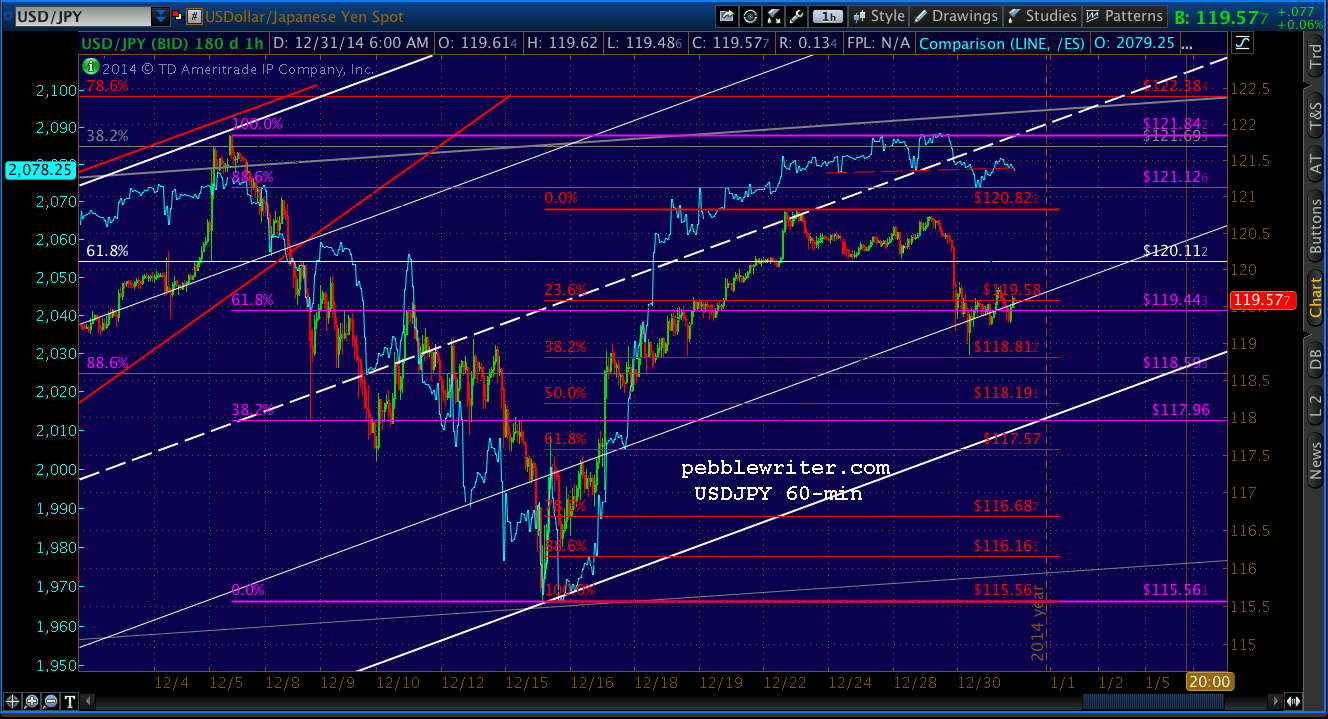
    The overnight session in USDJPY nearly reached our next target — the white .618 at 2019 (formerly red, and the key .618 at 120.11 is now drawn yellow.)

    2015-01-13-USDJPY 60 0600But, it was already testing the SMA50, and today’s open was approaching.  The big bounce does nothing to change my best take on the developing channel plot.  In fact, it helps confirm it.

    2015-01-13-USDJPY daily 0600png
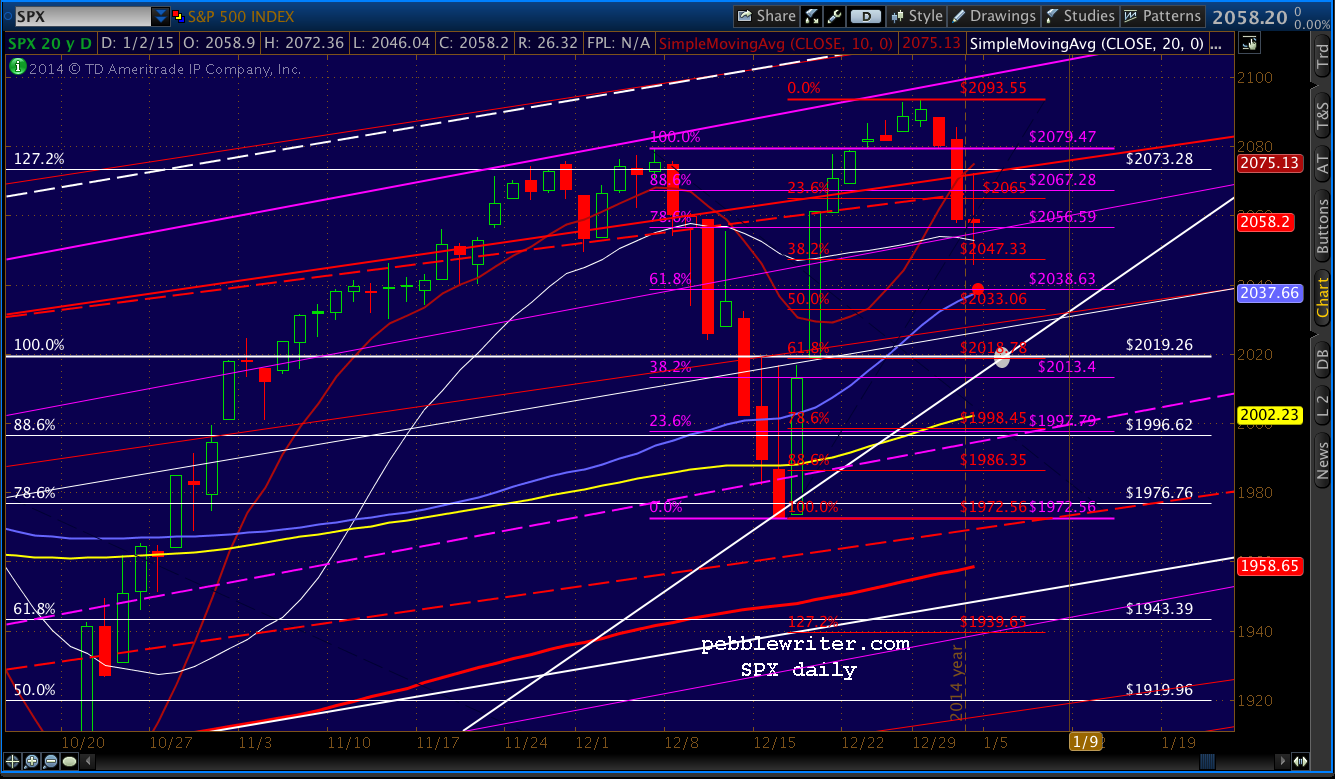
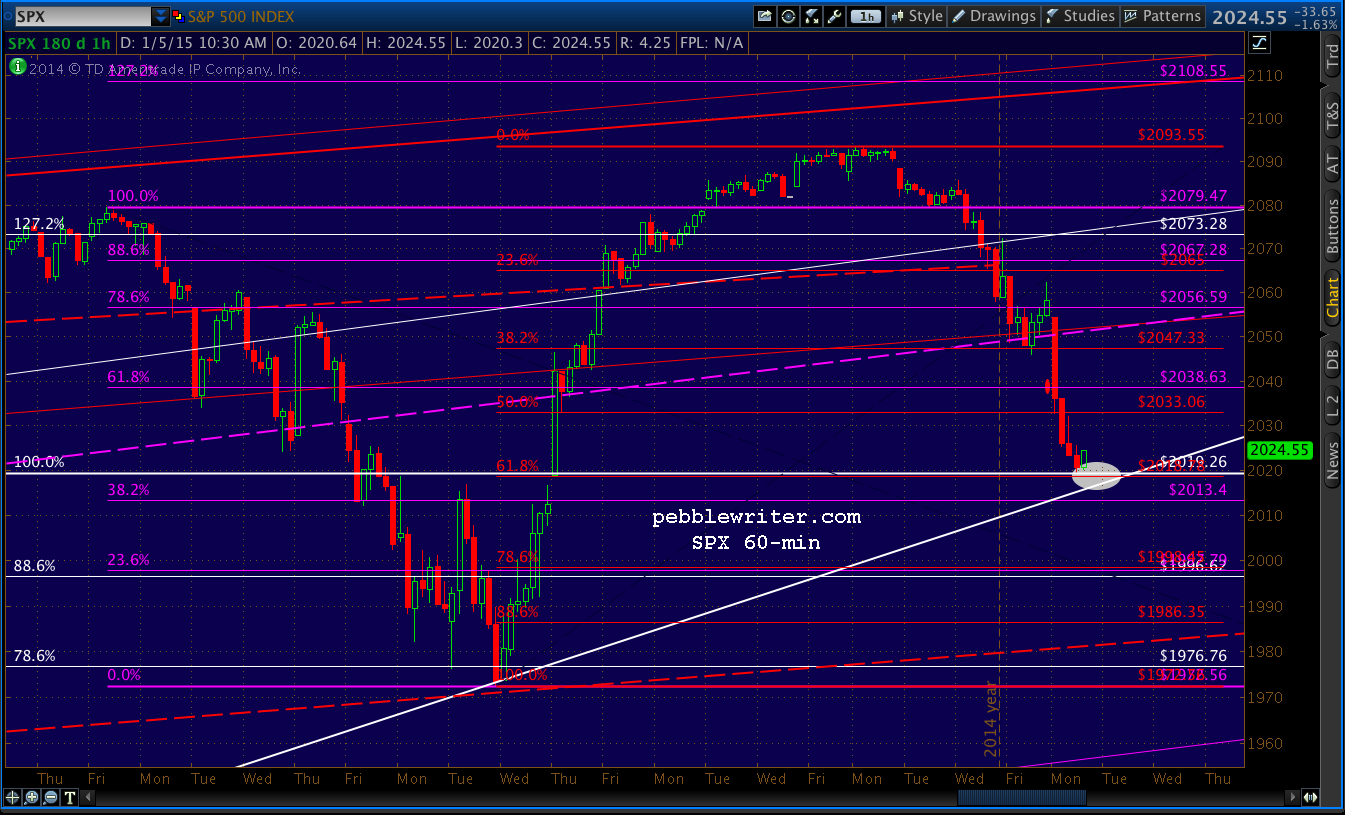
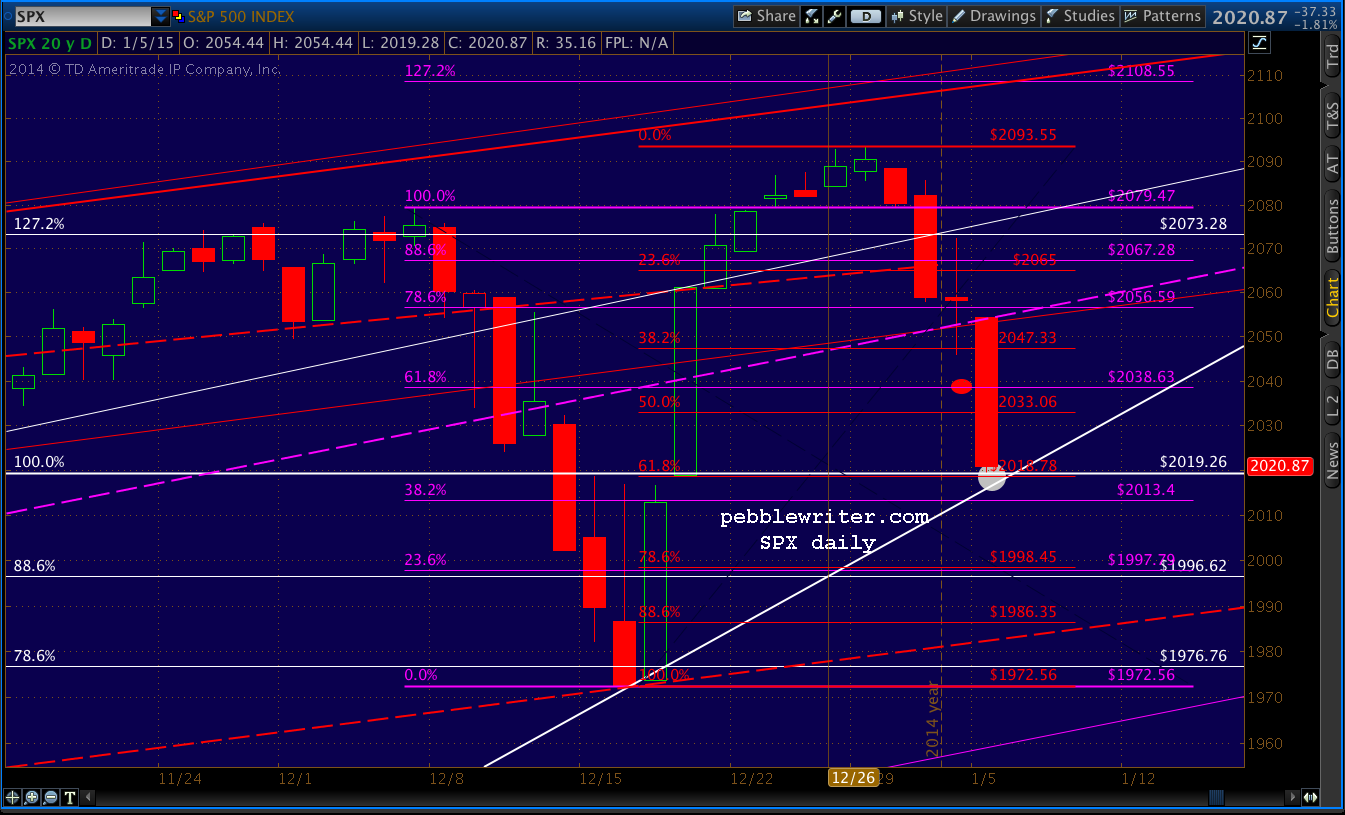
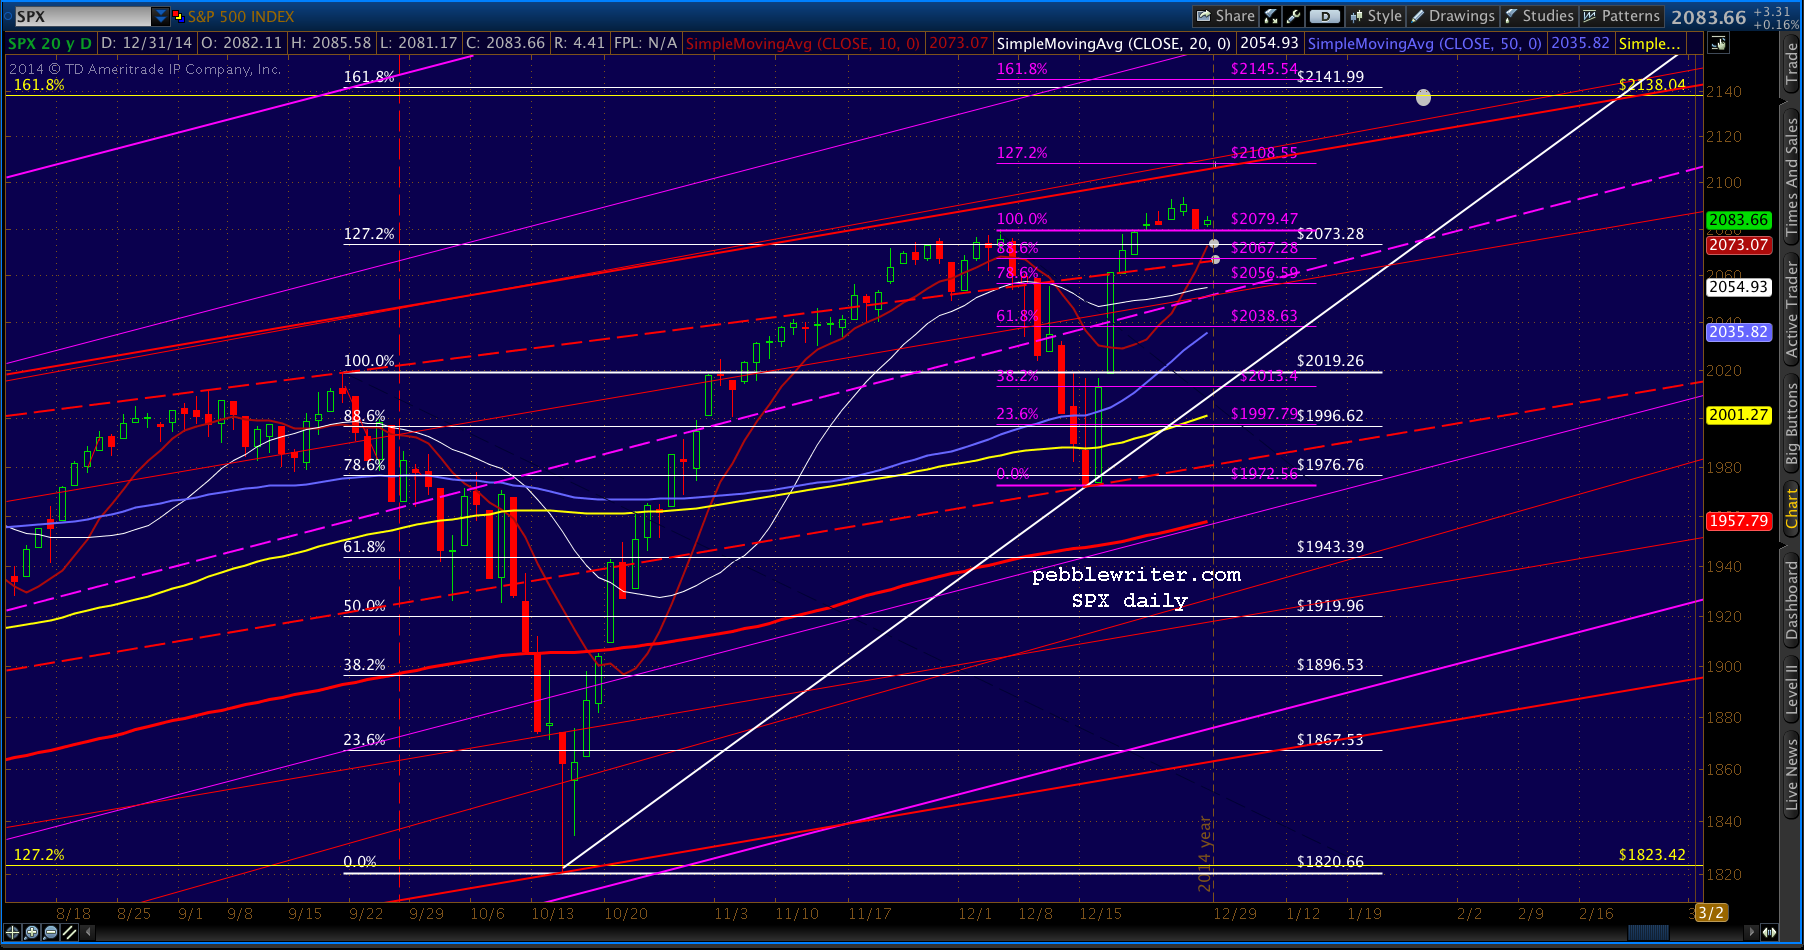
SPX reached our downside target offered last Friday [see: CIW Jan 9, 2015]  a bounce in USDJPY would produce one in SPX.

    One strong scenario would be a dip to the target we mentioned yesterday: the gap at 2029.61.  It’s roughly the purple .382 and would be a nice head fake.

    And, as updated yesterday:

    We’ll find out shortly whether or not it’s a head fake.  I suspect SPX might be in for a tag of the .618 at 2019, but the gap is closed.  So, we could get a bounce at any time.   USDJPY plunged quickly, but is holding above the recent lows.  If it bounces off those lows, SPX should bounce up and backtest the moving averages (2045ish) at least.

    With the eminis showing +14 at present, it appears SPX has an excellent shot at testing those moving averages — the 10, 20 and 50-days, all in a tight spread now of 2045.66-2047.23.

    2015-01-13-SPX 60 0605
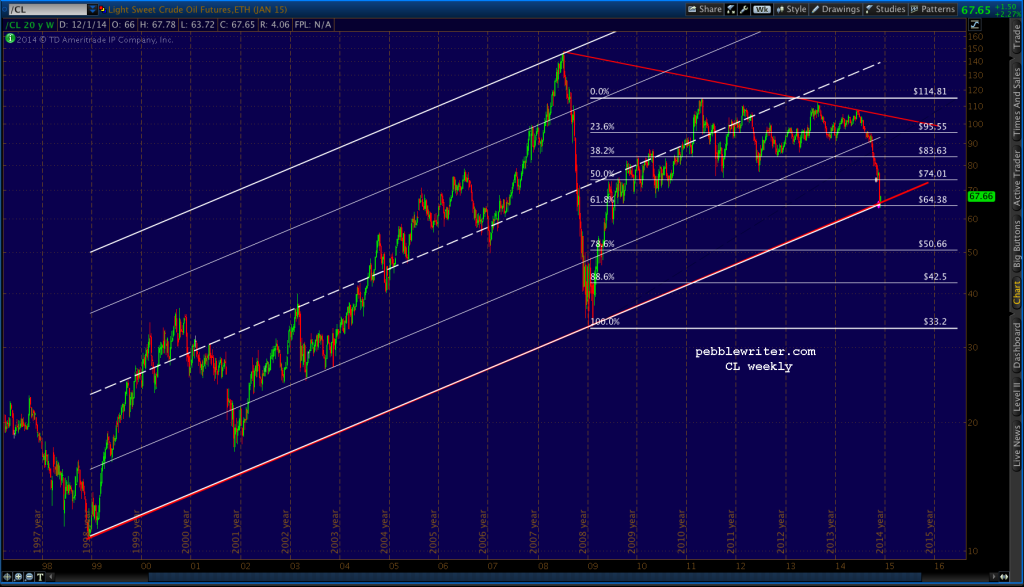
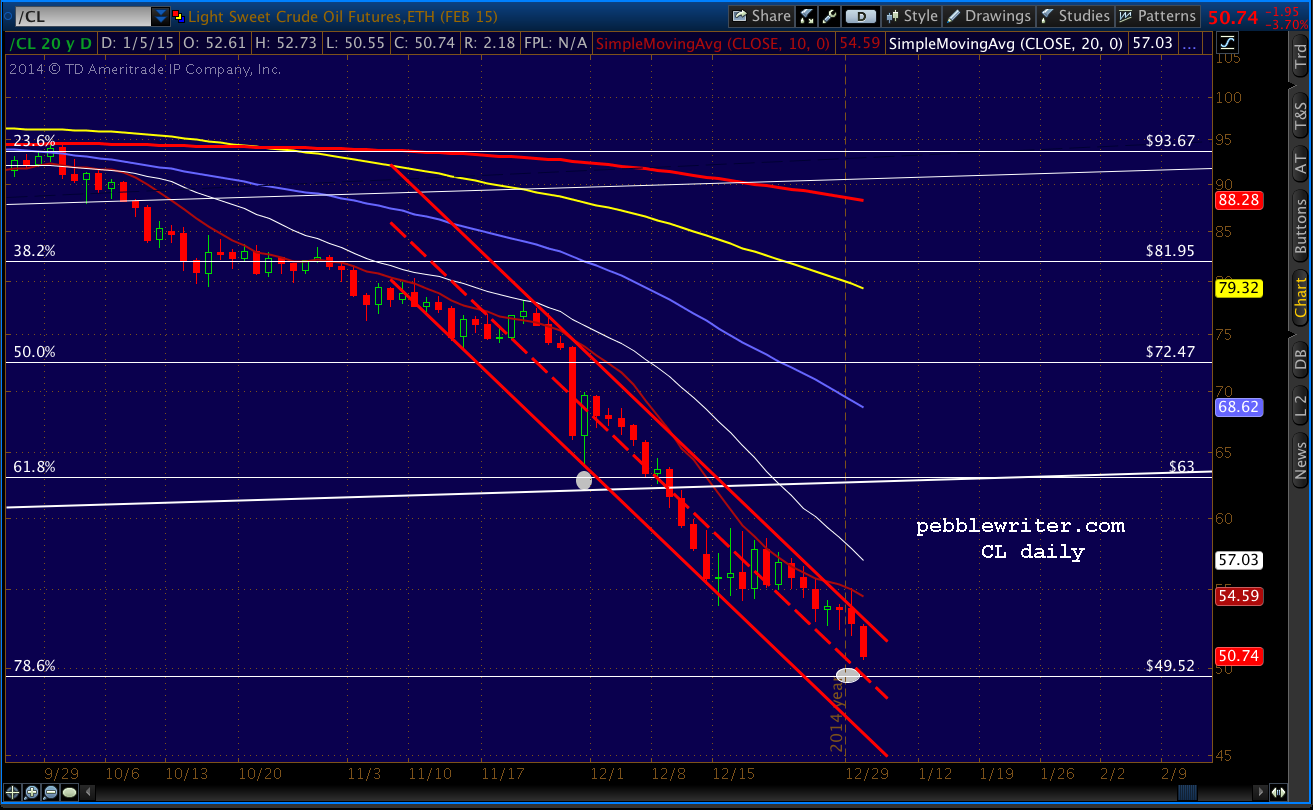
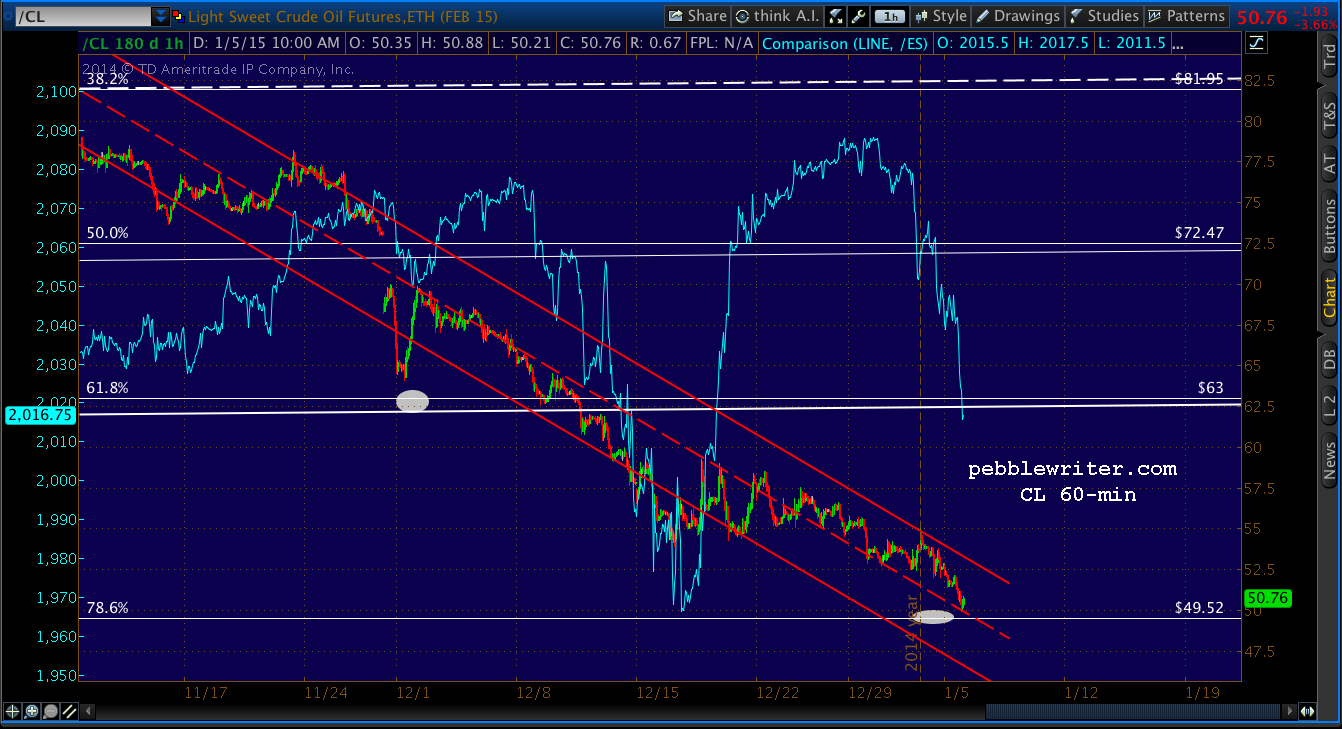
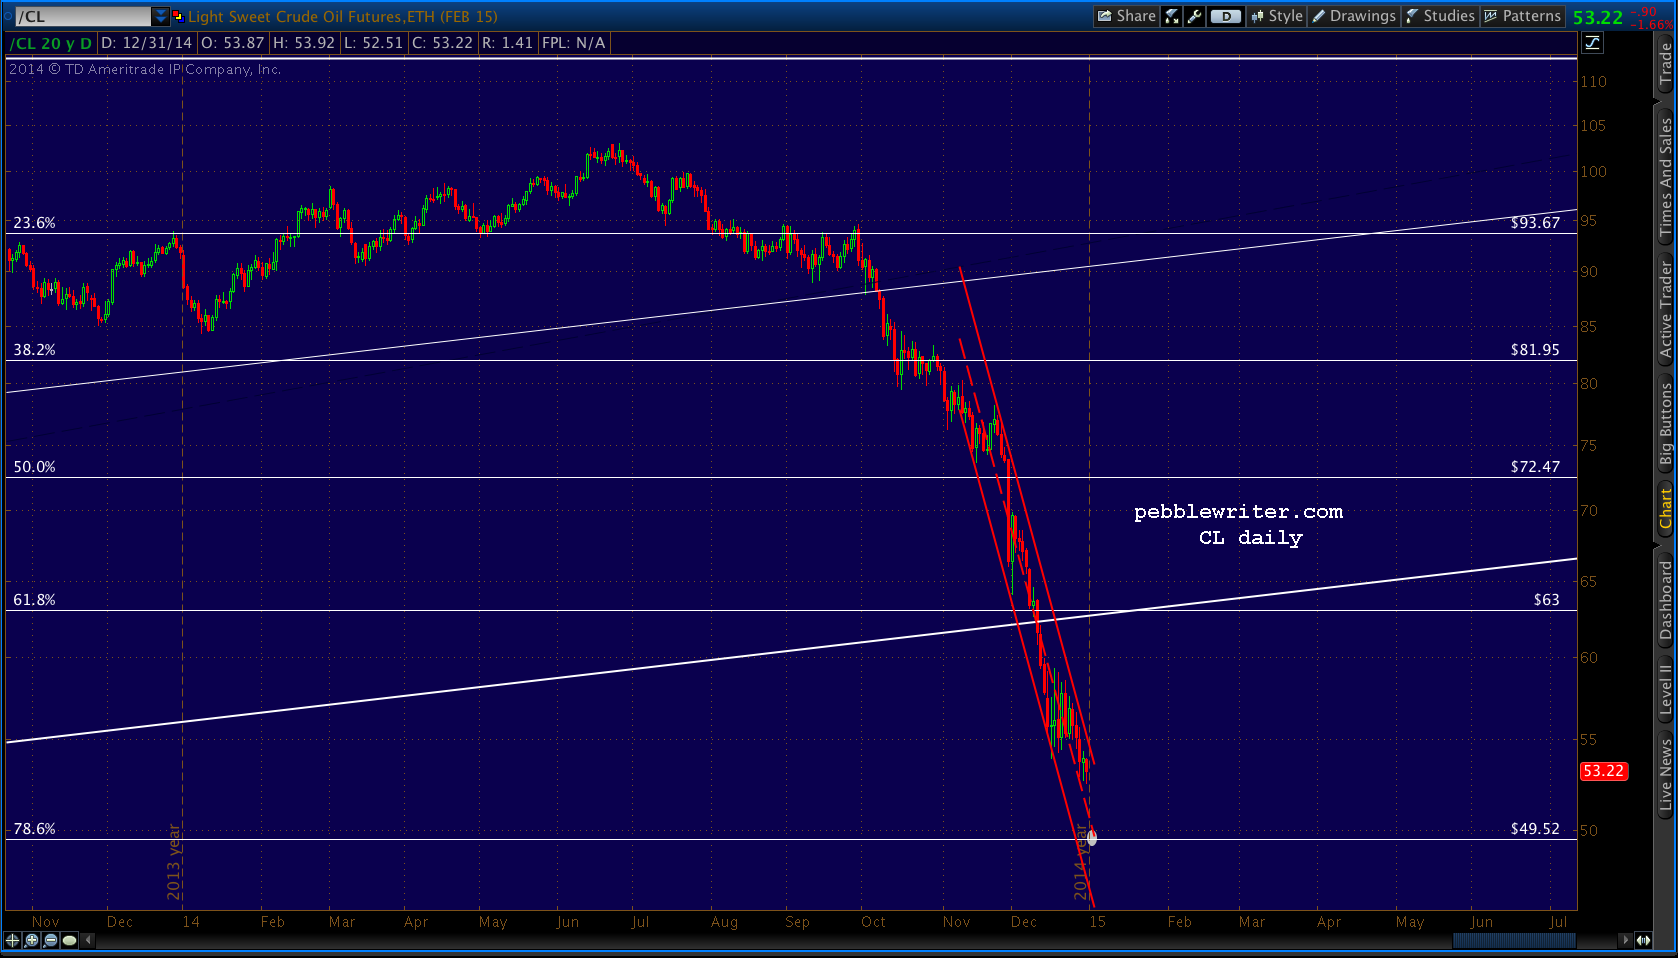
One potential game changer is oil, which overnight moved through and is now rebounding back to the TL from 1998 we identified last week [see: Update on CL Jan 7.]  If the decline is arrested in a meaningful way, it should provide a strong boost for the algos.

    2015-01-13-CL 60 0600The key price is around 46.11, though any break of the TL off 49 would be a great start.

    UPDATE:  9:40 AM

    SPX just sliced through the SMAs and tagged 2054.75.  It should top out between here and 2059 — the .886 of the drop and a backtest of the rising white channel.  I’d be very careful about chasing it any higher.

    2015-01-13-SPX 15 0640In the same vein, CL just reached the 1998 TL as drawn, intersecting with a smaller TL off last week’s highs.

    2015-01-13-CL 60 0700And, USDJPY just reversed back below a small TL off Friday’s highs it had momentarily broken through — demonstrating for the umpteenth time how sensitive the algos are to an uptick in USDJPY.

    2015-01-13-USDJPY 15 0705Will we get the drop to 117.57 now?  Stay tuned.

    UPDATE:  10:15 AM

    Nice reversal for SPX so far off its earlier highs.  Note the sensitivity to USDJPY — the thin purple line.

    2015-01-13-USDJPY 15 0716It always amazes me how sensitive SPX is to upside moves in USDJPY, now matter how minor.  In the old days (pre-2013!) moving averages mattered.  Today, just a hint of recovery for USDJPY is enough to blow through them like they weren’t even there.

    IMHO, this morning’s rally is overdone.  But, the algos are propping it up.  As such, I suspect any initial slide will be limited to a backtest of the SMAs — unless USDJPY reverses soon.  But, odds are its reversal will come after the close and not affect SPX.  Keep an eye on CL, which would work just as well in providing the levitation.

    UPDATE:  12:45 PM

    I underestimated the reversal.  Instead of the SMAs, SPX just conducted a backtest of the broken TL off the mid-Oct lows.  It should bounce here at 2037ish, as long as USDJPY will play ball.

    2015-01-13-SPX 30 0945USDJPY has reached the midline of the falling red channel.  The problem is that it should drop further.  But. again, that could happen after the close without affecting SPX.

    2015-01-13-USDJPY 15 0933If the TL doesn’t hold, we’re probably looking at 2019.

    UPDATE:  2:20 PM

    USDJPY did drop further, in fact right to our earlier target.

    2015-01-13-USDJPY 15 1119Which means SPX just nailed this morning’s target, too.

    2015-01-13-SPX 30 1119It’s a stunning 48-pt intraday reversal that happened much faster than I can hardly imagine.  Coming up, implications.

    continued for members

    (more…)

  • Charts I’m Watching: Jan 12, 2015

    SPX overshot Friday’s initial downside target of the SMA20/SMA50 levels, but bounced back to the SMA10 as expected just prior to the close.

    2015-01-12-SPX daily 0600

    USDJPY continues to bounce around south of the key .618, and fell right to the purple .886 at Friday’s close.  It dipped below yesterday, but bounced back above overnight.

    2015-01-12-USDJPY 60 0620Last night’s high helped legitimize the falling red channel, but it must still be taken with a grain of salt.  As sloppy as it looks, we’ve seen too many bounces back into the rising white channel to discard that bullish trend just yet.

    2015-01-12-USDJPY daily 0620And, though DX looks like it’s pulling back here, I can find no concrete chart pattern to serve as a ceiling at this price level.

    2015-01-12-DX daily 0600In fact, EURUSD looks like it has further to fall.

    2015-01-12-EURUSD daily 0600And, that’s the big question, isn’t it?  Whether or not the ECB will finally begin QE in earnest.  They’ve certainly talked it to death, and the MSM has dutifully reported even unsourced rumors as fact — much to the algo-driven markets’ delight.

    We won’t know until the 22nd.  And, since nothing else matters near as much as what central banks might or might not do, we should continue to see this pattern of consolidation continue.

    Targets coming up

    UPDATE: 10:00AM

    As I was generating a chart reiterating our second downside target from Friday, SPX just plunged to reach it.

    2015-01-12-SPX 60 0700From Friday’s 10:00AM post:

    Our 2046 target and the most interesting looking channel are seemingly at odds.  Perhaps a bounce at the SMAs and sideways for a while — ping ponging with the SMA10?  We’ll see.  One strong scenario would be a dip to the target we mentioned yesterday: the gap at 2029.61.  It’s roughly the purple .382 and would be a nice head fake.

    We’ll find out shortly whether or not it’s a head fake.  I suspect SPX might be in for a tag of the .618 at 2019, but the gap is closed.  So, we could get a bounce at any time.

    USDJPY plunged quickly, but is holding above the recent lows.  If it bounces off those lows, SPX should bounce up and backtest the moving averages (2045ish) at least.  If it continues to flesh out the falling red channel…look out below.

    2015-01-12-USDJPY 60 0705continued for members… (more…)

  • Charts I’m Watching: Jan 9, 2015

    Yesterday’s rally went beyond our target for SPX, topping out at 2064 before closing at 2059.  From yesterday’s pre-opening post:

    This morning’s surge looks likely to reach the SMA20 and/or SMA50 (in yellow) with the next major upside resistance the purple channel midline where it intersects the purple .618 and SMA10 at 2057ish.

    2015-01-09-SPX daily 0600The close-up:

    2015-01-09-SPX 15 0600As expected, USDJPY led the way.  The early morning sell-off was quickly recovered and a modest rally was maintained throughout the trading session — just enough to keep the algo reaction going.

    I suspect the sell-off in the last hour has been all about legitimizing the rising purple channel within the larger white channel.  But, the red channel is a factor to contend with until USDJPY breaks out — if it’s going to.

    But, it came undone overnight, briefly dipping below the rising white channel bound and giving additional credence to the falling red channel.  The key white .618 at 120.11 remains unscathed.

    2015-01-09-USDJPY 30 0600Futures followed along most of the night, off 7-8 just prior to the employment report, which provided a quick boost back to green — but, is since fading.

    continued for members(more…)

  • Charts I’m Watching: Jan 8, 2015

    I guess we’ll call this one the Evans Rally (as opposed to October’s Bullard Rally and December’s Yellen Rally. Last night, Charles Evans told reporters that  “raising rates would be a catastrophe” and hinted that the first rate rise wouldn’t come until 2016 or later.

    This came barely 6 hours after the Fed’s minutes were released — the same minutes that pointed an accusatory finger at the ECB and BOJ for talking up markets:

    In their discussion of financial market developments, participants observed that movements in asset prices over the intermeeting period appeared to have been importantly influenced by concerns about prospects for foreign economic growth and by associated expectations of monetary policy actions in Europe and Japan.

    Oh, well; it ties a nice, pretty bow on our forecast.  Yesterday’s call was for a backtest of the rising wedge lower bound.  From the members’ section:

    The biggest obstacle will be that white TL off the October lows.  Originally support for a potential rising wedge, it is now resistance. I show it at around 2020-2022, which would mean a pop and drop this morning.  If SPX is able to clear it, then it should be good for a return to test the SMA50 and/or SMA20 at 2041/2044.  Otherwise, our downside targets start to look more interesting.

    So far, SPX is following that script pretty closely.  The original backtest was at 2024 (in white, below), a smidge over our target, whereupon SPX tumbled to 2012 before being rescued by USDJPY.

    2015-01-08-SPX 15 min 0605This morning’s surge looks likely to reach the SMA20 and/or SMA50 (in yellow) with the next major upside resistance the purple channel midline where it intersects the purple .618 and SMA10 at 2057ish.

    2015-01-08-SPX daily 0605But, there’s a development that could undermine that thesis quite easily.

    continued for members(more…)

  • Charts I’m Watching: Jan 7, 2015

    After yesterday’s sharp intra-day reversal, we identified SPX’s SMA100 and the round number 2000 as downside targets.  It was touch and go, but SPX closed 2002.61 — just a smidge under the moving average.

    2015-01-07-SPX daily 0600As we’ve long maintained, the key to a bounce was USDJPY, which initially held key support — but ultimately broke down.    From yesterday:

    The problem child is USDJPY, which has dropped below the purple .886 yet again.  It’s tough to tell when this highly-manipulated currency pair is producing a head fake or is legitimately in trouble.  Need we remind readers that the pair is now well below the key .618 at 120.11?  The next support is the red .500 at 118.18.

    Thankfully for the bulls, USDJPY snapped back to the rising white channel overnight.

    2015-01-07-USDJPY 60 0615And, the 10-yr bounced as expected.

    2015-01-07-TNX 60 0600

    Oil even rebounded overnight, though it didn’t quite reach the TL as drawn.  But, as discussed in yesterday’s post, there’s a certain margin of error when drawing a TL over a 20 year time span.  The key will be getting back above the white .786 at 49.52.

    2015-01-07-CL daily 0630As such, we’re looking at SPX’s bounce finally getting underway this morning.  But, it’s not out of the woods just yet.

    continued for members(more…)

  • Update on Oil: Jan 6, 2015

    A little over a month ago, we wrote that crude light (CL) had reached a two month-old target and what appeared to be a potential buying opportunity: the intersection of a key Fibonacci level and a long-term channel bottom.

    2014-12-01-CL weekly 0800

    We were pleased with that call…until the rebound ran out of gas only a day later.

    Some say the continued decline is Saudi Arabia’s way of bringing US shale growth to a screeching halt.  Others suspect that it’s the US government at work, tanking Russia’s oil-dependent economy.  It’s also possible that that chart, for all its symmetrical beauty, was drawn in the wrong scale.  I’ll explain.

    I chart just about everything in logarithmic scale — particularly those charts that span a long period of time and contain large swings in price.  But, once in a while — for no particular reason — an arithmetic chart just makes more sense.

    Here’s the updated chart in logarithmic scale in all its channel-busting ugliness.

    2015-01-06-CL wkly log 1400Switching to arithmetic scale, it’s obvious that the white channel doesn’t even belong.  Before clicking back to that cat video, though, check out the alignment of the 1998, 2001 and 2009 lows — connected here by the yellow dotted trend line.

    2015-01-06-CL wkly arith 1400A trend line that goes back that far is certainly subject to placement error (to use the tails or not?)  But, simply connecting the Dec 12, 1998 and Jan 15, 2009 lows puts that TL at about 45-46 — a couple of points below today’s low — and, not too far from the white .786 Fib.

    Does it matter?  We’ll find out in the next few days.  If nothing else, it’s a good reminder to check out the alternative view from time to time.  A casual perusal of the blogosphere reveals plenty of folks who chart arithmetically.  Maybe this is one of those times when log scale wasn’t the best choice.

    Suppose CL drops below 46.  What then?

    We discussed the bleak channel and TL standpoint.  From a price Fibonacci standpoint, the next major support is another 13% lower — the white .886 at 41.49.  A time Fibonacci chart shows that the June 2014 highs (the red 1.618) were right in line with the major low in 1998 and high in 2008.  In other words…also bearish.

    2015-01-06-CL wkly arith 1430

    And, it’s probably not too crazy to start talking about the purple Fib lines.  If the 2009 low of 32.34 is broken, the purple .886 at 26.13 is pretty much the last line of defense until the 10.65 lows from the (drumroll, please) Last Century.

    Regardless of whether one looks at log or arith charts, the strong positive correlation between oil and stocks (SPX, in purple below) over the past 20 years is obvious.  It broke down this past year when stocks decoupled from, well… just about everything.

    But, given the level of financial institution involvement with the oil industry ($550 billion in bonds and loans since 2010), it’s probably safe to say that a continued slide in oil can’t help but leave a mark.

    2015-01-06-CL wkly arith 1440Stay tuned.

  • Charts I’m Watching: Jan 6, 2015

    USDJPY reached the bottom of the white channel — and then some — slightly overshooting our 119 target.

    2015-01-06-USDJPY daily 0615We identified 119.07 as the line in the sand, and it’s hovering right there this morning.  Meanwhile, SPX reached our 2018.78 target.  From yesterday morning’s post [members’ section]:

    As such, I’m looking for an initial bounce at the red .618 at 2038 (also just below the SMA50), followed by a dip to the white TL mentioned above (2018.78 if it happens today or tomorrow, otherwise 2030.)

    We called for a bounce there, and the rebound I’m expecting in USDJPY should accommodate one.  Keep an eye on 118.59 — the purple .886.

    On the oil front, CL reached our 49.52 target overnight. 2015-01-06-CL daily 0700And, TNX is nearing its ideal bounce point — the red .886 at 19.27 (though 19.79 would also work.)

    2015-01-06-TNX 60 0640But, currencies should rule the day.   EURUSD is still hovering above the Jun 2010 lows.  And, DX remains above our 90.272 target in what looks like a channel break out.

    Stay tuned.

    UPDATE:  11:00 AM

    That nice 13-pt bounce was just undone by lower rates, oil’s continued weakness and USDJPY’s drop through 118.59.  Note that PMI, ISM and factory orders all disappointed.

    2015-01-06-SPX 60 0800It’s possible the purple .382 will hold, but it will require a reversal by TNX and USDJPY.  The stronger support is at the SMA100 at 2003.77.

    2015-01-06-SPX daily 0800

    UPDATE:  11:50 AM

    TNX just reached our 19.27 target…

    2015-01-06-TNX 60 0847…at about the same time as SPX reached the SMA100 identified in the above update…

    2015-01-06-SPX daily 0847…and, VIX is nearing the purple channel midline.

    2015-01-06-VIX 60 0848The problem child is USDJPY, which has dropped below the purple .886 yet again.  It’s tough to tell when this highly-manipulated currency pair is producing a head fake or is legitimately in trouble.  Need we remind readers that the pair is now well below the key .618 at 120.11?  The next support is the red .500 at 118.18.

    2015-01-06-USDJPY 60 0848The bulls should be expected to try and hold SPX 2000, but it would require that all the above reverse muy pronto.  According to Bill Gross, who draws a slightly higher readership than yours truly, we shouldn’t hold our breath.  In his just-released annual outlook, he tells investors “the good times are over.”

    I certainly have no qualms with his macroeconomic and market fundamentals reasoning.  I’ve thought the same for quite some time.  But, IMHO, the “good times” can be extended for as long as central bankers are willing to continue shoveling moolah into the banking system (as opposed to “the economy”) and the BoJ is willing to continue trashing the yen.

    The rest is shoulda-coulda-woulda.

    continued for members(more…)

  • Charts I’m Watching: Jan 5, 2014

    The downturn we called for last week has exceeded our expectations — the most bullish target proposed on Dec 31.  Why?

    2015-01-05-SPX 0600Stocks can handle the troublesome economic news and sketchy geopolitical developments out of the euro zone.  They can even handle lower crude prices.  But a USDJPY that’s — again! — back below the key .618 we’ve been watching?  No way.

    2015-01-05-USDJPY v ES 60 0600The futures are currently down almost 10 points, which points to a retest of Friday’s lows at the very least.  Beyond that, we have to wonder whether USDJPY will remain in its rising channel.  The line in the sand looks like 119.07.

    TNX continues settling toward our Dec 31 target.

    2015-01-05-TNX daily 0640And, crude light is closing in on its next target.

    2015-01-05-CL daily 0646

    continued for members

    A failure to snap back above 120.11 at this point would be troubling to the bulls case, and most likely result in a dip to support at 2038 or 2019.  The channel picture is a mess at present, so we’ll stick with Fibs, daily moving averages and the white TL off the Dec 16 lows.

    As such, I’m looking for an initial bounce at the red .618 at 2038 (also just below the SMA50), followed by a dip to the white TL mentioned above (2018.78 if it happens today or tomorrow, otherwise 2030.)

    The dollar is showing plenty of strength, shooting up past the .382 (adjusted for contract change.)

    2015-01-05-DX daily 0700It’s all on the back of the euro’s weakness — which does nothing for the yen carry trade crowd.  The EURUSD briefly dipped below its Jun 2010 lows this morning.

    2015-01-05-EURUSD daily 0646UPDATE:  1:30 PM

    SPX just tagged 2019.28, very close to our 2018.78 target.  We should get a nice bounce here.

    2015-01-05-SPX 60 1037 2015-01-05-SPX daily 1030CL hasn’t quite reached the .786.  A bounce in CL would support a more significant rebound in stocks.  A little more downside to 49.52 would help SPX with a more precise tag of the .618 at 2018.78.

    2015-01-05-CL 60 1042

  • Charts I’m Watching: Dec 31, 2014

    USDJPY continues to bump along the .236 white channel line — working its way back toward the .618 at 120.11.

    2014-12-31 USDJPY 60 0620

    The fact that it didn’t snap back has to be viewed as a bearish development.  Though in the light volume and holiday-shortened sessions ahead I wouldn’t try to take that to the bank.  After all, the one constant from this past year has been the ability of TPTB to turn “markets” on a dime.

    Follow-through on the downside has been awfully hard to come by.  Having said that, there’s still a decent case to be made for lower stock prices based on chart patterns.

    continued for members

    The 10-yr looks like it could be headed back below 2%.

    2014-12-31 TNX daily 0715VIX looks likely to tag the 16.75 mark before the 13.09.

    2014-12-31 VIX daily 0715Oil probably has a little further to fall, with CL 49.52 our next target.

    2014-12-31 CL daily 0715And, DX is long overdue for a tumble after tagging the yellow .382 over a week ago.

    2014-12-31 DX daily 0715At this point, it’s hard to say what sort of reversal, if any, SPX might see from the above.  The most bullish would be to backtest the white 1.272 at 2073.28.  The SMA10 is currently at 2073.19, so that looks like a fairly safe bet.

    2014-12-31 SPX daily 0823If it works its way lower, the broken, red TL connecting the previous tops is now crossing the purple .886 at 2067.28.  A backtest there would make sense, as the previous attempt to backtest it failed (resulting in a 107-pt loss that was quickly erased.)

    The diagonal channel lines running through the above chart are pure guesstimates.  The red one looks fairly legit, but it only goes back to mid-2013.  The purple one attempt to connect the 2009 and 2010 lows, and I’ve had a tough time making sense of it on either an arithmetic or log scale.

    As for the (more likely) upside target, it remains 2138-2145.  The timing has been greatly complicated by the sideways action of the past week.  But, an intermediate reversal at 2108.55 (purple 1.272) would delay a tag until mid-Jan or later, possibly as late as mid-Feb.  We’ll first need to see how much of a decline comes in the week ahead.

    Note: I’m working on a bigger picture forecast for the months and year ahead, and hope to get it posted in the next few days.

    GLTA.


  • Charts I’m Watching: Dec 30, 2014

    USDJPY dropped over 1.25% overnight, so the e-minis (thin purple line) followed right along — to a point.  Note the floor under ES that corresponded with USDJPY reaching the purple .618 and white channel line on the 60-min chart below.

    2014-12-30-USDJPY v ES 60 0600The daily chart for the past year better shows the steepness of the white channel, as well as USDJPY’s overall impact on stocks.

    2014-12-30-USDJPY v ES daily 0600As we’ve pointed out for the past several weeks, the white .618 is a major Fib retracement.  Any meaningful drop below it — such as we’re seeing right now — represents a real threat to the carry trade which has fueled virtually all of SPX’s gains since late 2011.

    The floor (yellow arrow) established under USDJPY for most of 2014 provided regular boosts to ES/SPX.  And, when USDJPY finally broke out of that triangle in July, SPX soared to new highs.

    The mid-October stick save in SPX (thank you Jim Bullard) was facilitated by USDJPY’s  backtest of the January highs (and, an important Fib.)

    And, stocks’ subsequent breakout to new highs was made possible by USDJPY’s massive Oct 31 move (thank you Kuroda and Abe.)

    Looking at the weekly chart below, it’s pretty easy to see where the BOJ’s massive easing began.  Remember the meltdown of July-Aug 2011?

    I wasn’t really watching USDJPY back then, as it was generally in freefall even before Fukushima (the purple arrow.)  But, that floor established by the BOJ at 75 was the very start of the yen’s decimation and an extremely successful campaign to boost stock prices.

    2014-12-30-USDJPY v ES weekly 0630 LTAs one of the only analysts to accurately forecast that 23.8% correction, it never occurred to me that the failure of SPX to reach my 1040 target (SPX fell from 1370 to 1074) was greatly influenced by the Oct 31, 2011 spike in USDJPY — the largest since 2008 and one of only two that exceeded the Oct 31, 2014 spike. Hmm…