Stocks faded quickly after the open yesterday — testing the moving averages on both the upside and downside as expected.
 USDJPY had reached the upper bound of a falling channel.
If the upper bound holds, then this morning’s rally in stocks should burn out quickly after testing the SMA10.
SPX pushed a little past the SMA10 before dropping fast to the TL we had drawn and testing the SMA100.
…meaning SPX should find support at the white TL after this morning’s sharp reversal. If not, the SMA100 is just below at 2007.85.
We’ve replaced the TL with a rising white channel in the expectation that the uptrend will continue if the 93% who expect the ECB to bring massive QE to the “market” are correct.
Overnight, USDJPY’s rising wedge finally broke down, meaning stocks should open lower today. The rising white channel bottom makes for a convenient initial target.
 Note that the channel picture for USDJPY is still negative — though we should be wary of a bounce off the falling red channel (in a backtest.)
 One cloud hanging over stocks is ECB Governing Council member Nowotny’s comment that central bankers and policy makers should retain a longer-term perspective and “have a bit of a relaxed attitude to news and not to get too excited about the events of one day.”
Maybe it’s just me, but this doesn’t sound like a guy about to unleash massive amounts of QE.
UPDATE: 9:37 AM
Got the lower bound bounce right on target.
 USDJPY rebounded .35 off this morning’s lows, bouncing off the broken red channel as discussed above.
Now for the upside targets…
continued for members…Note that the moving average picture is still somewhat negative. In this chart from earlier this morning, we can see the SMA10 has crossed below the 20 and 50. SPX tested the SMA100, with the 200 just below. I’ve stripped out everything except the moving averages and Fib levels in the chart below.
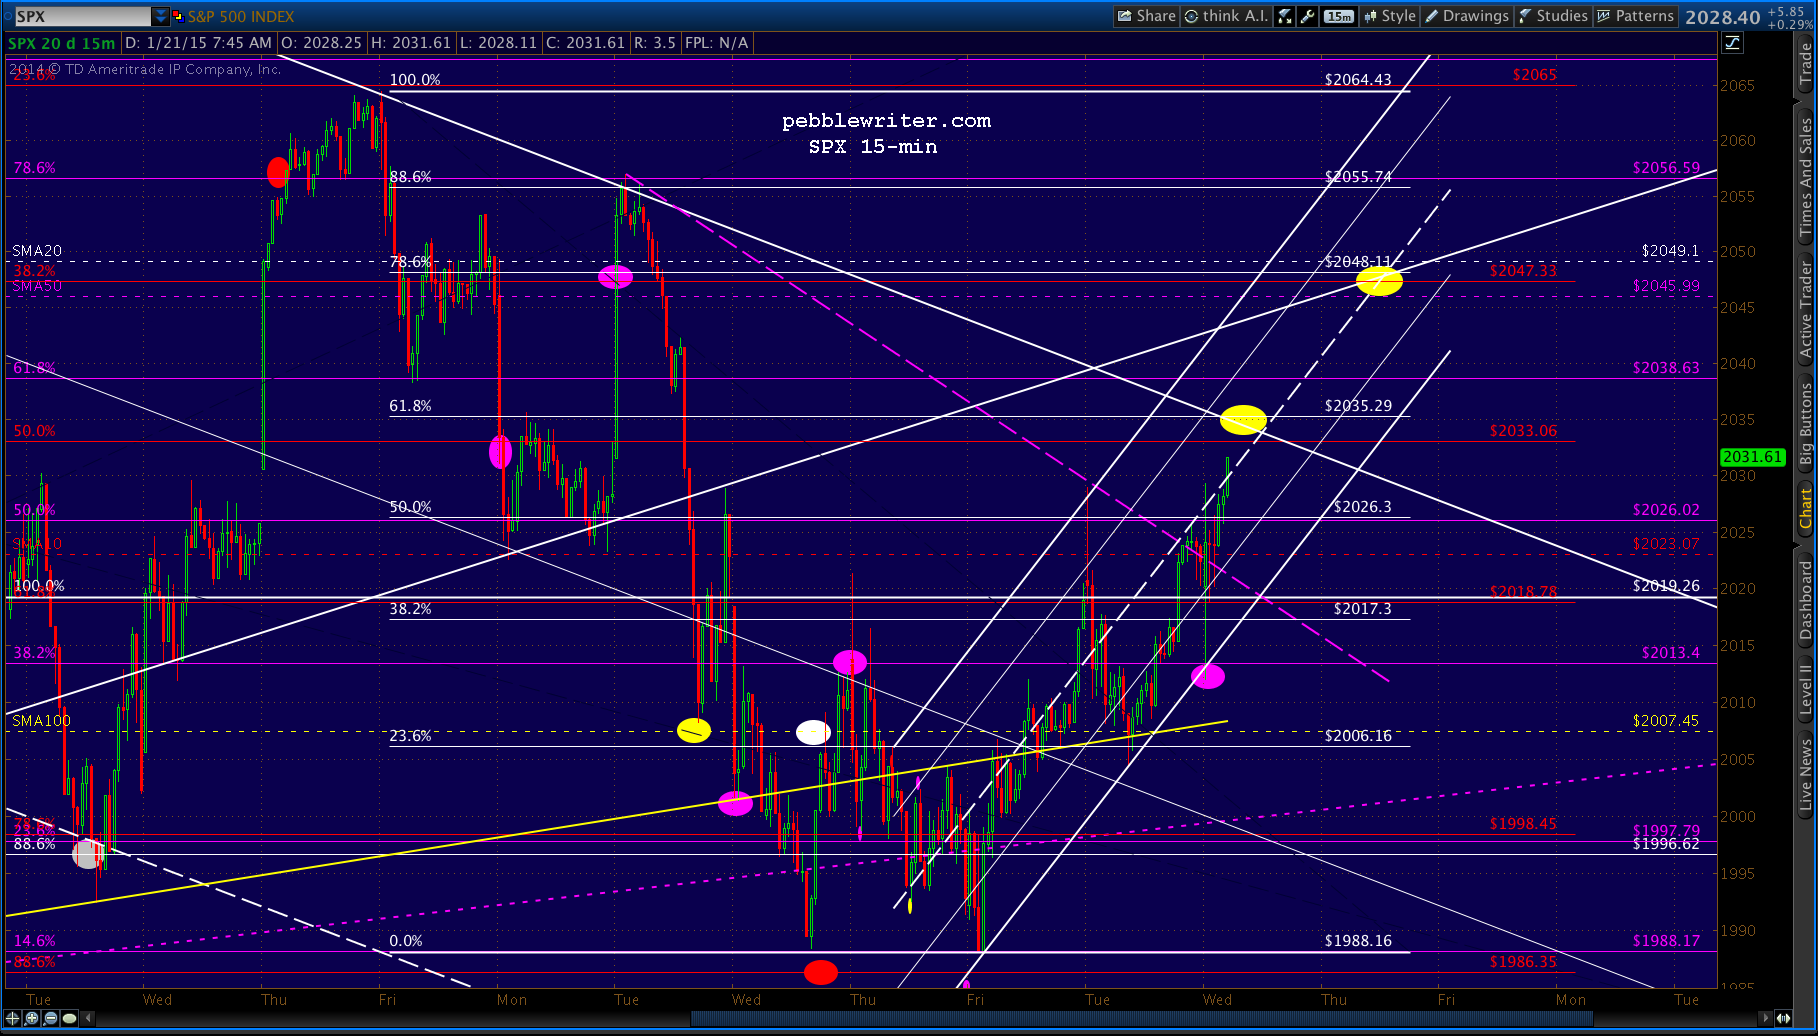
 Whatever bounce we get this morning will have to contend with the SMA10 again. If it can push through, then yesterday’s 2042-2047 target area is very much in play.
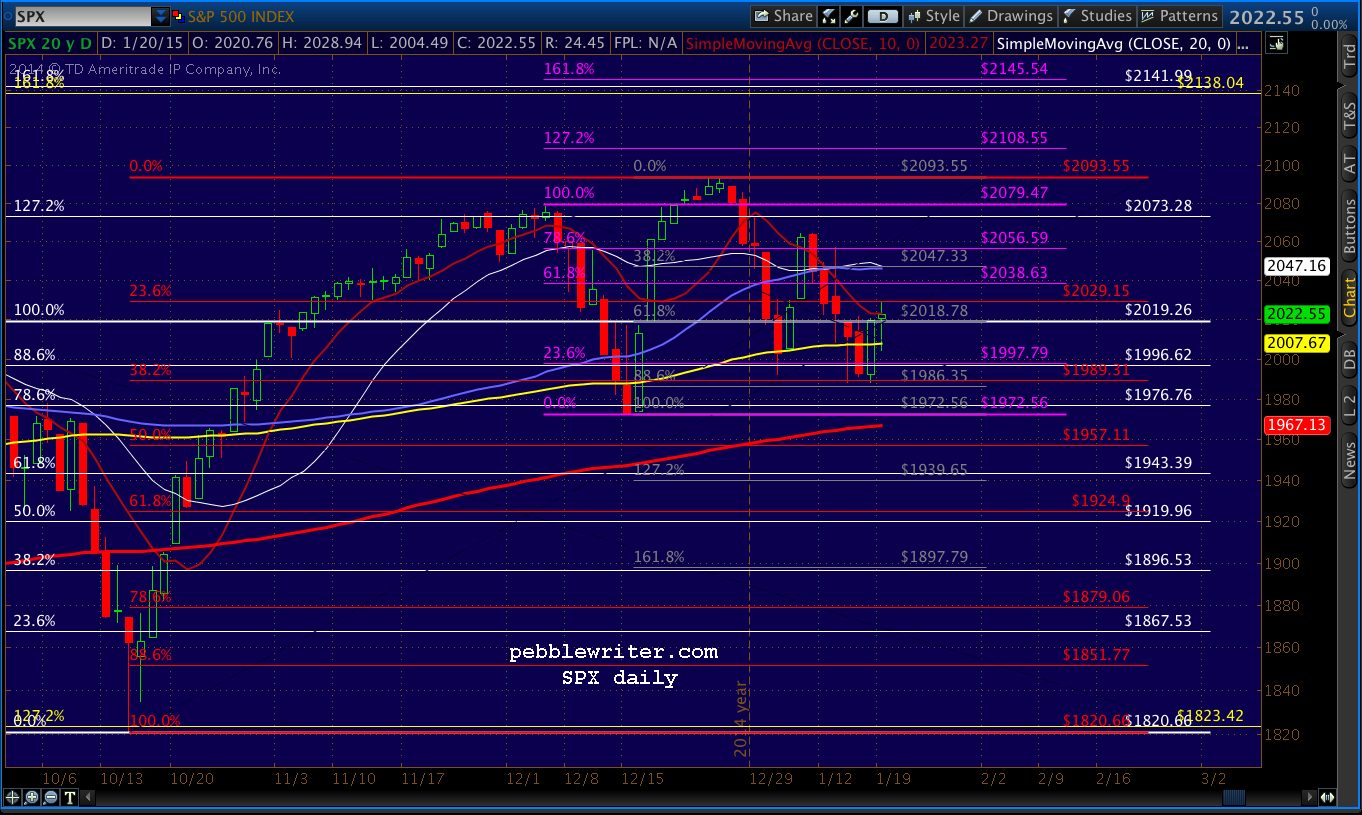
The Fib picture to the upside is clear: 2138-2145. The yellow 1.618 is the big kahuna, with the white 1.618 right there with it. We can make a pretty good argument for the white 1.618, but, it’s one of the most convoluted Fib patterns I’ve seen lately — with virtually no points B and C to speak of.
The downside is trickier — thanks chiefly to that slightly higher push around Christmas. In a bearish pattern, that second high should have been lower than the first. Nevertheless, the red grid offers multiple downside targets should the ECB disappoint.
More later.
UPDATE: 10:50 AM
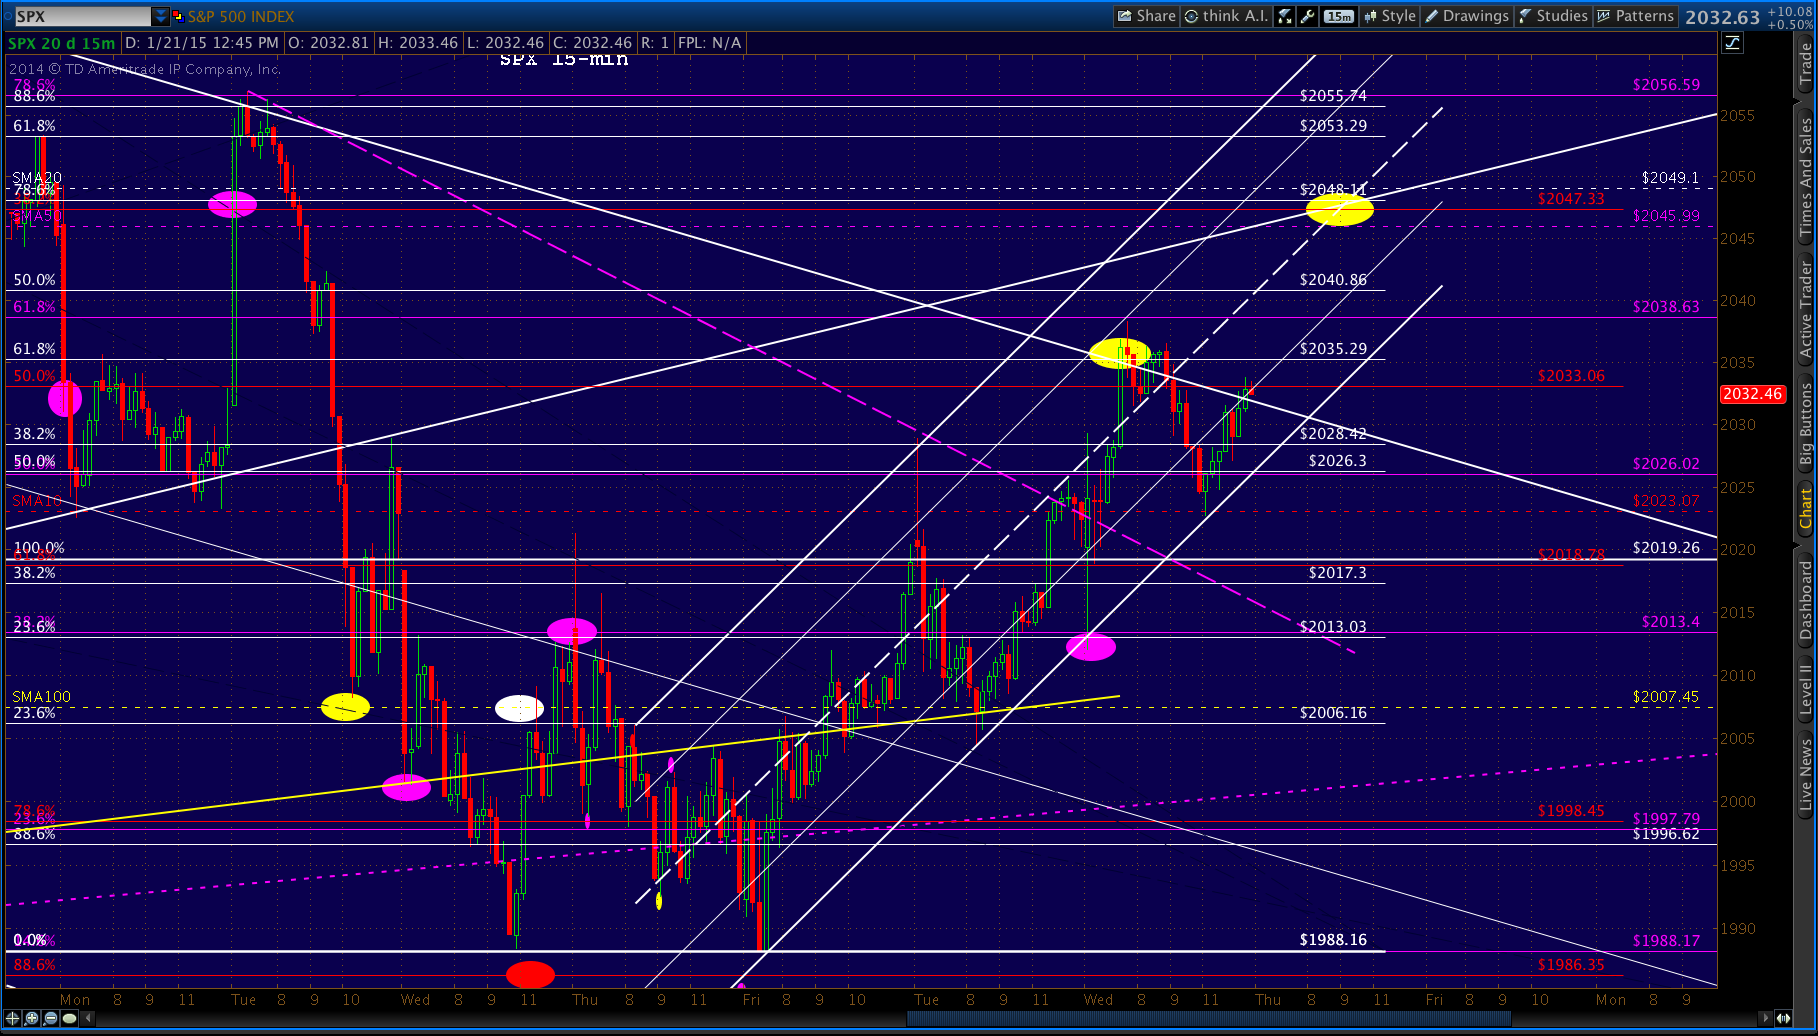
Coming up on the .618 of the last drop (2035.29) which will be the next test for SPX (I had it marked at 2038 earlier; either could work.) We should see a reaction here, but hard to say how much. It could be just a small one, backtesting the rising white channel midline around 2030ish. If that doesn’t hold, maybe the .500 at 2026 and then the purple TL at 2019.
 UPDATE: 2:15 PM
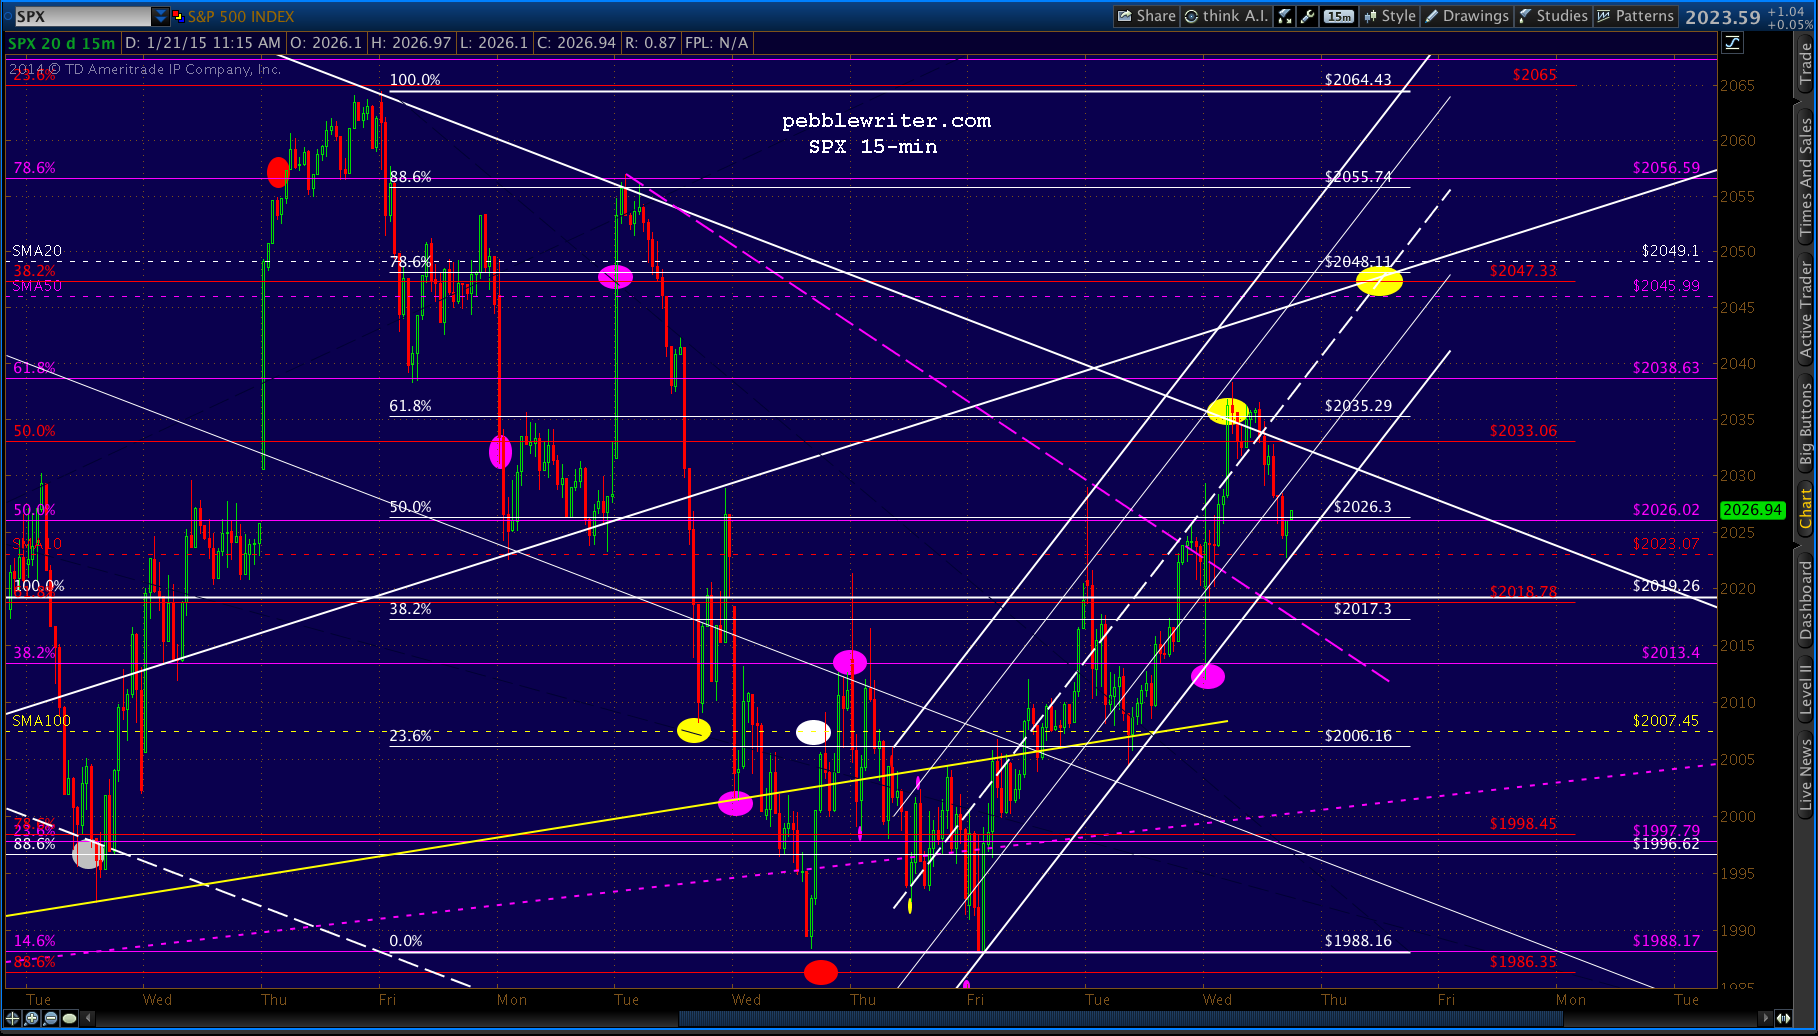
SPX just tagged the SMA10 at the rising white channel bottom (2022.) This is a good turning point for the next leg up, whatever it might be. Any breakout should target the SMA20/50 as detailed above.
 Believe the ECB will come through tomorrow? A long trade here makes perfect sense. Believe they’re yanking everyone’s chain? Cash or short. Personally, I wouldn’t bet either way. There’s no need to be long or short, as the direction post-announcement will be perfectly clear and should be tradeable.
UPDATE: 3:50 PM
Top of the channel, right on the money. 2033 looks like a good place to step aside and see how things go in the a.m.