Author: pebblewriter

  • Analog Update: Jan 10, 2017

    We came within 0.7% and 1 day of our analog’s forecast top before things started rolling over yesterday.  Our latest iteration had 2298 on Jan 5, and we hit 2282 on Jan 6.  2017-01-10-spx-daily-analogNow that we’re here, it’s a good time to review the rest of the forecast, and see if our last downside targets still make sense.

    continued for members… (more…)

  • So Far, So Good

    Friday was one of those days that perfectly confirmed how rigged this market has become.  As I wrote in Moving Averages Rolling Over:

    Our initial target is the SMA5 200 at 2263.63, followed by the SMA10 at 2259.44.  The SMA20 is just below at 2258.84.  Unless SPX makes nice gains in the next six hours, its 10/20 cross will happen today as well.

    SPX reached 2264.06 before the ramps in both USDJPY and CL kicked in and VIX got hammered down to a 10 handle.  The net result: the SMA10 and SMA20 both ended up at exactly 2260.62.  So, technically, no rollover just yet on SPX.

    This was predictable, and follows our conversation later in that post:

    …when a bearish 10/20 cross is about to occur, we often get a sudden rise in SPX, followed by the drop a few sessions later.  When this occurs, it’s because those in the know (CBs and other insiders) are positioning themselves ahead of time.  They do this by running stops and getting short (or at least hedging) while others are scrambling to cover.

    2017-01-06-spx-moving-averages

    Today’s action will be telling, not only in terms of SPX’s support mechanisms (USDJPY — which did roll over — backtested the rising white channel as expected) but our analog, first posted last August, which originally forecast a top for Jan 5.
    2017-01-09-susdjpy-60-0600

    I will be taking the day off today, as we had a death in the family and I have relatives coming into town.  Nothing important has changed since Friday’s charts.  Our downside targets remain unchanged.

    GLTA.


  • Moving Averages Rolling Over

    Yesterday was another one of those days when the folks minding the store got a little over-anxious.  A simple backtest of SPX’s 10-day moving average never happened because CL and NKD started ramping prematurely.  Could it have been the bearish moving average crosses that got them so nervous?2017-01-06usdjpy-daily-mas

    continued for members(more…)

  • Our Analog Grows Up

    It was over five months ago that I first suggested our current analog [see: A New Analog Aug 3, 2016.].  It was unlike many of the past ones in that it suggested a tortured path to higher prices.  As of yesterday, we were within 1% of our upside target, with today being labeled a likely high.

    The most notable development overnight was that USDJPY finally broke down.  To paraphrase Ron Burgundy, this is kind of a big deal.  After a month-long very steep post-election ramp job, and another month of less-steep ramping, this is a trend break that shouldn’t be ignored.2017-01-05-usdjpy-60-0656 Will we get another gasp higher as our analog allows, or is the party finally over?

    continued for members

    (more…)

  • Algos Still Going Strong

    VIX has been spanked by over 14% since Friday afternoon, aiding a bounce in stocks that breaks plenty of chart pattern rules.  Yesterday, it did more than backtest the falling white channel.  It broke down, back into the channel overnight — all in order to ensure another gap higher today.2017-01-04-vix-60-0615

    Combined with well-timed bounces in USDJPY and CL, we’ve seen backtests develop in SPX that would ordinarily mean a downturn.  It wouldn’t be such a big deal if they weren’t setting up in practically everything I chart.

    continued for members

    (more…)

  • Charts I’m Watching: Jan 3, 2017

    A very Happy New Year to our members this morning!  I wish all of you a prosperous 2017!

    The New Year is off to a bang with oil and USDJPY spiking higher and VIX backing off after tagging our SMA200 target.2017-01-03-vix-60-0615

    In other words, more of the same…so far.

    continued for members(more…)

  • Happy New Year?

    The S&P 500 is up over 10% for the year (well…if it closes above 2248.33.) Is it time to break out the champagne and party hats?  We’ll take a look at how stocks got to where they are, and what to expect in the coming year.

    The Ascendency of VIX

    One of the biggest developments this past year was central banks’ perfection of VIX as a tool to drive stocks higher.  Long considered a good indicator of risk in the markets, VIX is now being used as a tool to ignite momentum-driven algos that push stocks higher.

    Those of us who follow VIX closely have seen this coming for a while.  Even Main Street analysts have noticed the VIX-smashing that frequently occurs in the last hour — or, even minutes — of trading.  But, 2016 saw TPTB take it to a whole new level — with major losses averted by timely, trend-changing collapses in VIX.

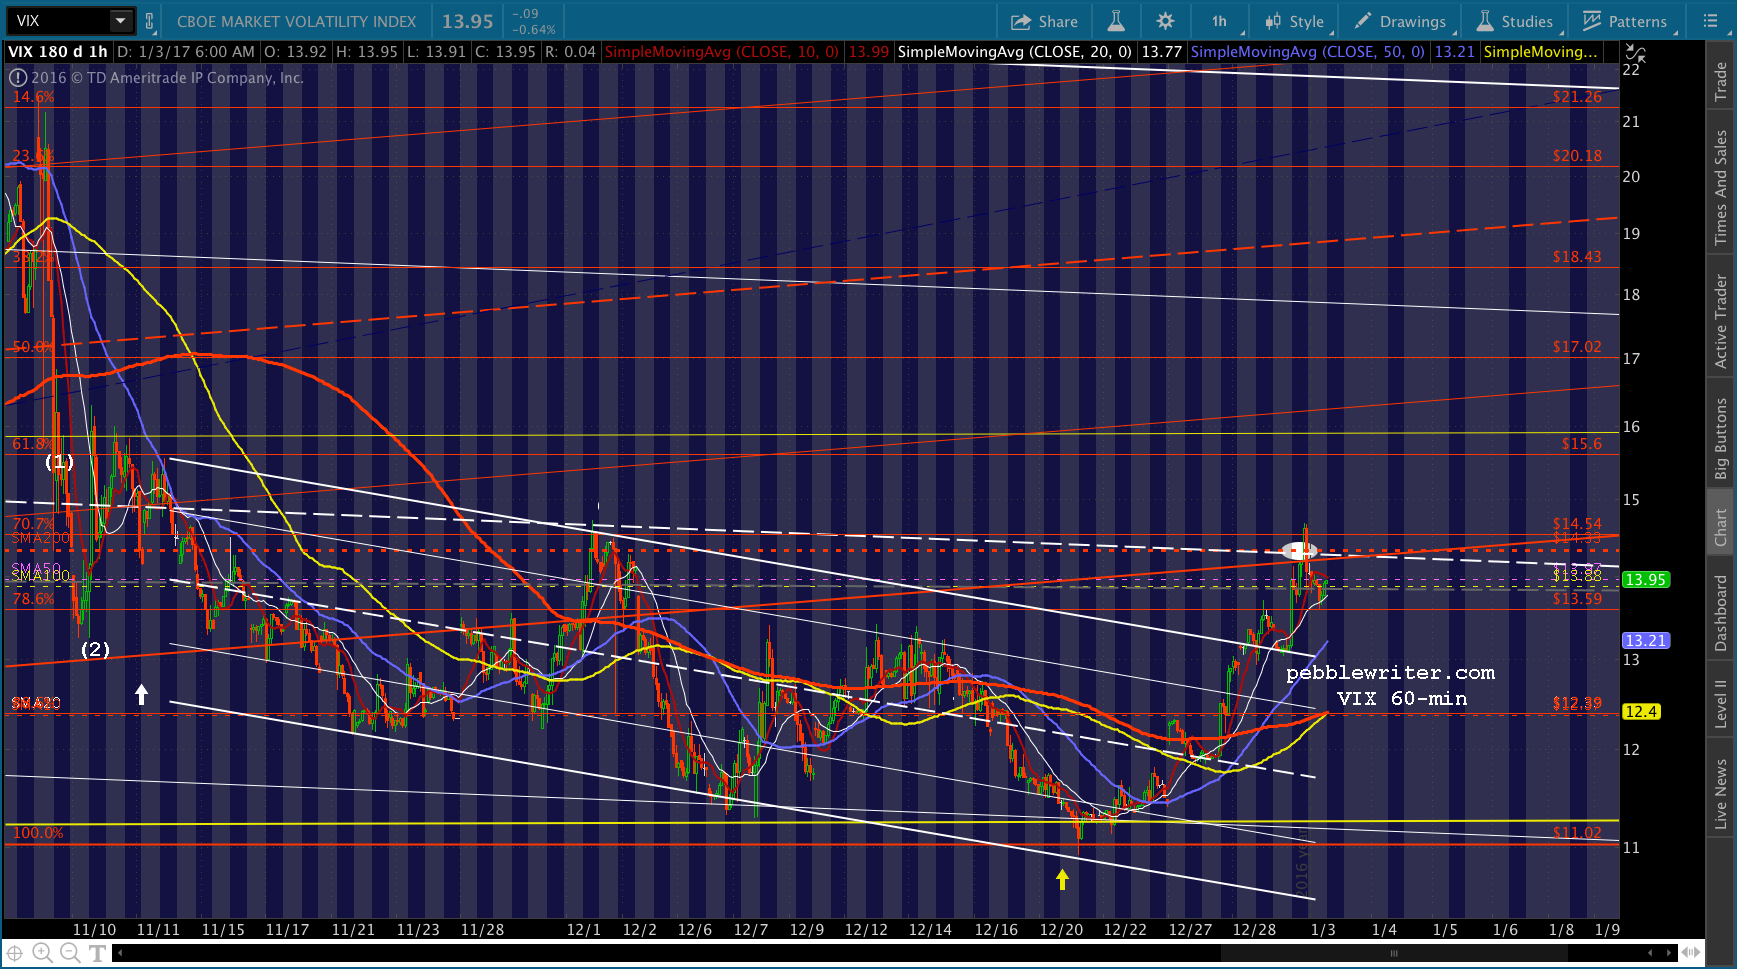
    In addition to a well-crafted falling channel (below, in white), VIX’s chart illustrates two major trend breaks (the white arrows.) 2016-12-30-vix-2016

    The first occurred on Mar 16, when VIX gapped below a 7-month rising trend line to help establish a new falling channel.  It might now have seemed that significant at the time.  But, it helped SPX break out past major hurdles: a trend line off its Dec 2015, pre-Fed hike highs, and the 200-day moving average.  Instead of continuing lower, SPX’s rally continued up to its 2015 highs, eventually topping them.2016-12-30-spx-mar-15-2016

    The second incident occurred in the wake of the US election.  VIX had climbed steadily from 12.73 to 23.01 in the days leading up to the election.  On election night, however, as it became apparent that Trump was going to win, futures began a massive sell-off (124 points, or 5.7%.)2016-12-30-es-election-results

    Instead of spiking higher to reflect that panic, VIX suddenly collapsed — the very opposite of what should have happened.  Honestly, I mean, who panic-sells VIX in the midst of a 5.7% bloodbath in equity futures!?2016-12-30-vix-v-es-election

    And, they did it twice.  The first time, VIX was hammered from 20.35 to 15.73 in a matter of minutes, which stopped ES’ bleeding.  But, traders bid VIX right back up to 21.17.  So, VIX was hammered a second time, this time a more gradual affair that didn’t really end until December 21, where it finally reached a trend line going back years.

    November 9 was the single biggest daily drop in VIX since May 25, 2010, when VIX was hammered over 9 points (a total of 24 points in 4 days!) to successfully prevent a similar melt-down in stocks.  The net result this time: not only did SPX avoid following through with the futures’ earlier action, it pushed up to new, all-time highs.

    2016-12-30-spx-vix-effect-election

    continued for members... (more…)

  • Channeling a Rally

    The Nikkei 225 (NKD) makes a great statement about the silliness of the past seven weeks.  Like US equity futures, it fell apart on election night, only to be resurrected by algos tied to the prices of oil, which rallied 27% off its lows, and USDJPY, which rallied 17%.  2016-12-29-usdjpy-60-0605

    NKD’s subsequent price action was, to put it mildly, absurd.  It was as though the dip never occurred, and was thus irrelevant to the ridiculously steep, rising channel [in what universe is the election of a protectionist president bullish for one of America’s biggest trading partners?]2016-12-29-nkd-60-0559

    When USDJPY reached our upside target two weeks ago, we waited for the other shoe to drop.  Surely, it would retrace some of its gains, if only to flesh out the channel.

    When the red channel finally broke down a few days ago, though, it continued sideways — until yesterday, when it finally dipped just enough to tag the bottom of an expanded channel that captures most of the Nov 8 dip.2016-12-29-nkd-60-0600

    The net result: an unbroken rising channel where the “drop” to the channel bottom didn’t produce any lower lows.  Mission accomplished.  And, just in time, as the end of the year is right around the corner.

    People often ask me if charts still work in an era where “markets” are so easily controlled by central bankers and algos.  Once you discount the extent to which prices are determined by fundamentals, it opens up a lot of opportunities in forecasting.

    No, it’s not like it was 3-5 years ago.  But, in some ways, it’s easier to anticipate what the guys plotting out the “markets” have in mind.  They usually still care about maintaining a veneer of normalcy — a facade of efficient markets.  Often, that’s enough information to guide our forecasts.

    continued for members(more…)

  • Charts I’m Watching: Dec 28, 2016

    This is the time of year when charts get downright silly.  Stock prices, which are highly susceptible to algo-linked manipulation anyway, are completely under control in this low-volume environment.

    A casual glance at the USDJPY chart bears this out.  It’s nothing but a series of breakdowns which morphed into breakouts.   The only saving grace of such an environment is that it sets several juicy trading opportunities for the new year.2016-12-28-usdjpy-v-es-60-0630While indices never dipped appreciably as they might have in the middle of the month, our upside target remains unchanged and our analog remains on track.

    continued for members(more…)

  • Happy Holidays!

    We will be closed for the holidays December 22 – 27.

    I want to wish all our friends a very merry Christmas.  Whatever your faith tradition, may this season be filled with peace, joy and hope.

    “Adoration of the Shepherds” by Gerard van Honthorst, 1622