

The Nikkei 225 (NKD) makes a great statement about the silliness of the past seven weeks. Like US equity futures, it fell apart on election night, only to be resurrected by algos tied to the prices of oil, which rallied 27% off its lows, and USDJPY, which rallied 17%. 
NKD’s subsequent price action was, to put it mildly, absurd. It was as though the dip never occurred, and was thus irrelevant to the ridiculously steep, rising channel [in what universe is the election of a protectionist president bullish for one of America’s biggest trading partners?]
When USDJPY reached our upside target two weeks ago, we waited for the other shoe to drop. Surely, it would retrace some of its gains, if only to flesh out the channel.
When the red channel finally broke down a few days ago, though, it continued sideways — until yesterday, when it finally dipped just enough to tag the bottom of an expanded channel that captures most of the Nov 8 dip.
The net result: an unbroken rising channel where the “drop” to the channel bottom didn’t produce any lower lows. Mission accomplished. And, just in time, as the end of the year is right around the corner.
People often ask me if charts still work in an era where “markets” are so easily controlled by central bankers and algos. Once you discount the extent to which prices are determined by fundamentals, it opens up a lot of opportunities in forecasting.
No, it’s not like it was 3-5 years ago. But, in some ways, it’s easier to anticipate what the guys plotting out the “markets” have in mind. They usually still care about maintaining a veneer of normalcy — a facade of efficient markets. Often, that’s enough information to guide our forecasts.
continued for members…
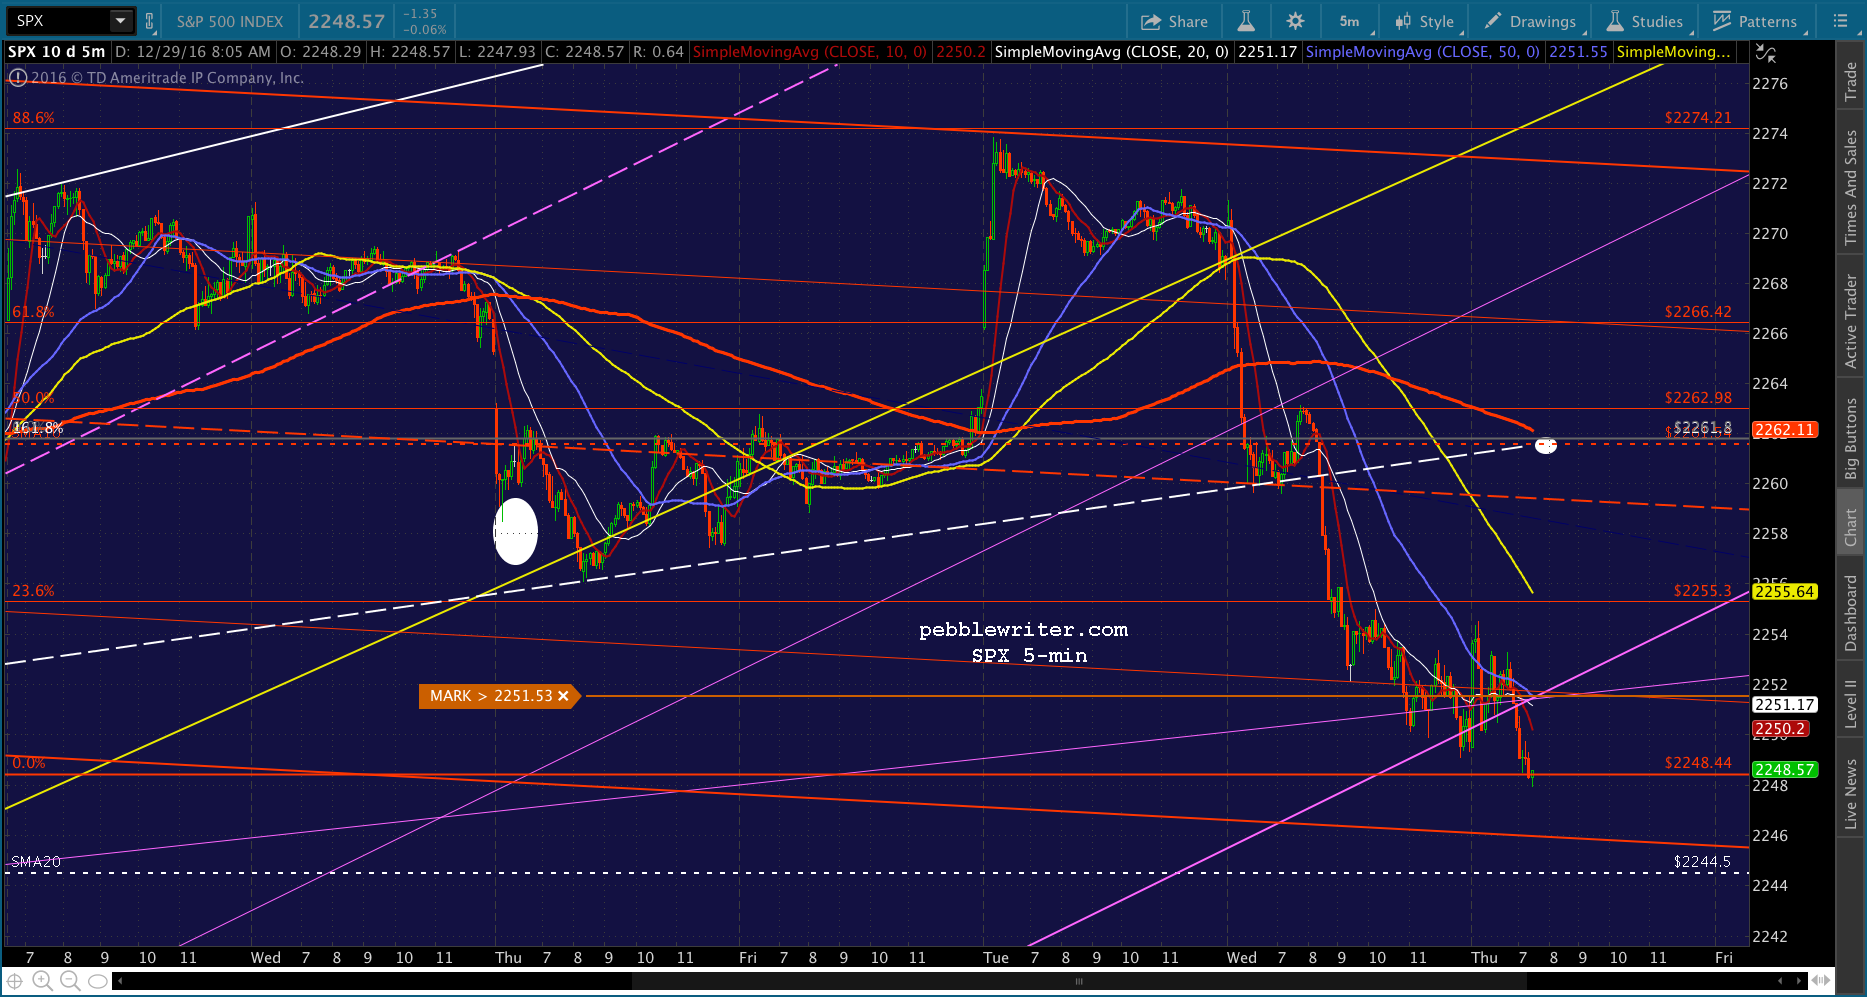
Yesterday, SPX reached the bottom of the rising purple channel that allowed the white channel backtest. Our analog suggests SPX will continue higher, backtesting the white channel again after the New Year break. We remain long from 2249.15 yesterday afternoon.
Note that USDJPY has fleshed out its rising white channel and very nearly tagged its SMA20. 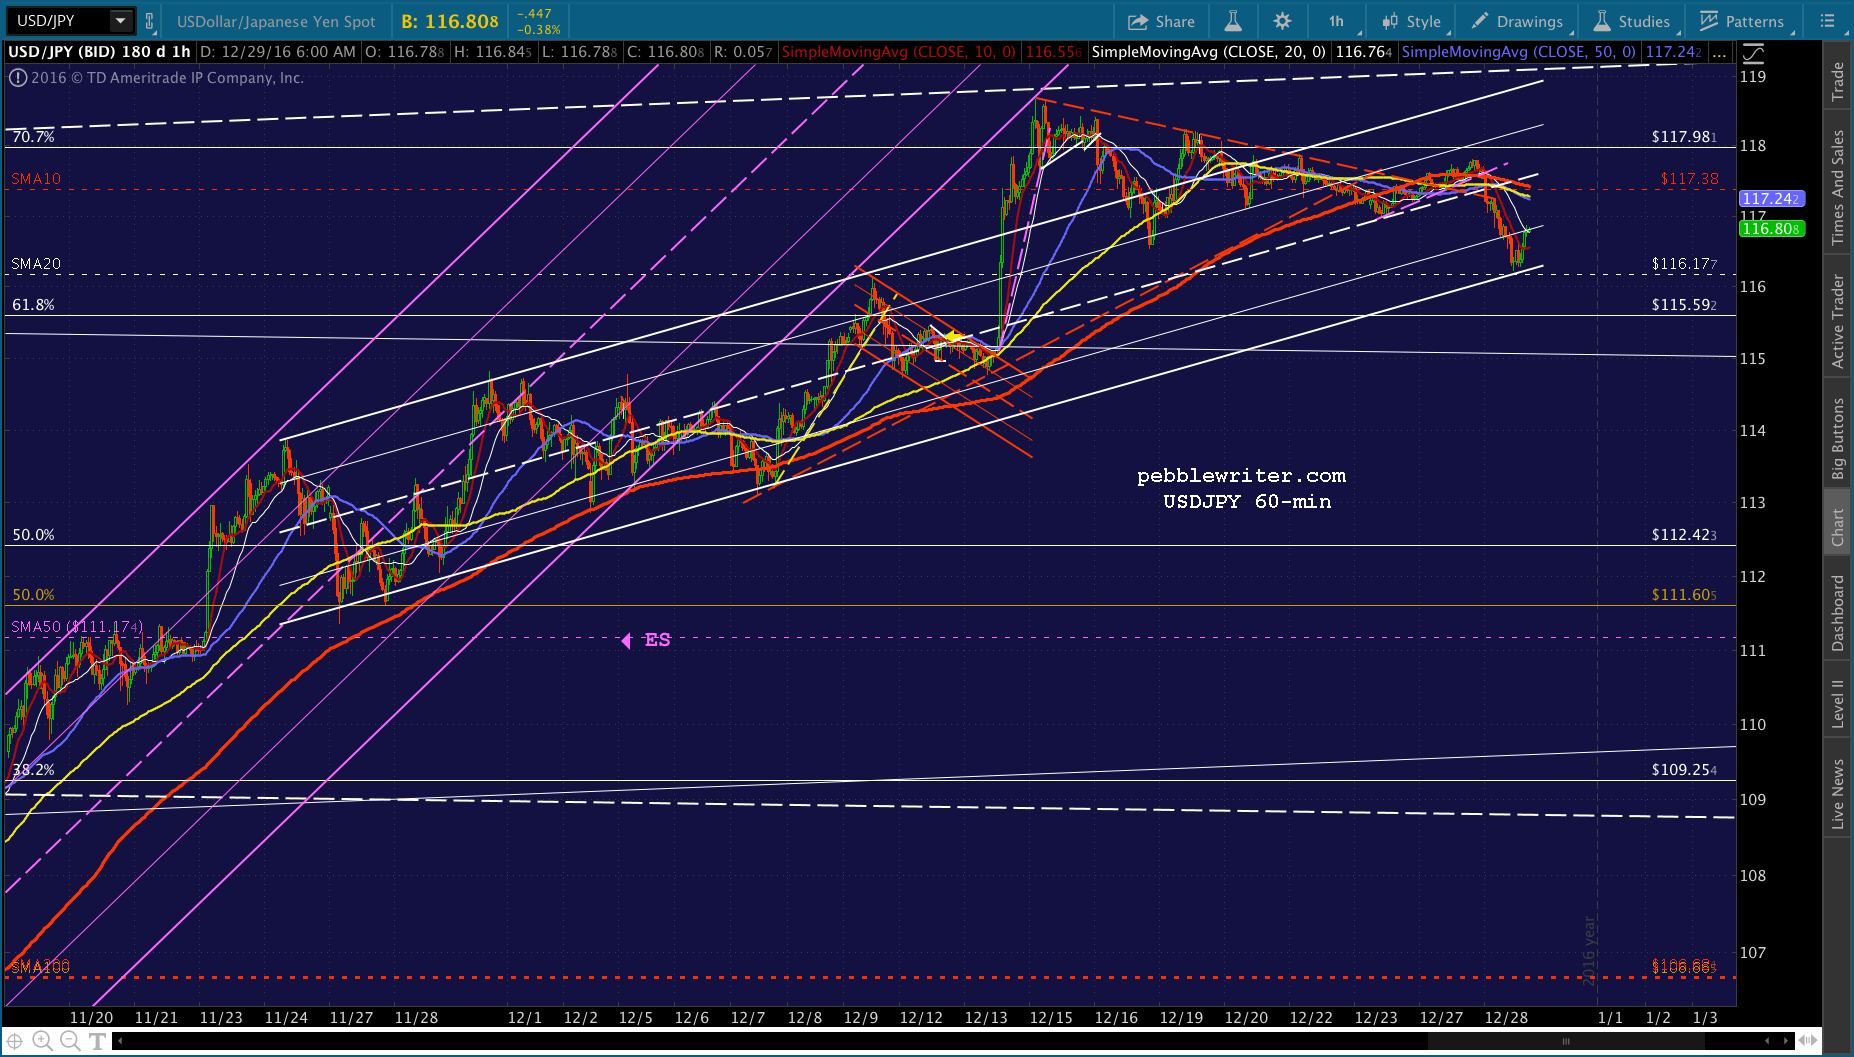 VIX has reversed off the top of a falling channel.
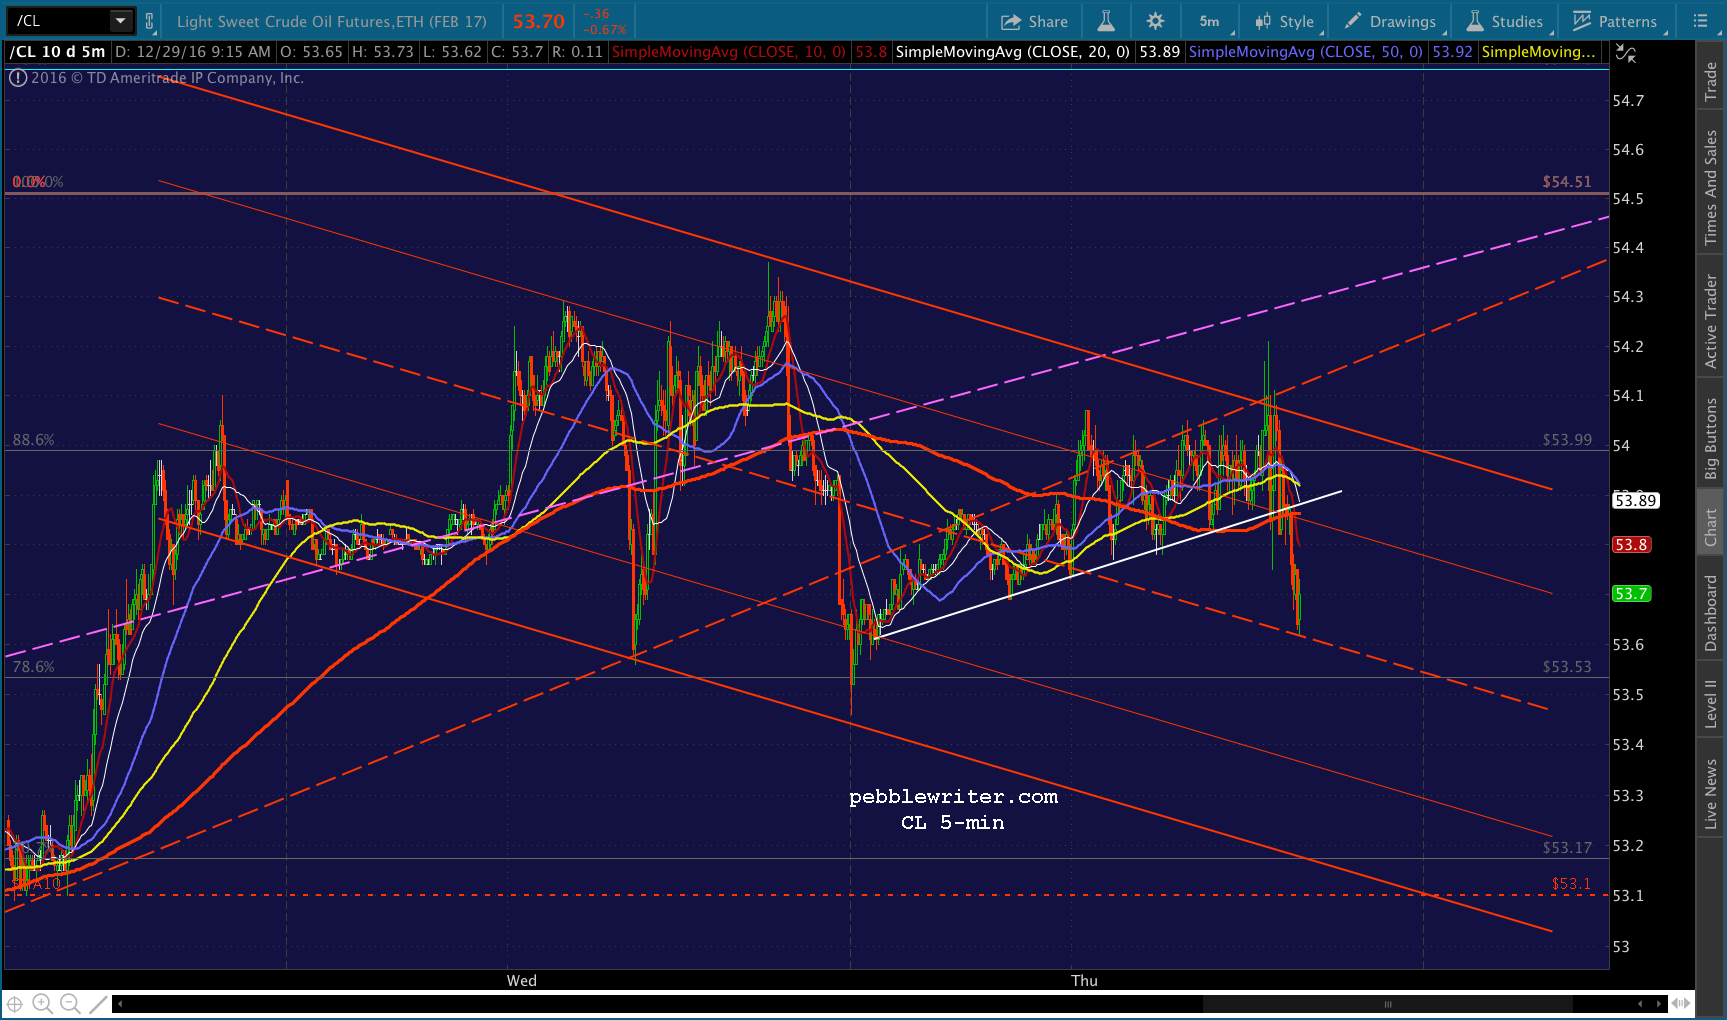
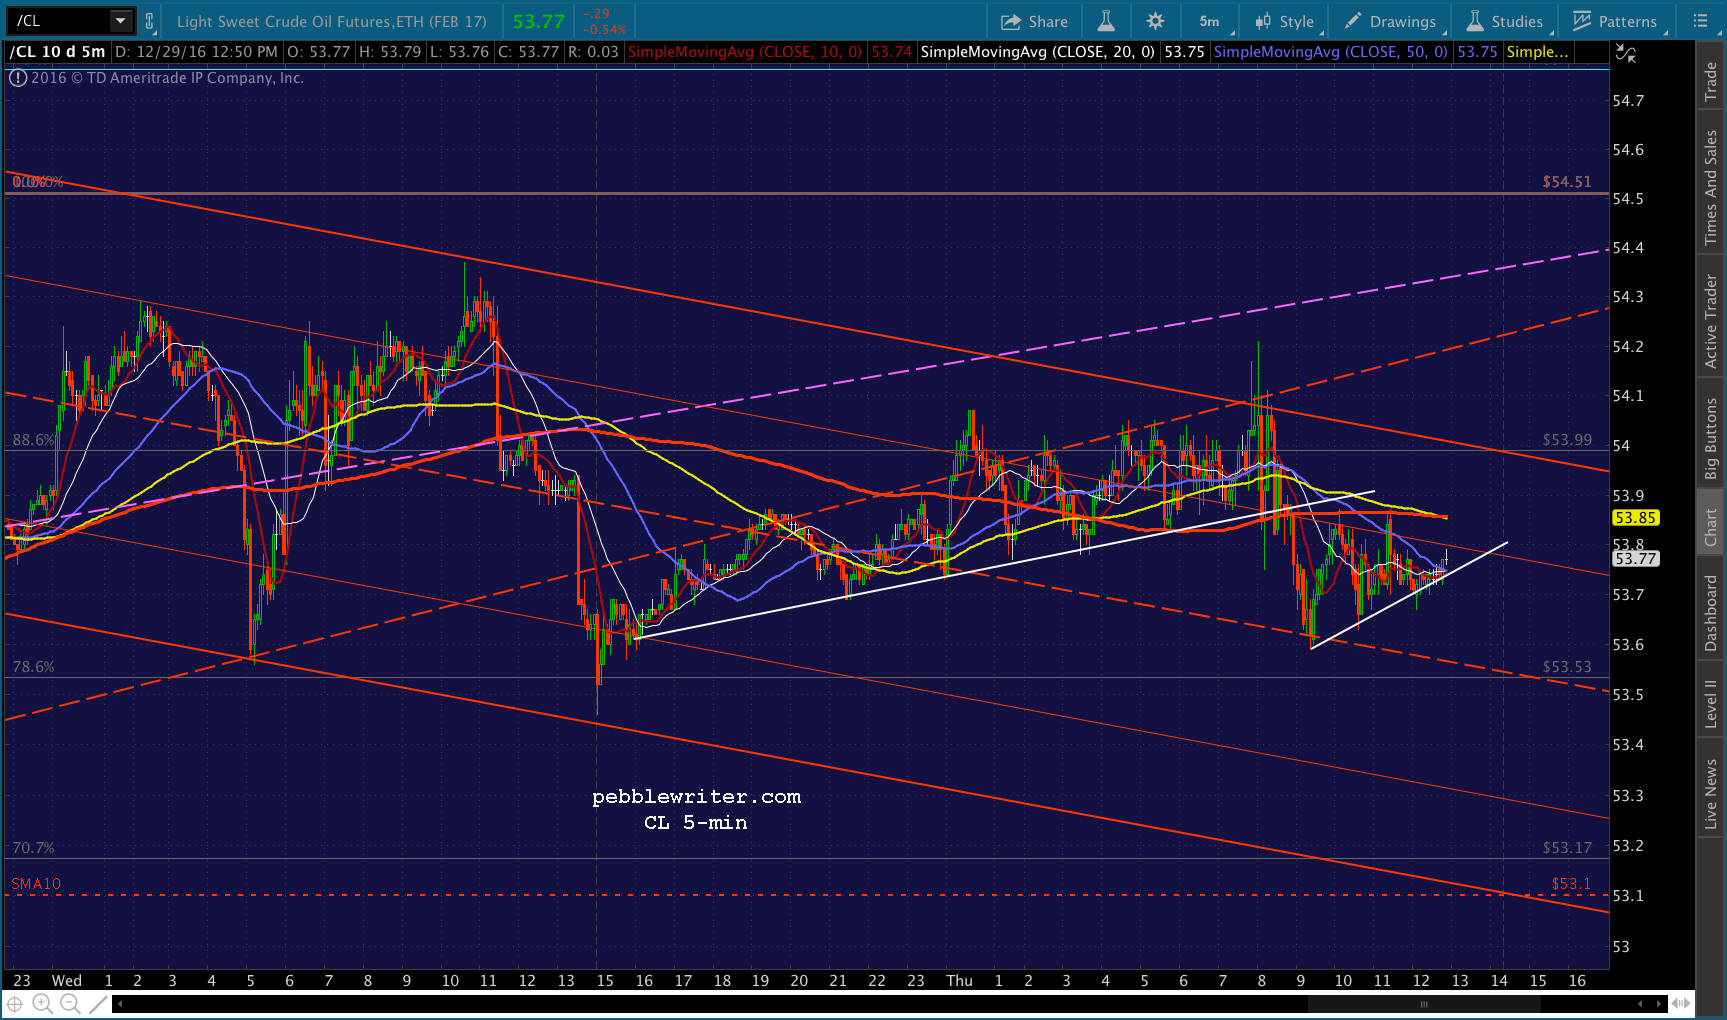
CL recovered most of the losses from its API inventory tumble, but continues to look susceptible. Today’s EIA report will be released later than usual: 11:00 ET.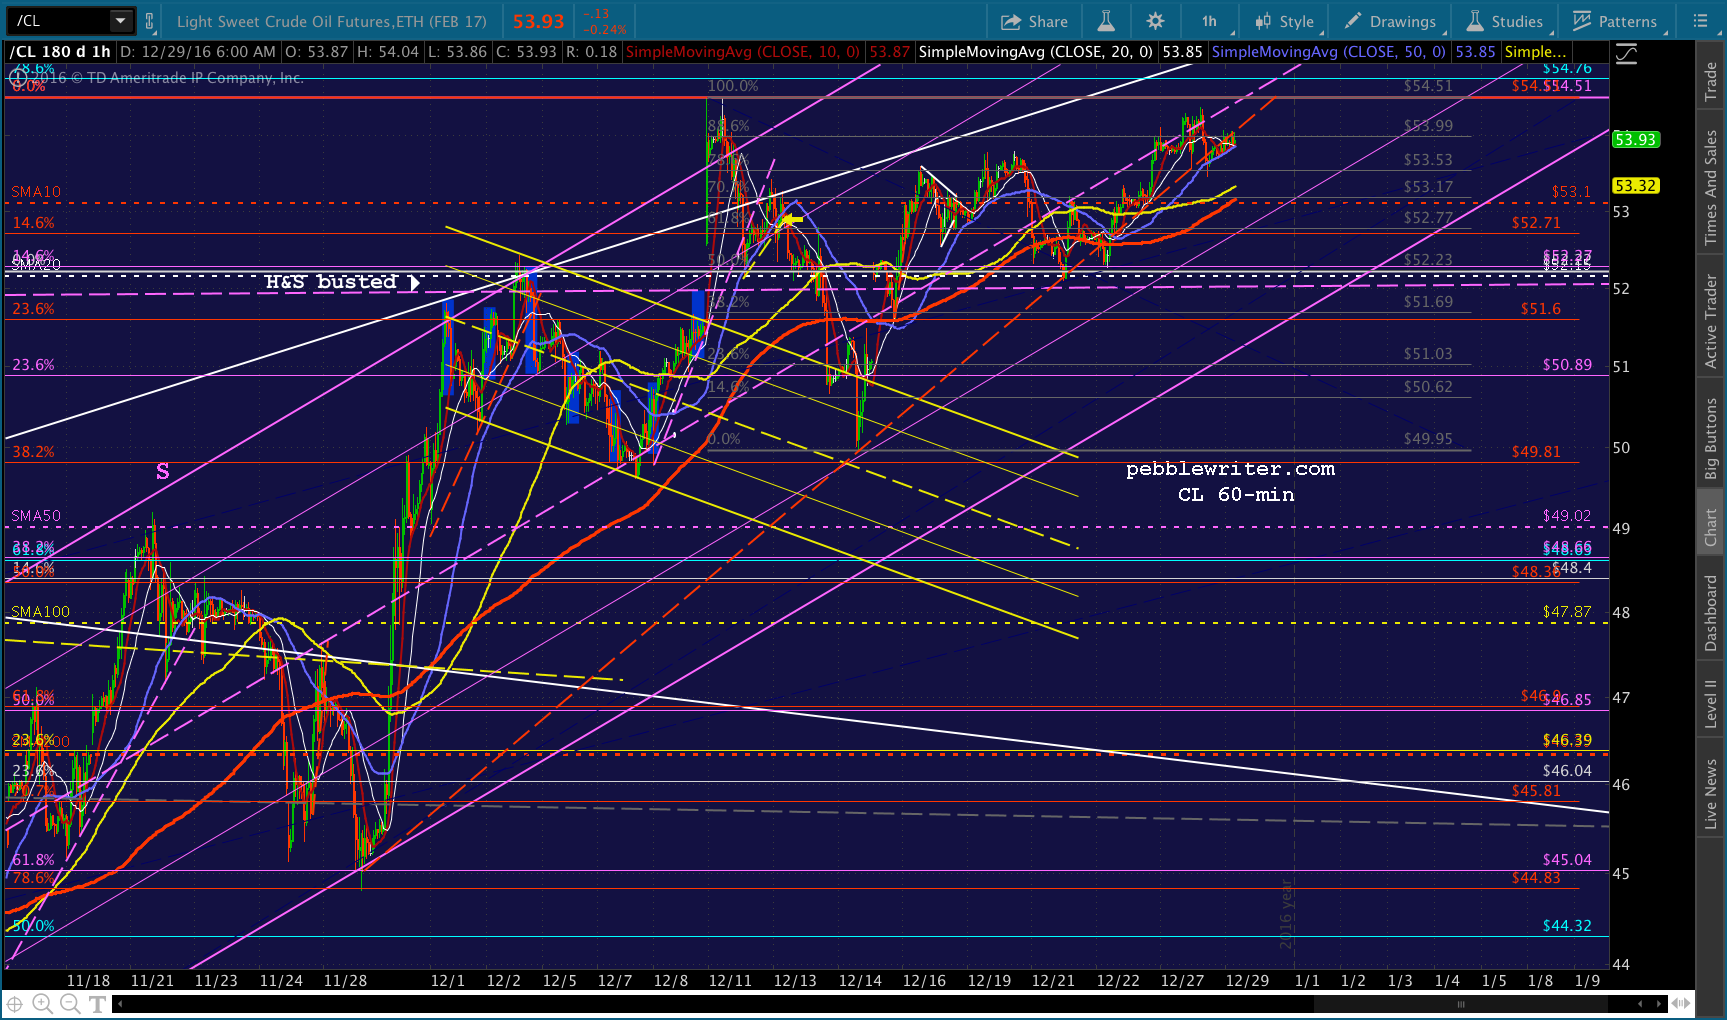
UPDATE: 9:49 AM
Although ES reached its SMA20 yesterday, SPX didn’t. It might still feel compelled to do so, and in the process flesh out the flag pattern discussed yesterday. The strong start out of the gate this morning, has largely faded, to the point where SPX just slipped below the SMA5 10/20.
For now, it’s respecting the purple channel bottom and has remained above the Dec 13 lows. But, there are no doubt plenty of stops at that level that could exacerbate any drop through 2248.44. Bulls are not out of the woods just yet.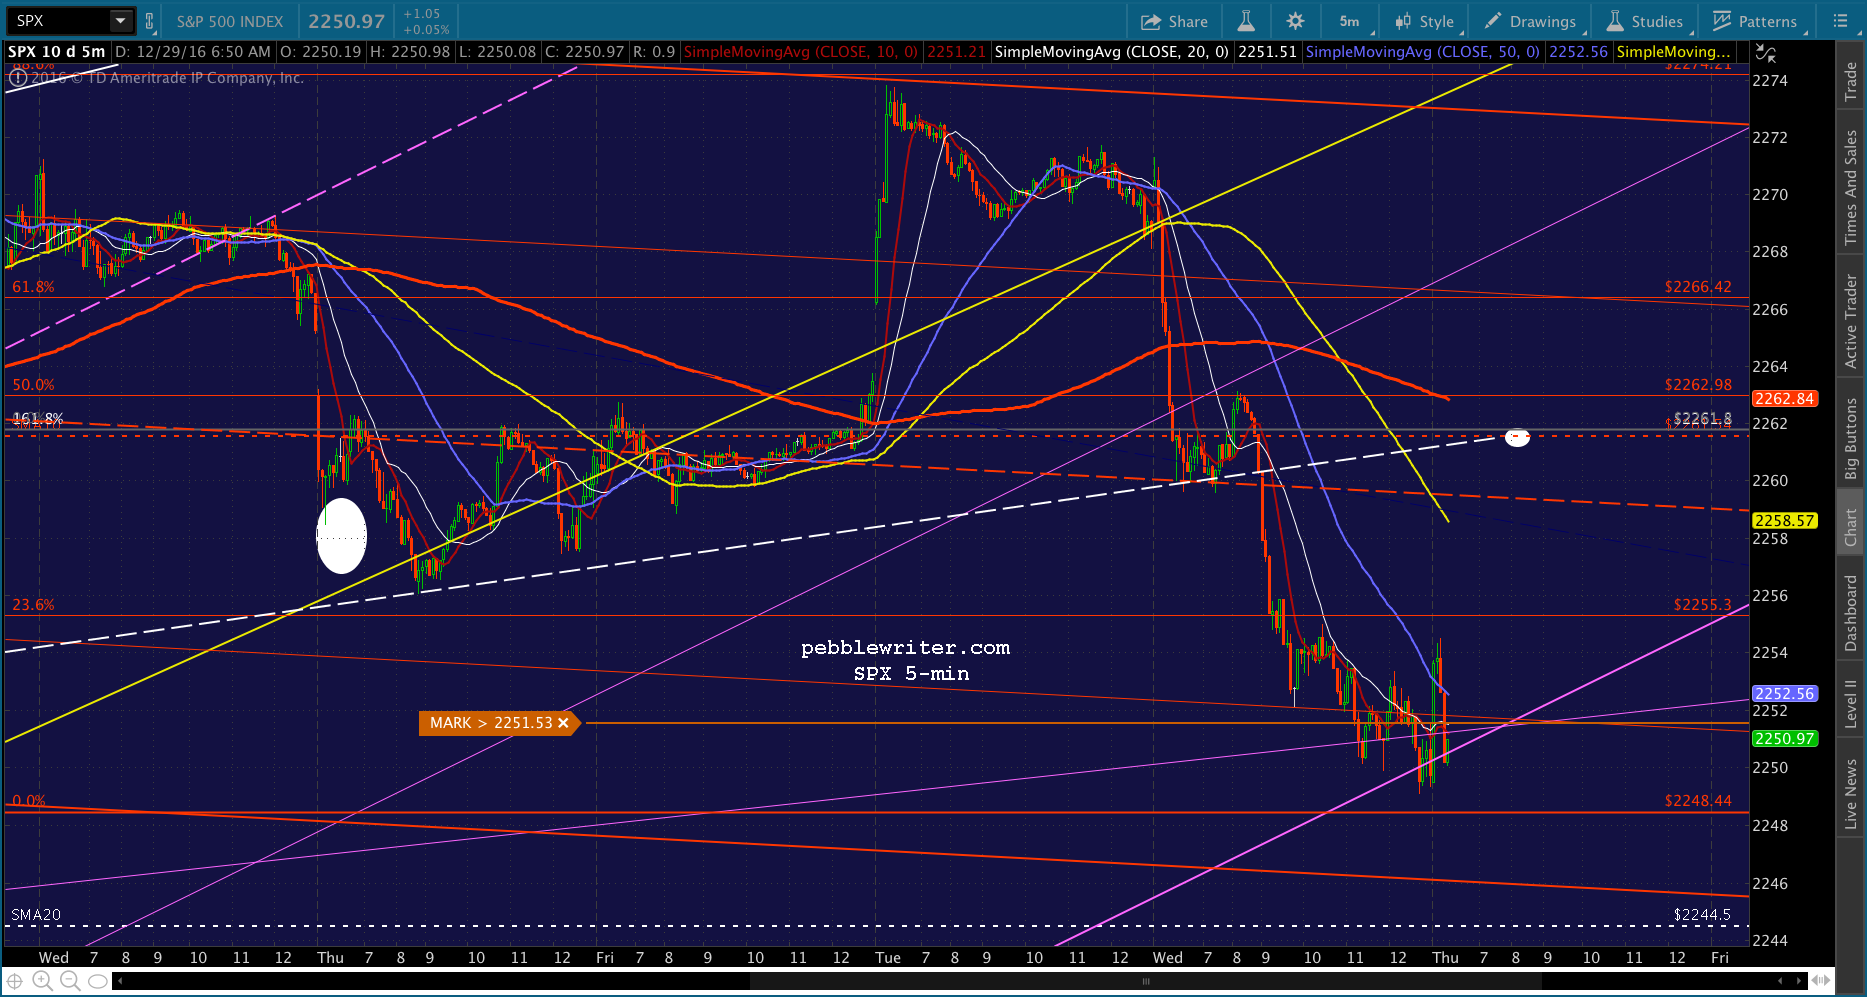
CL still looks susceptible, here. It’s safe to say that with expectations having been decimated yesterday, there’s room for an upside surprise.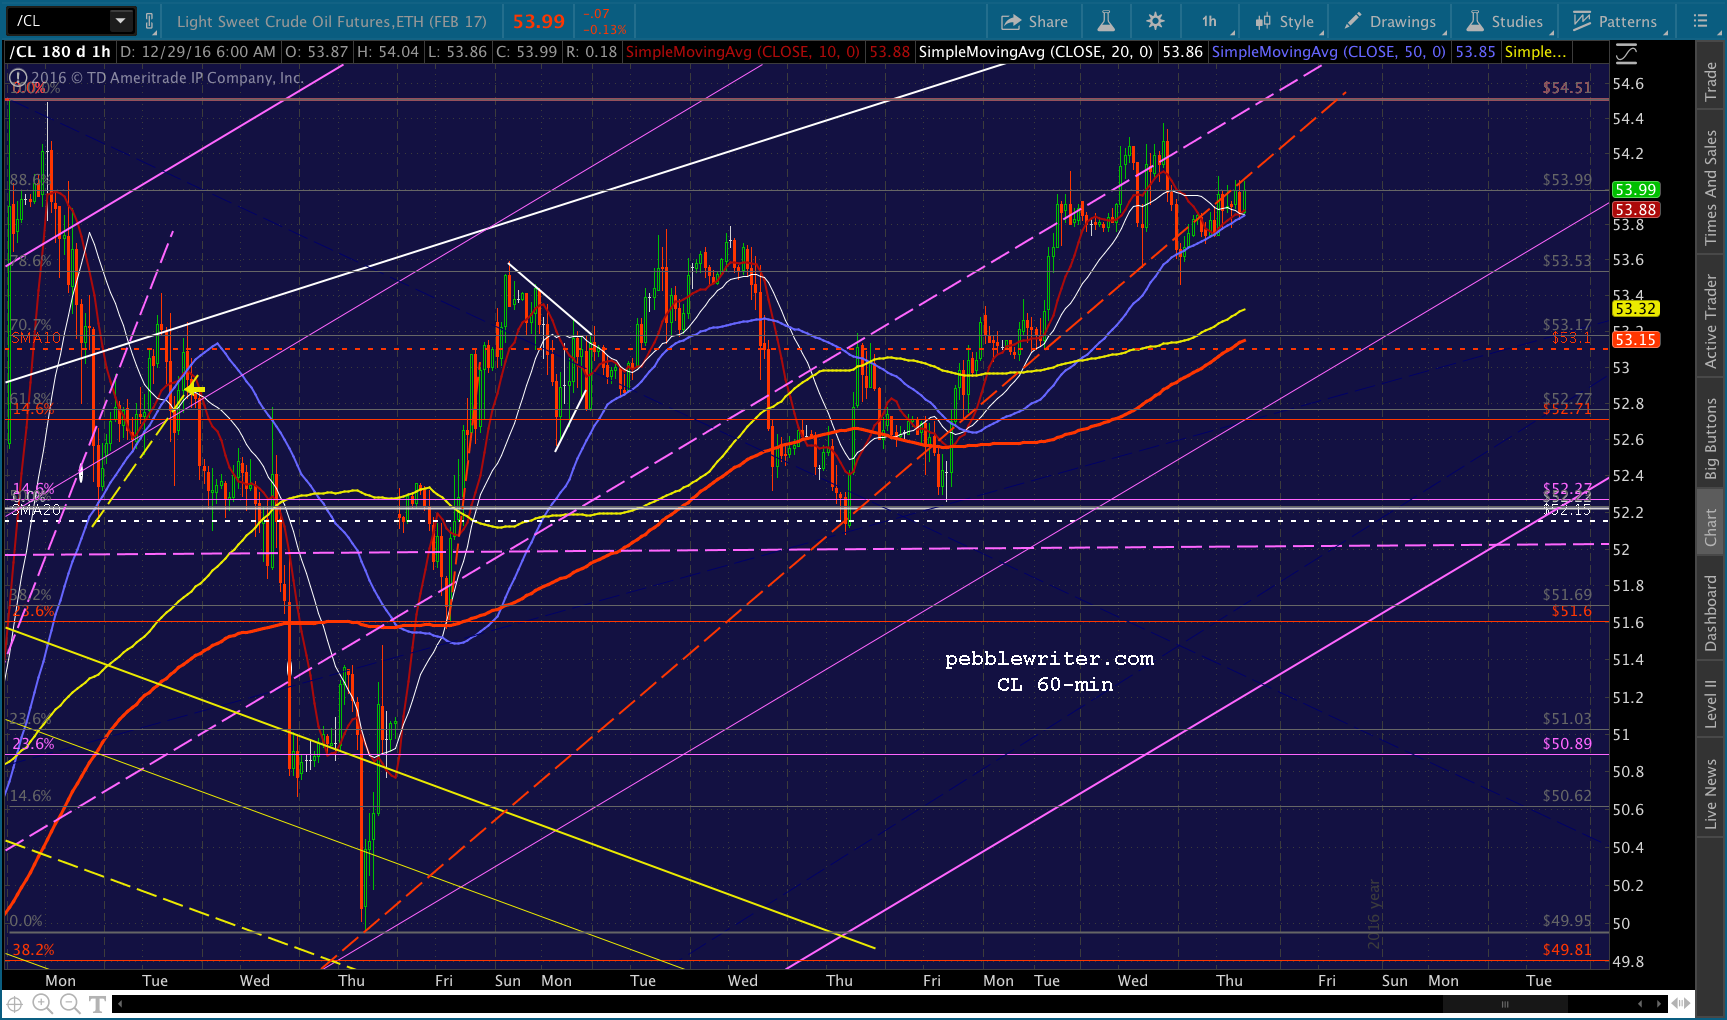
And, VIX is doing only just enough to keep SPX in the green.
UPDATE: 10:46 AM
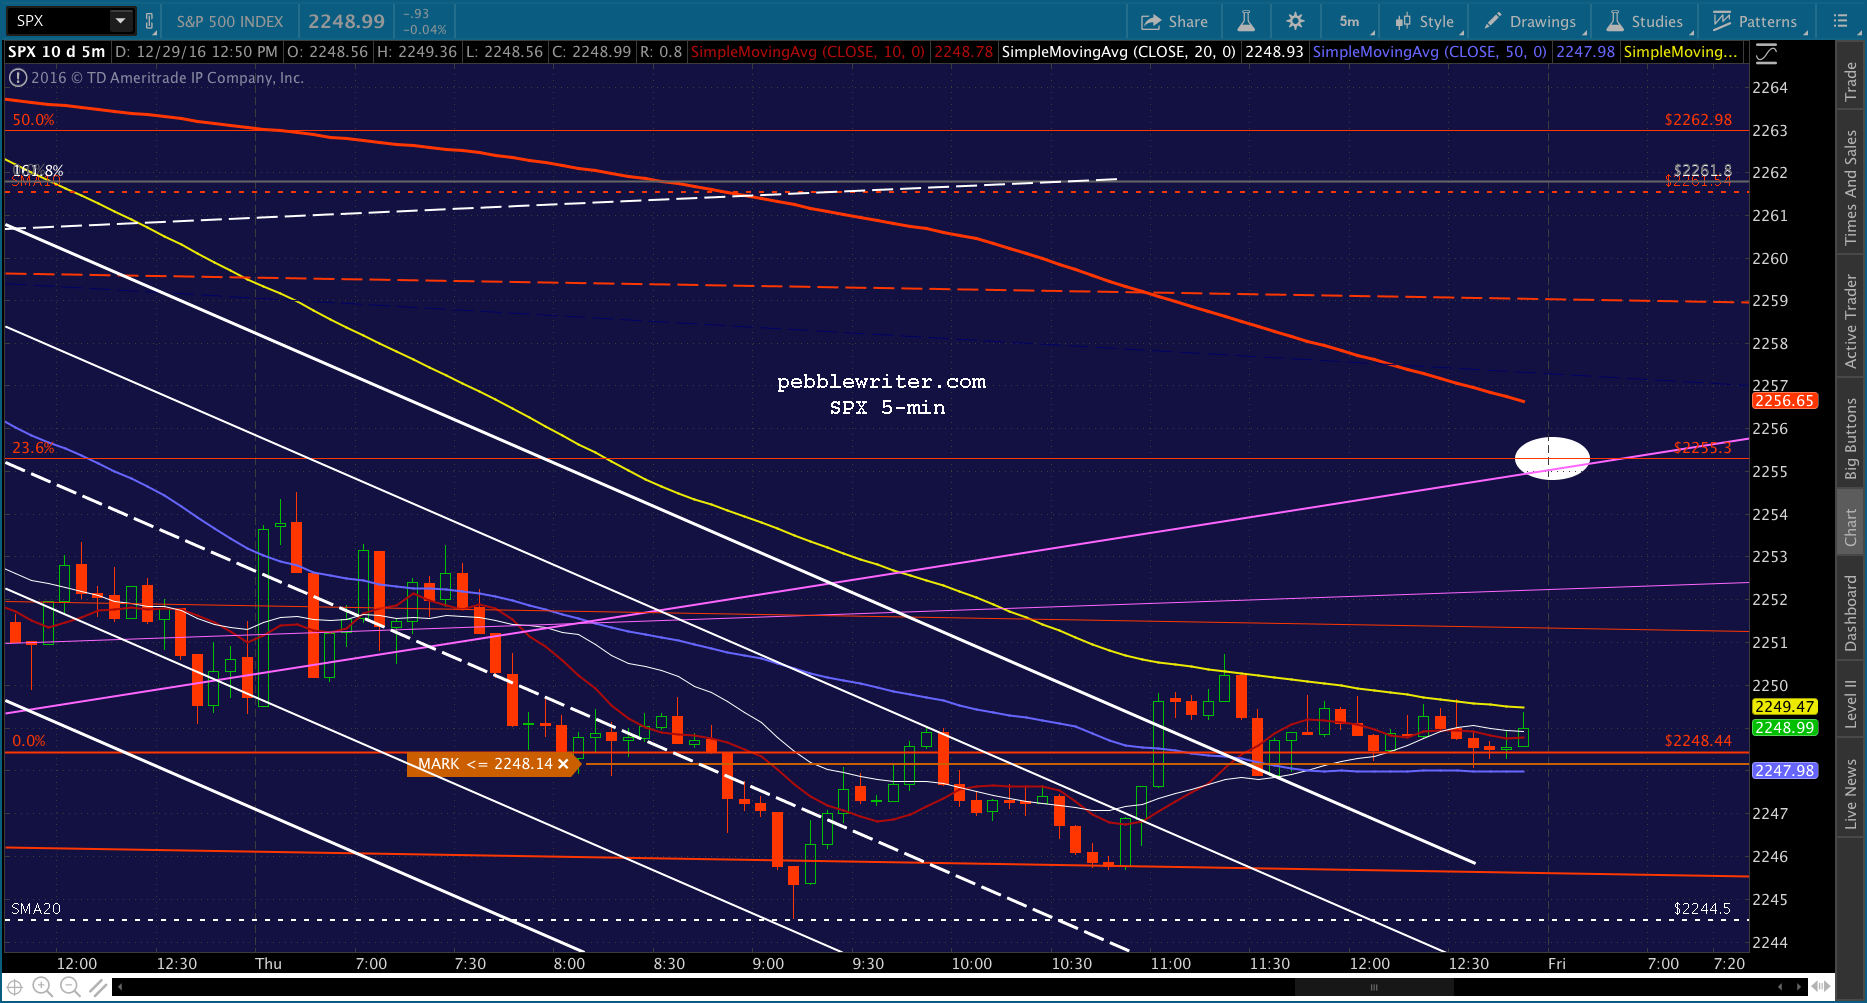
It sure appears as though they’re setting up for a dip to the SMA20 at 2244.50. VIX is edging higher, and USDJPY is slipping below its SMA5 200. This feels very much engineered — either as a head fake in advance of a better than expected EIA report, or just for the sake of getting the SMA20 tag in the bag. I’d short here, but be prepared to go long again at 2244.50, probably after 11:00AM.


UPDATE: 11:05 AM
EIA says inventory was up 0.6MM barrels (versus 1.5MM draw expected.) CL is actually up on the news, though it’s not likely to last. Still appears as though they intend to test 2244-2246. It probably means USDJPY will tag 116.17.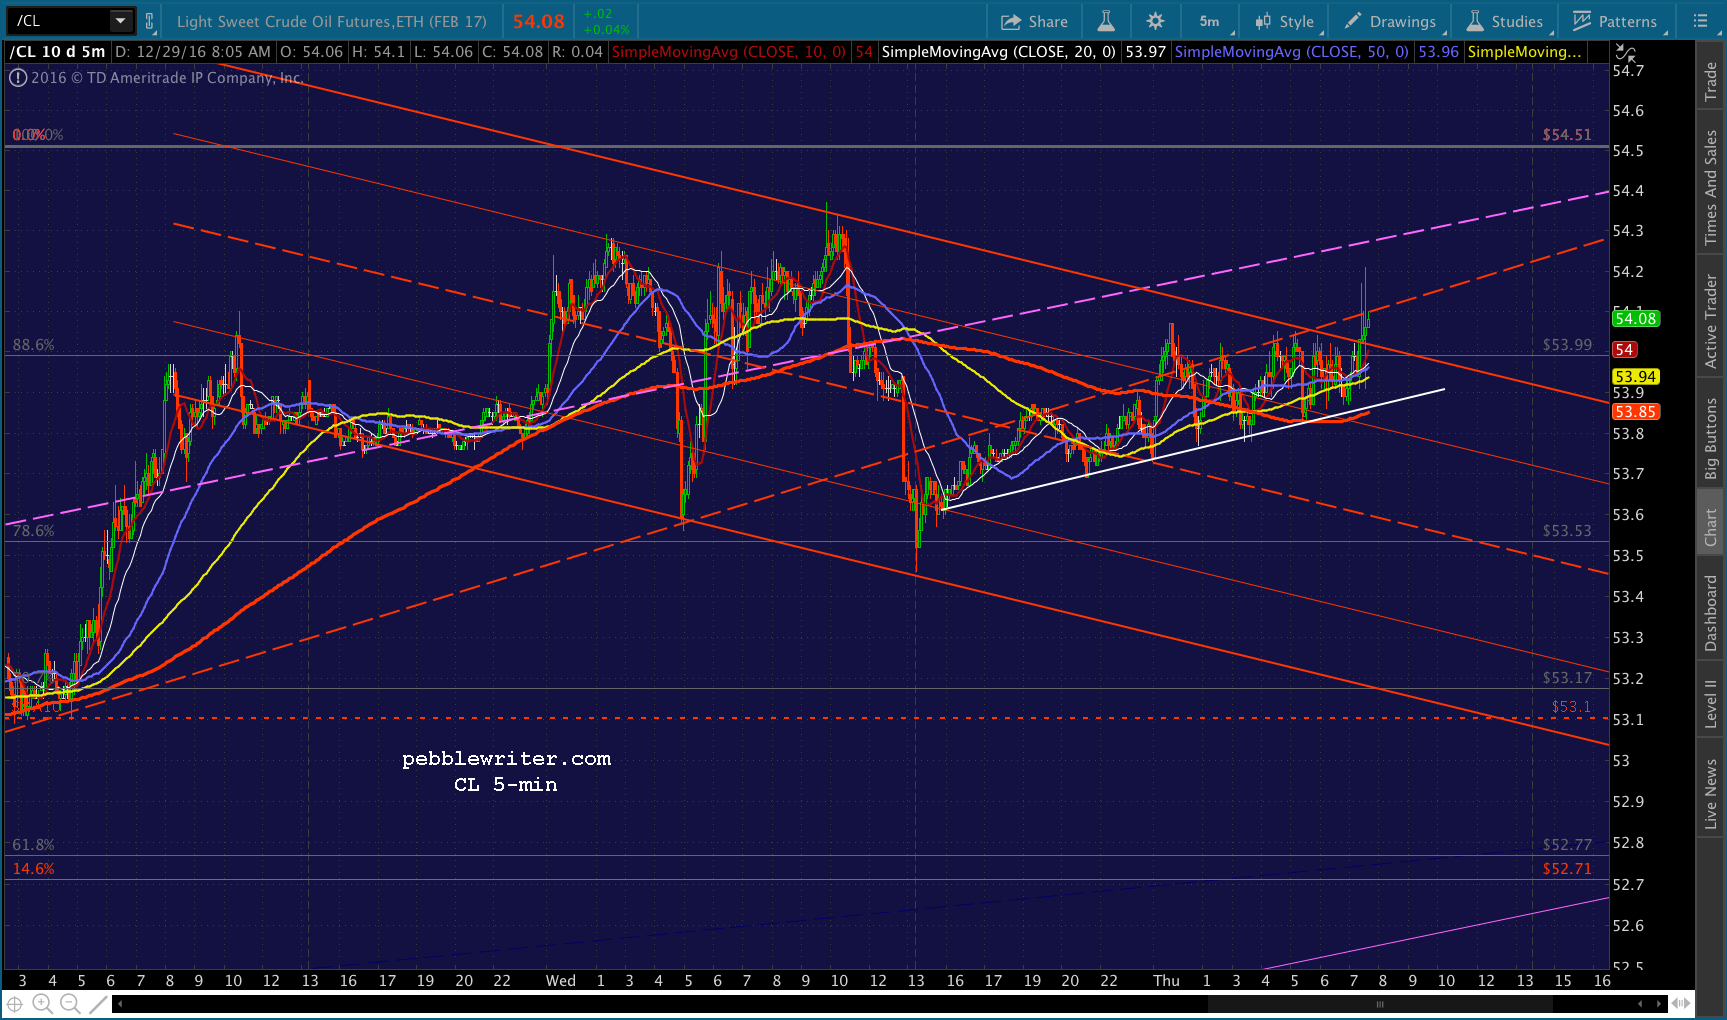

UPDATE: 12:14 PM
SPX is about to reach the SMA20 at 2245.50. I’d revert to long here at 2244.69 with tight stops.
CL is getting a midline tag here.
USDJPY didn’t reach its SMA20, but it is bouncing off the white channel bottom again.
Only VIX seems to be without a natural reversal point at this time — meaning SPX might well need to descend to at least 2244.50 rather than the 2244.56 it did reach.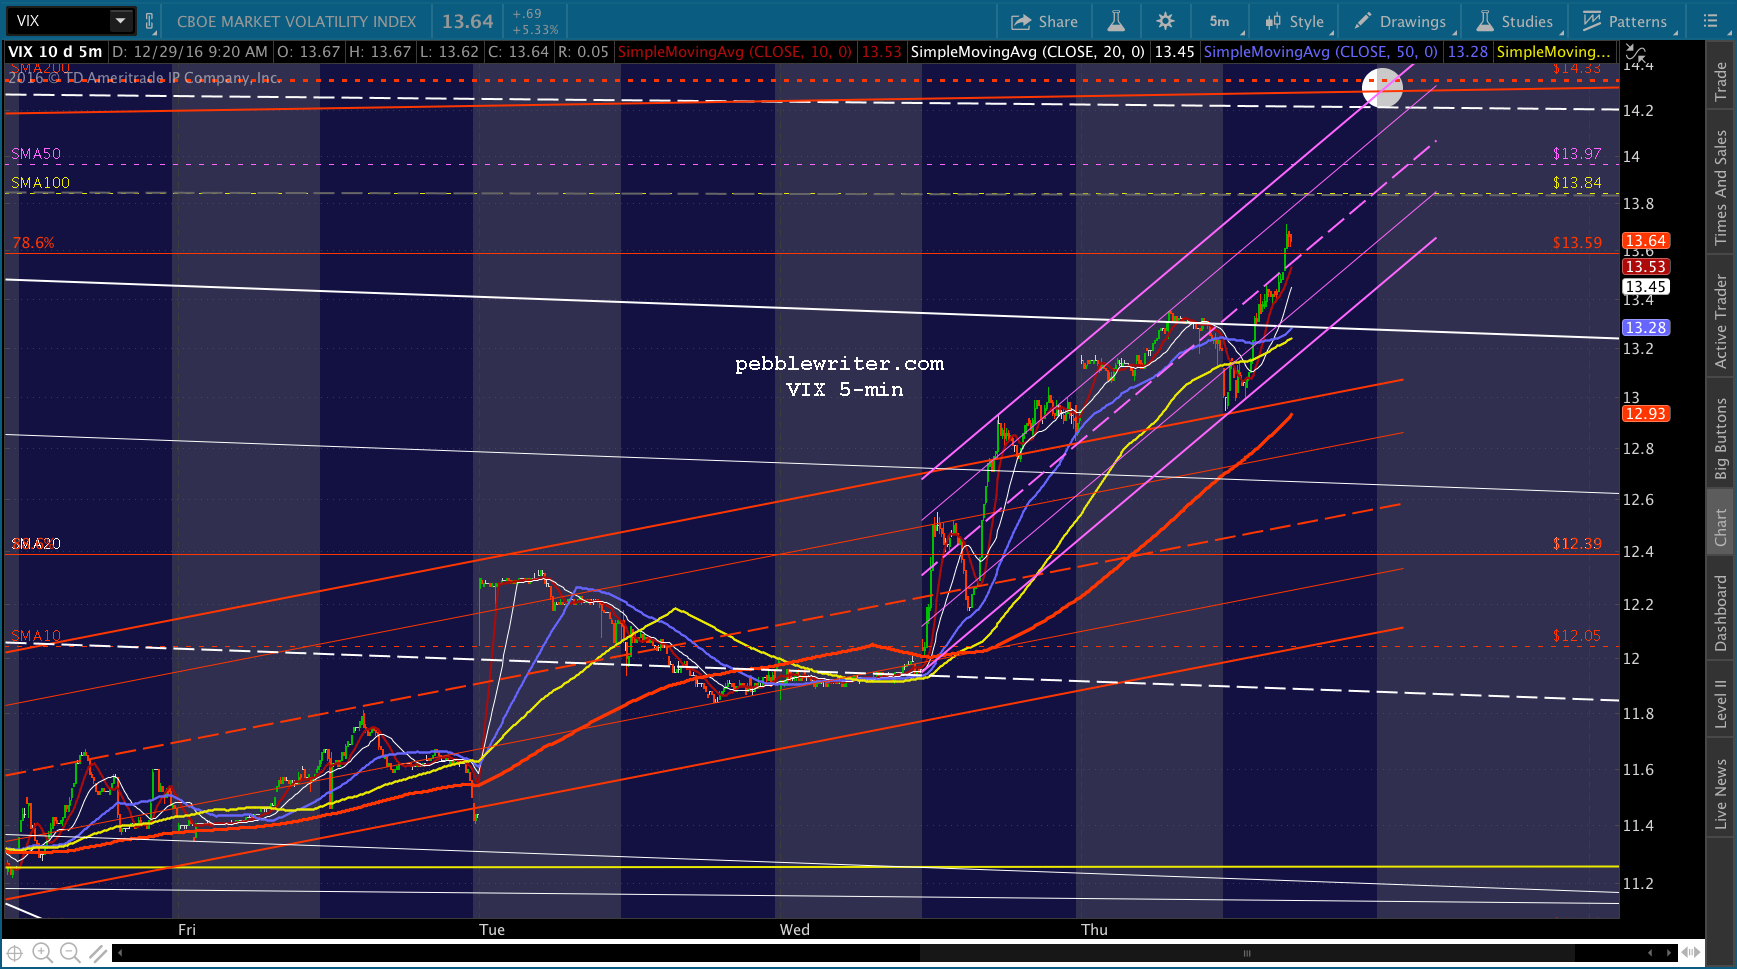
For that reason, and because ES has much stronger support down at 2235ish, I’d keep a close eye on this position. There’s not much support for SPX until 2224.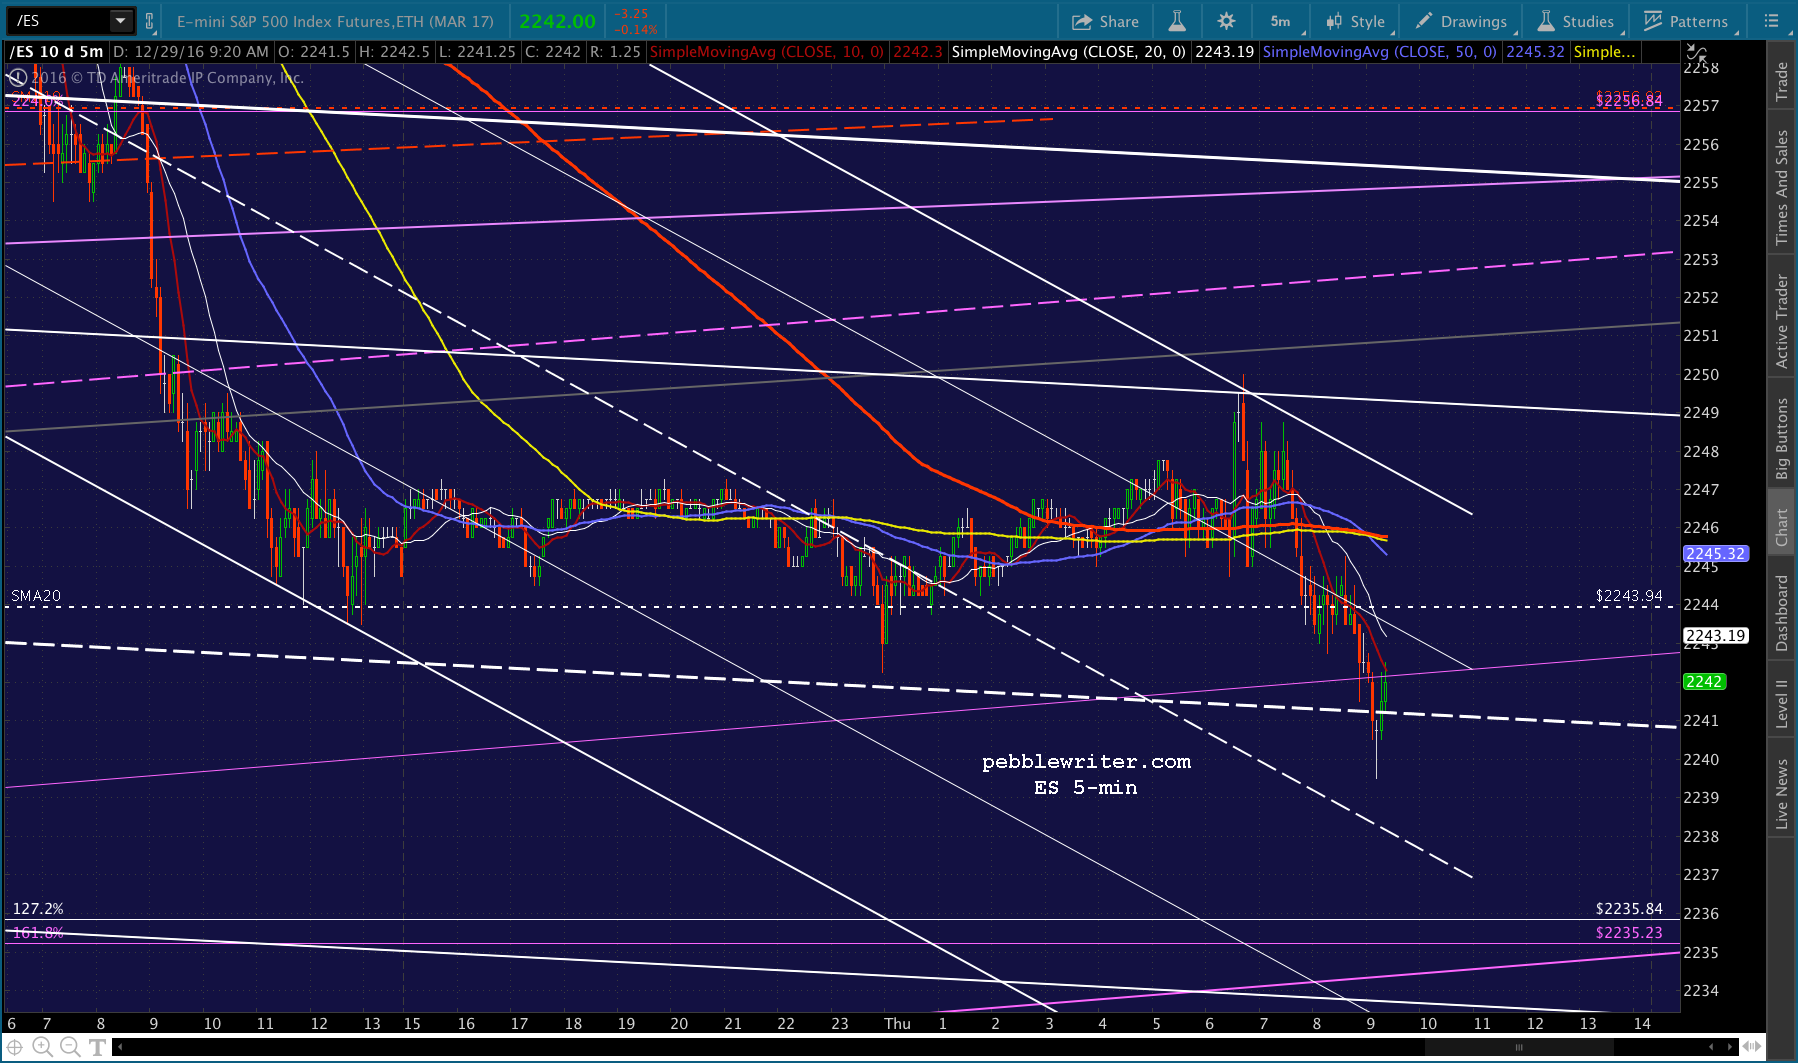
UPDATE: 1:28 PM
Nothing much new since the initial bounce. SPX has been dancing around the SMA5 10 and 20 for over an hour, as CL, USDJPY and VIX have failed to lever it higher. It seems more and more likely that it will dip back down to actually tag 2244.50. Watch your stops. And, again, a drop through 2244.50 would be reason to short.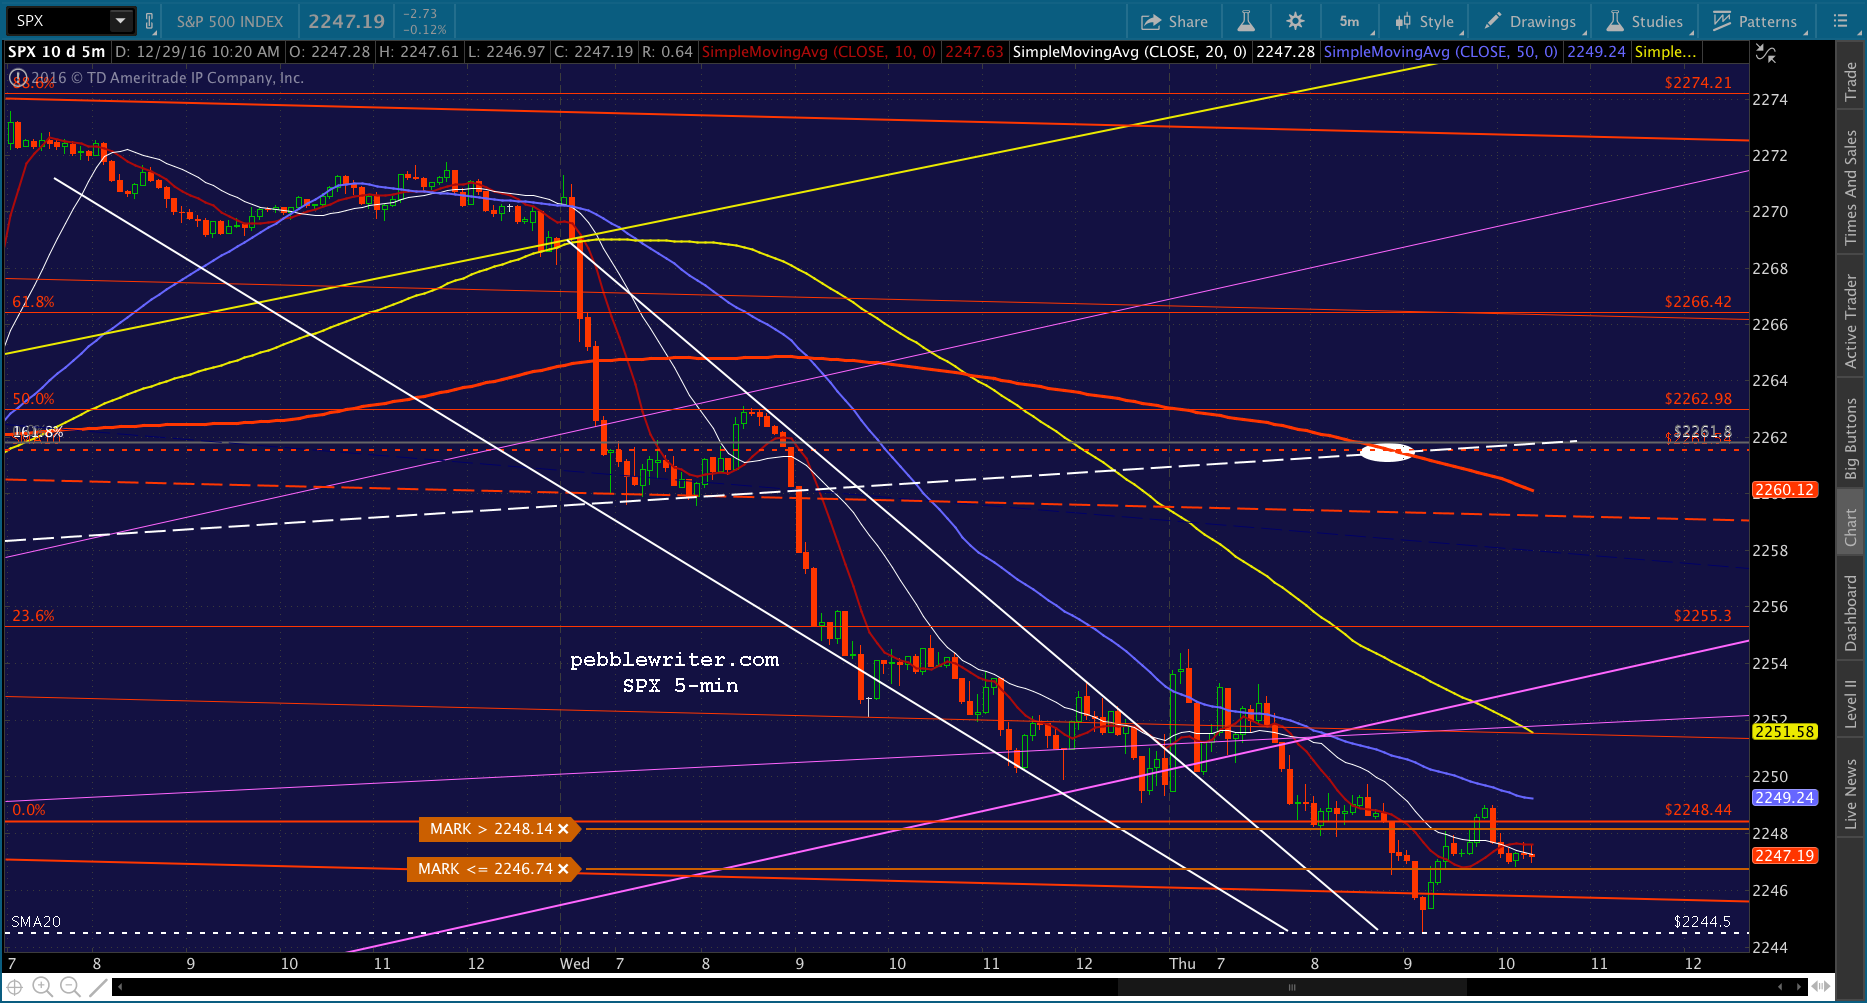
This has been an altogether uninspiring day for the bulls. Despite multiple opportunities to lever stocks higher, the algo department has been very quiet so far. ES 2235 is looking better and better.
But, I should mention that every year end over the last few years has looked downright bearish. This year, we have just as many reasons to be bearish, and a 10% gain to protect. So, odds are we’ll get another spurt higher despite the price action we’re seeing the past two days.
Seeing as how there is no glory in being right for the sake of earning an extra 1-2%, I’d err on the side of caution and keep stops tight and overnight positions hedged or to a minimum.
UPDATE: 1:40 PM
Another deliberate effort via USDJPY to depress SPX further.

Note that VIX is ignoring opportunities to push stocks higher.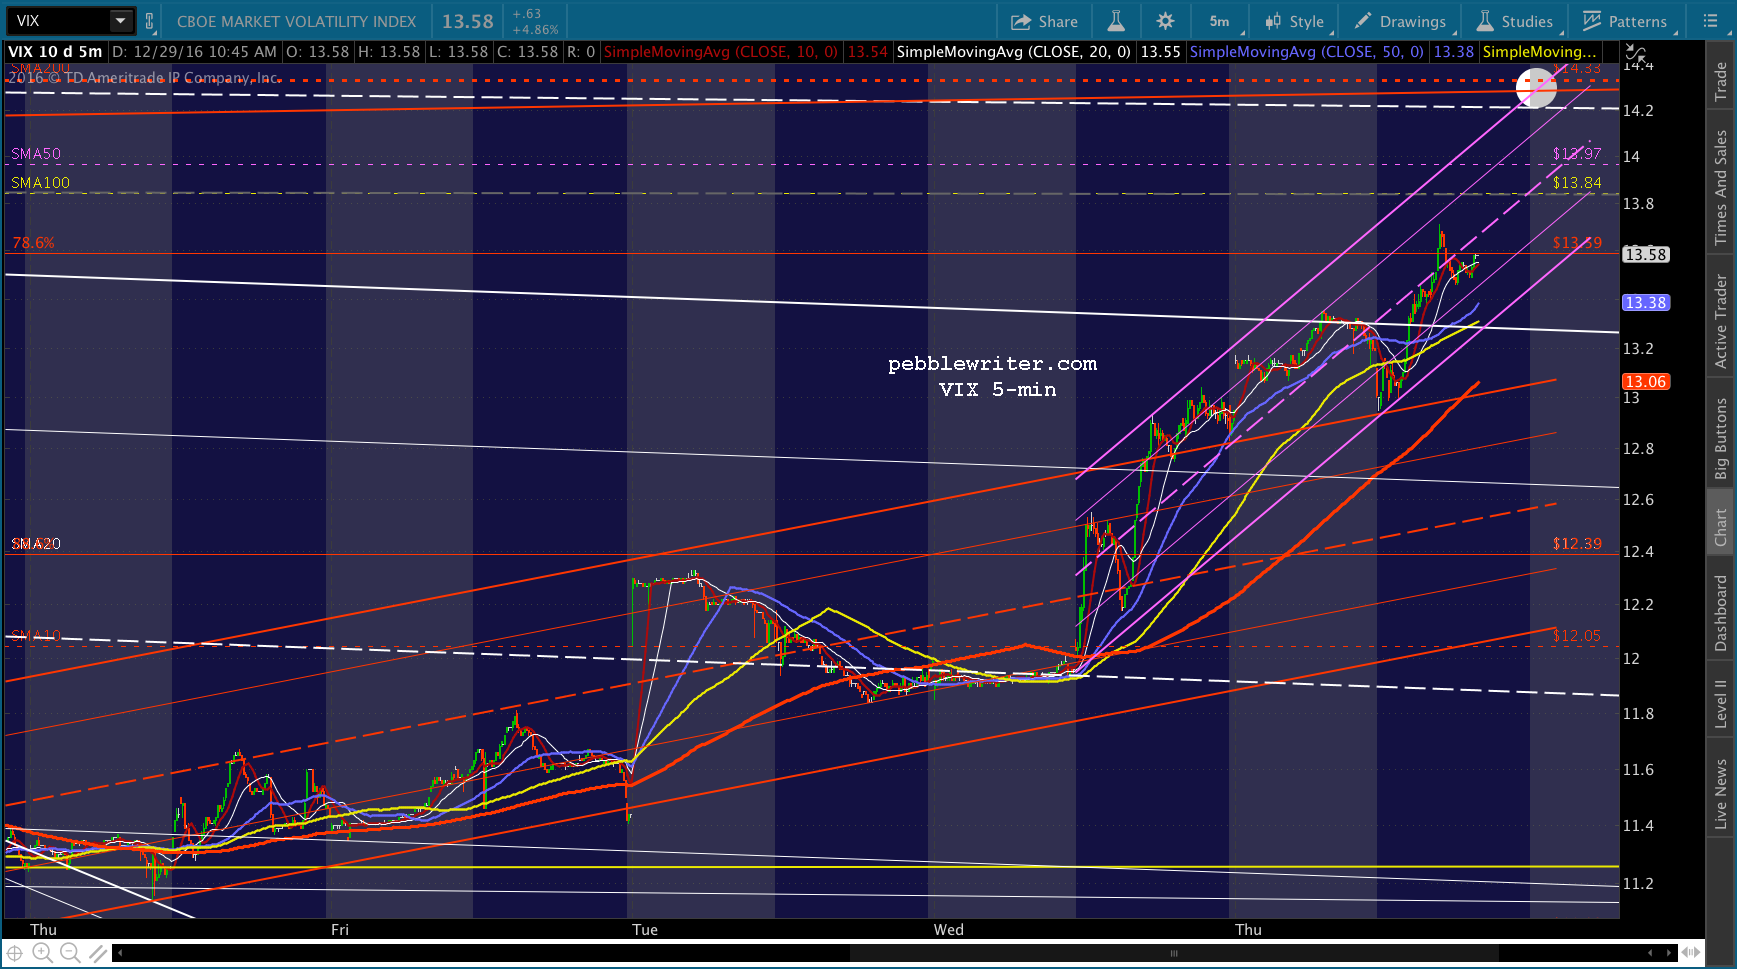
UPDATE: 1:54 PM
I’m going to take a 30-45 minute break. I’m 50:50 on ES reaching 2235.25-2236 and SPX reaching 2240. If SPX reverses here at the SMA5 10, I’d switch to short and try to bag those 6-7 points. If it breaks out, there’s still the falling SMA5 50 and SMA5 100 to deal with.
UPDATE: 3:02 PM
VIX should tell us what to expect over this last hour by whether it holds the rising purple or breaks down. SPX’s SMA5 200, often a target late in the day, might just reach the purple channel bottom at 2255 by the close. The white TL and red channel midline are both currently out of the picture. A close at 2252 or better would look okay for bulls from a candle standpoint.
USDJPY is trying, but it’s not enough to overcome VIX and CL’s lack of enthusiasm.

CL isn’t helping at all — limping along, flat on the day.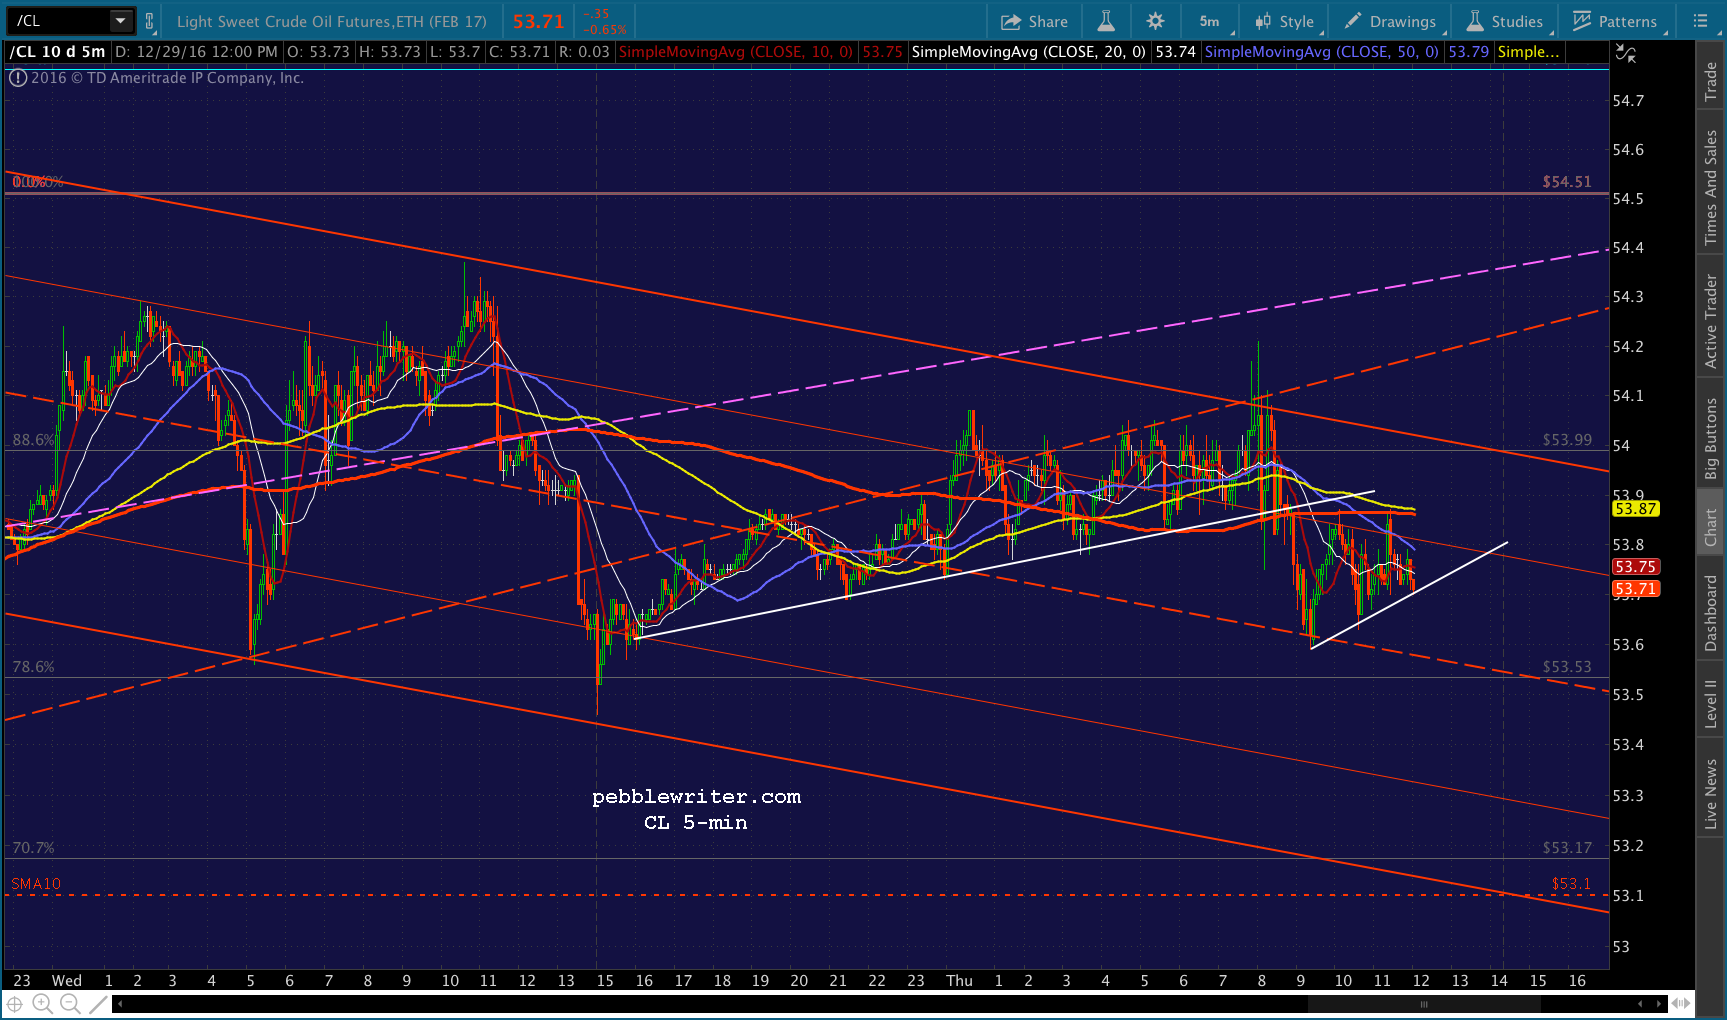
Note that NKD, our first topic this morning, has yet to break out.
As long as I’m throwing bones here, note that 2248.33 is exactly a 10% increase from last year’s close of 2043.94. With 7 1/2 hours left in 2016, shouldn’t we expect TPTB would rather close out with a 10%+ gain?
Several of you have mentioned portfolio rebalancing, and the need for large, mostly pension plan sponsors, to shed equities and buy bonds. This is no doubt true, though the requisite timing will probably vary from plan to plan. Whatever the selling volume might be, it’s unlikely to exceed TPTB’s ability to prop up stocks. Their willingness, however, remains to be seen.
The flag pattern has been completed, and the bottom of a fairly strong channel and the SMA20 tested. 2295 is a good 2% away — not much for them to achieve by Jan 5. But, at this point, SPX is acting more like Dec 2015 than October 2007. Note that, last year, it was all downhill after Dec 29.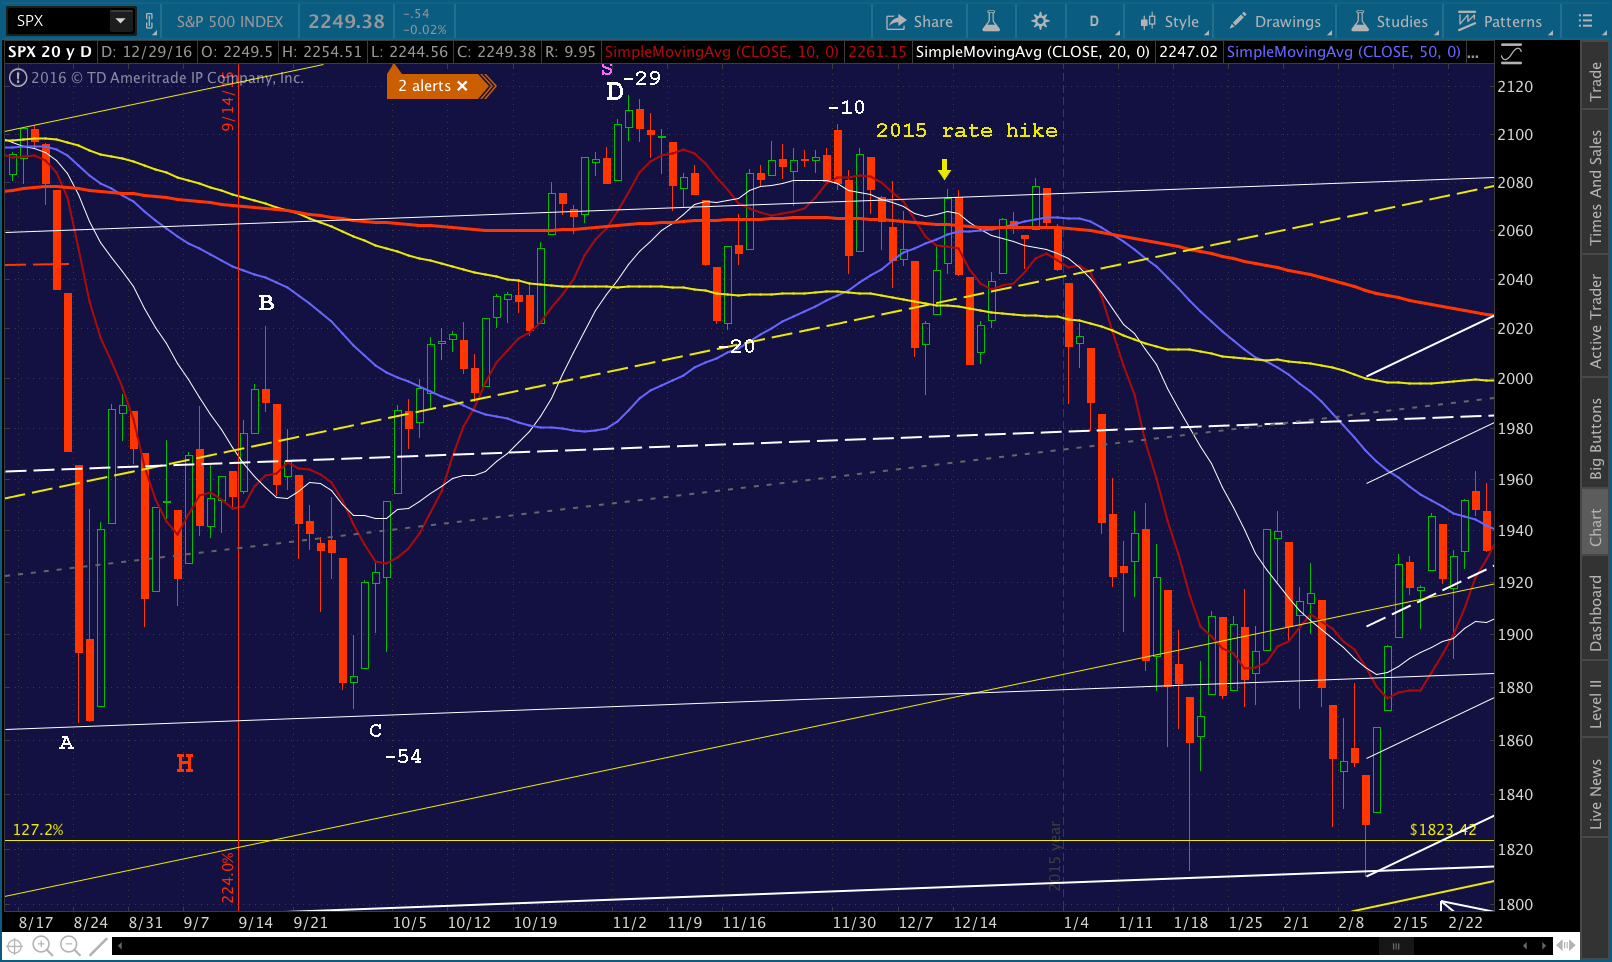
Stay tuned…it’s almost time for SPX to commit.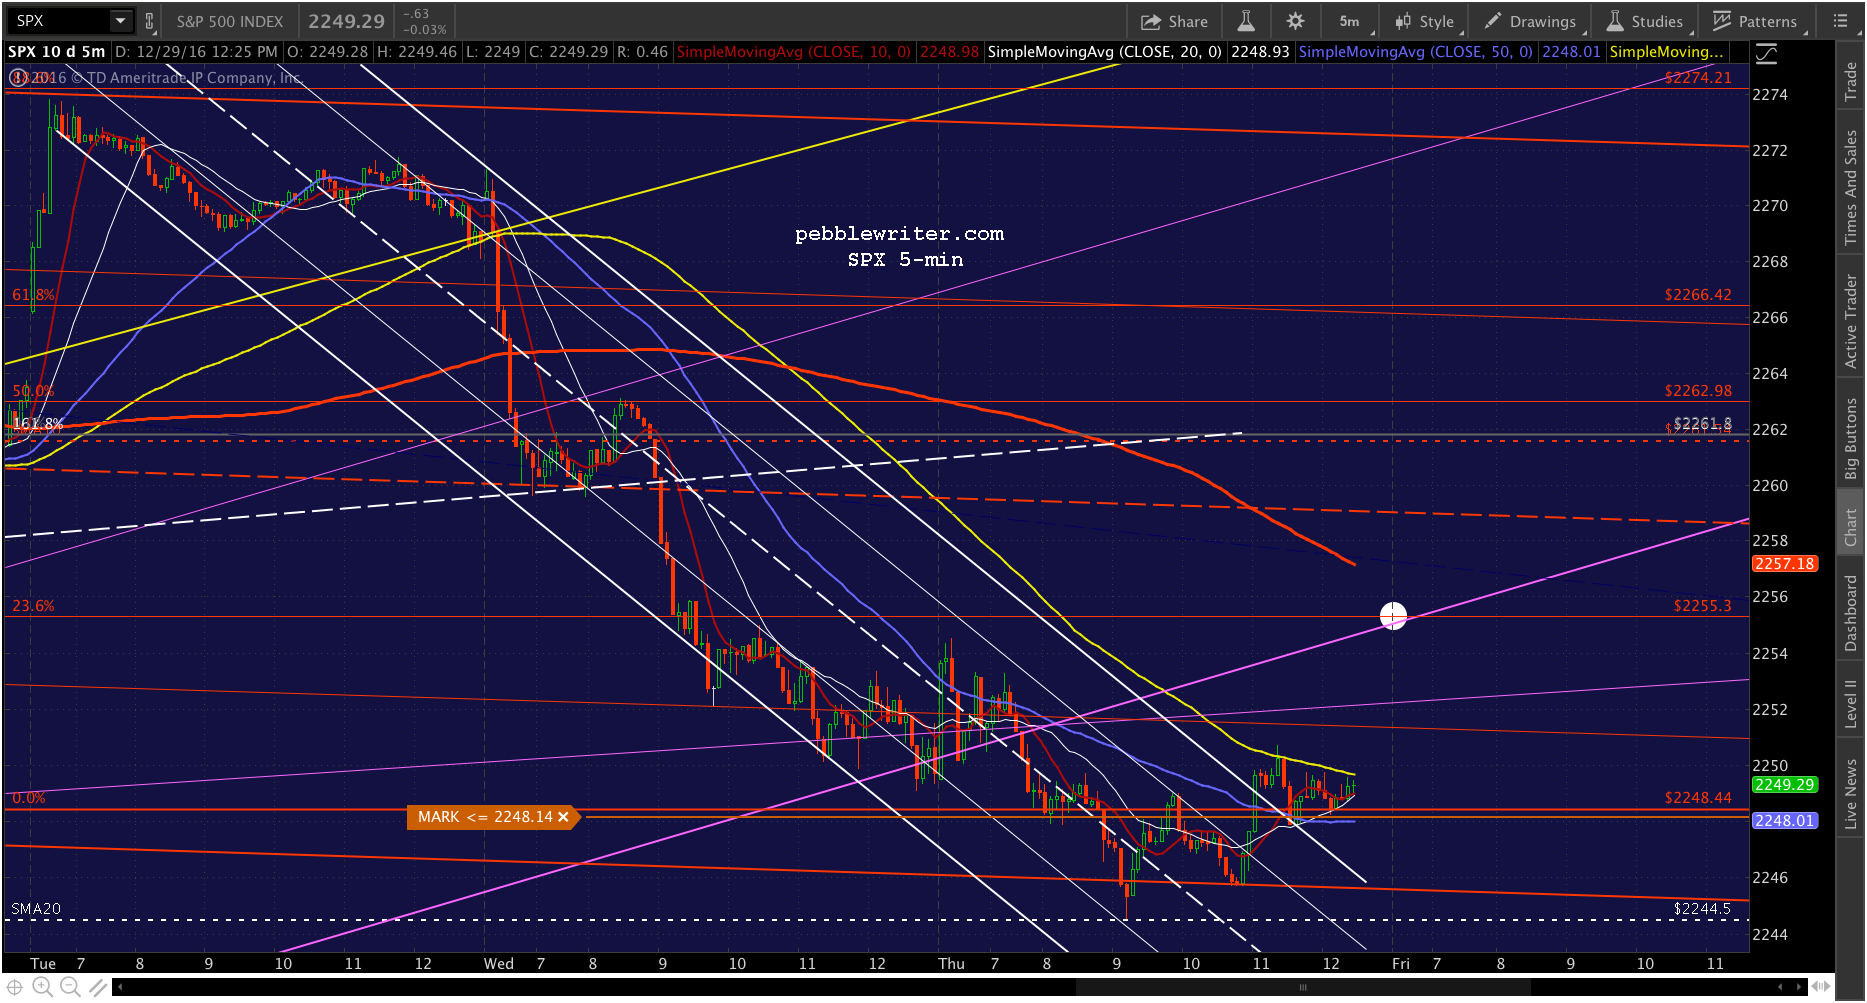
UPDATE: 3:54 PM
Wrapping up…like yesterday, only hold long if you can hedge or stomach a possible gap down overnight.


.
Comments
One response to “Channeling a Rally”
There were a couple of articles on ZH about pension funds selling up to $58 billion in US equities during these 3-10 days. If that is indeed causing this, I would expect more downside tomorrow, but does that go against the analog?