We came within 0.7% and 1 day of our analog’s forecast top before things started rolling over yesterday. Our latest iteration had 2298 on Jan 5, and we hit 2282 on Jan 6.  Now that we’re here, it’s a good time to review the rest of the forecast, and see if our last downside targets still make sense.
continued for members…
Our first real downside test should come at the SMA10/20 at 2261.80. Note this is also the .786 line of the rising purple channel and the bottom of the small, rising white channel that provided the backtest. Below that, I’ve had 2210 as the target for mid-January for quite some time.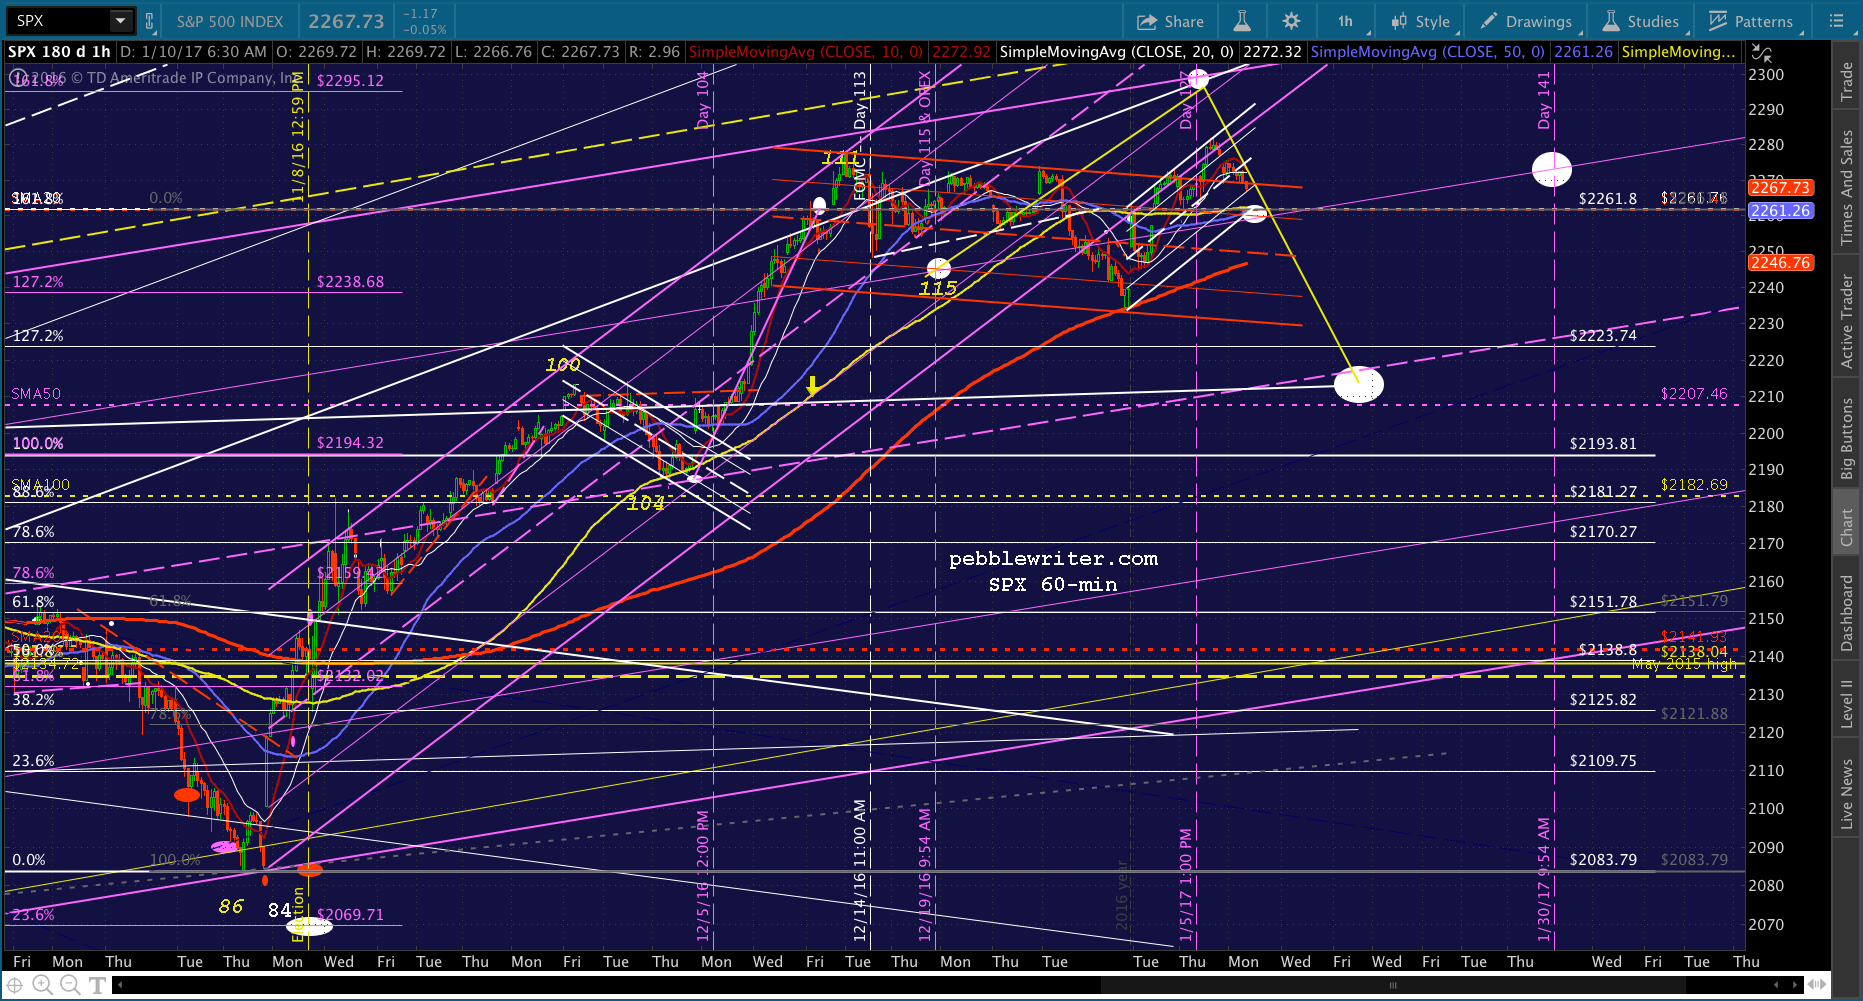
Note that 2210 is the midline of the large, rising purple channel from July, and would also represent a backtest of the rising white channel from which SPX broke out in November.
The white channel is easier to see on the chart below, even if the last 5 months is too busy to make out.
Here’s a slightly closer shot illustrating the white channel top is also the midline of the rising purple channel, which itself is set in between the rising yellow channel’s .236 and midline (the midline which was tagged on Dec 13 and marked the recent interim top.)
Any way you cut it, the smaller purple channel is done, having broken down on Dec 29 and backtested over the following week.
But, suppose we clear away everything from Nov 7 and treat the latest leg up not as a backtest, but part of the primary thrust. There is, in fact, a clean channel that can be drawn that captures the highs — if not the midpoints — fairly well.
I have no trouble with this interpretation except for the fact that a backtest of the major channels is long overdue.
In looking at 2007, the model for our current analog, we can see that the interim bottom on Day 134 helped legitimize the rising white channel from Aug 2007. 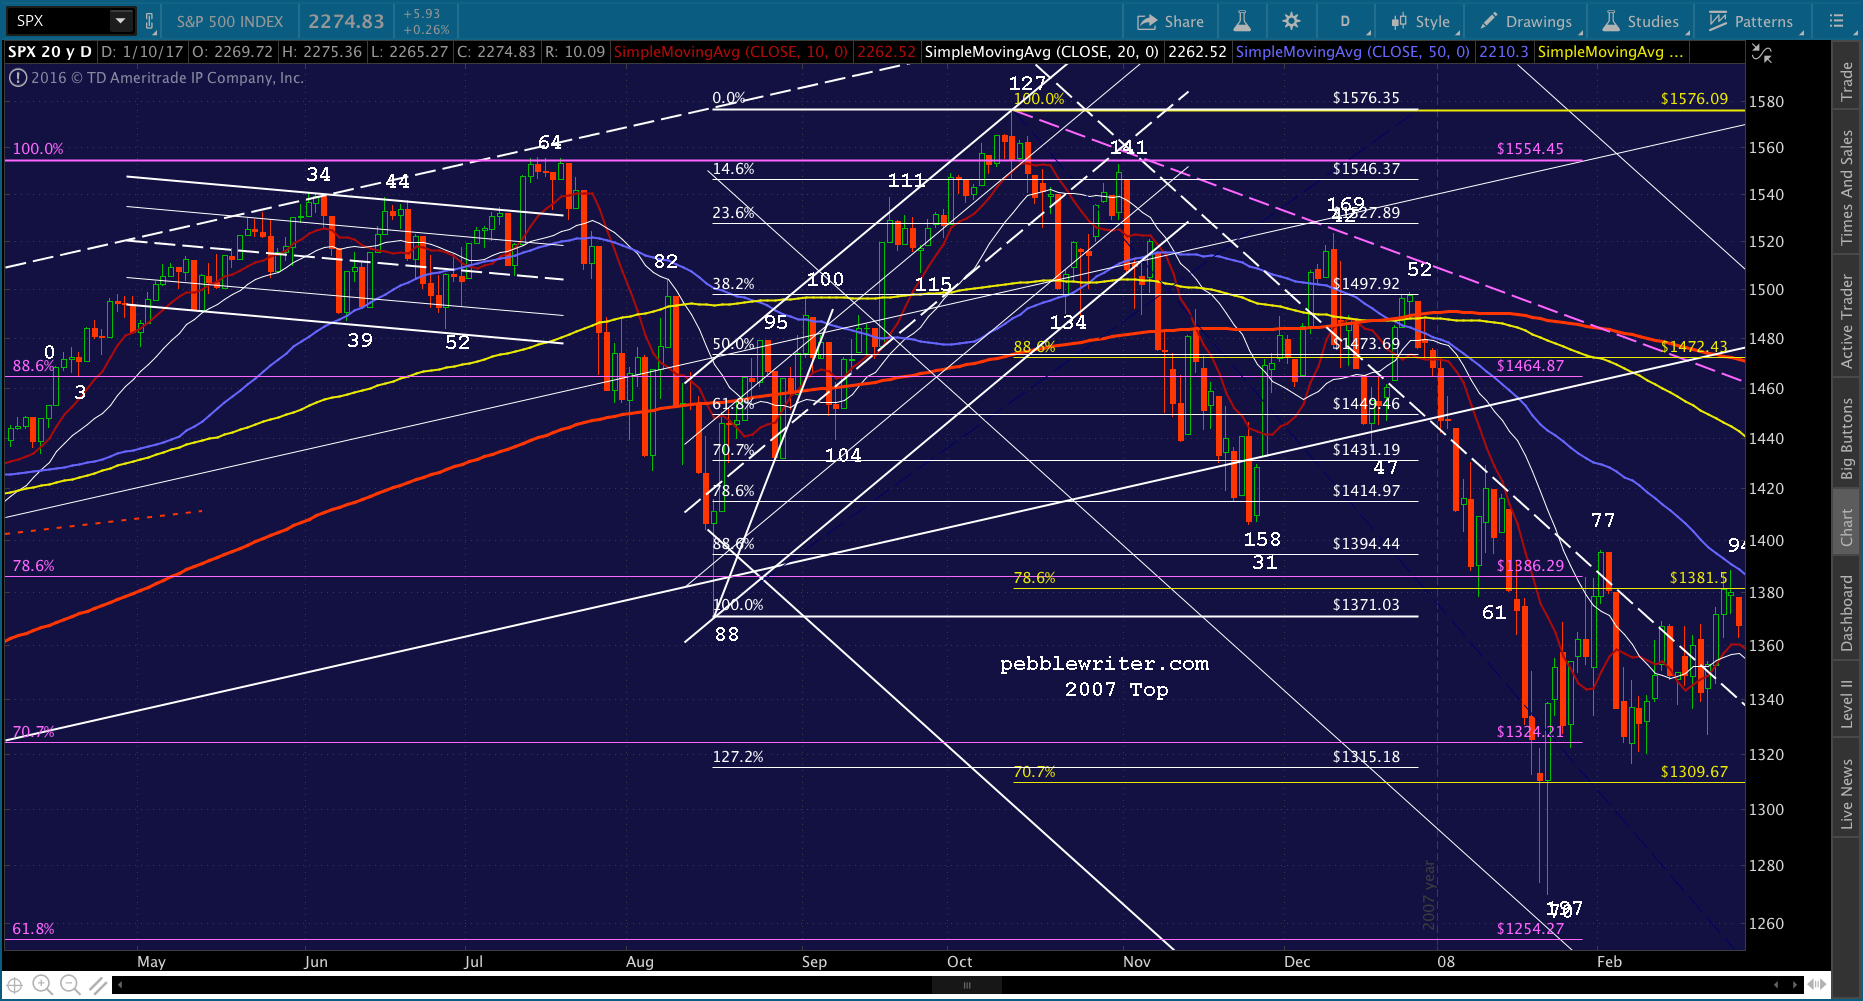
At 86 points and 5.5%, it wasn’t a big correction. The 72-pt, 3.2% drop from 2282 to 2210 would be even smaller.
We’ve talked more than a few times about catalysts. If SPX is going to break out of the 2007 analog — i.e., not drop 58% before it’s all over — there needs to be a significant lever applied. For the past several years, that has meant a spike in USDJPY and/or CL or a sharp decline in VIX.
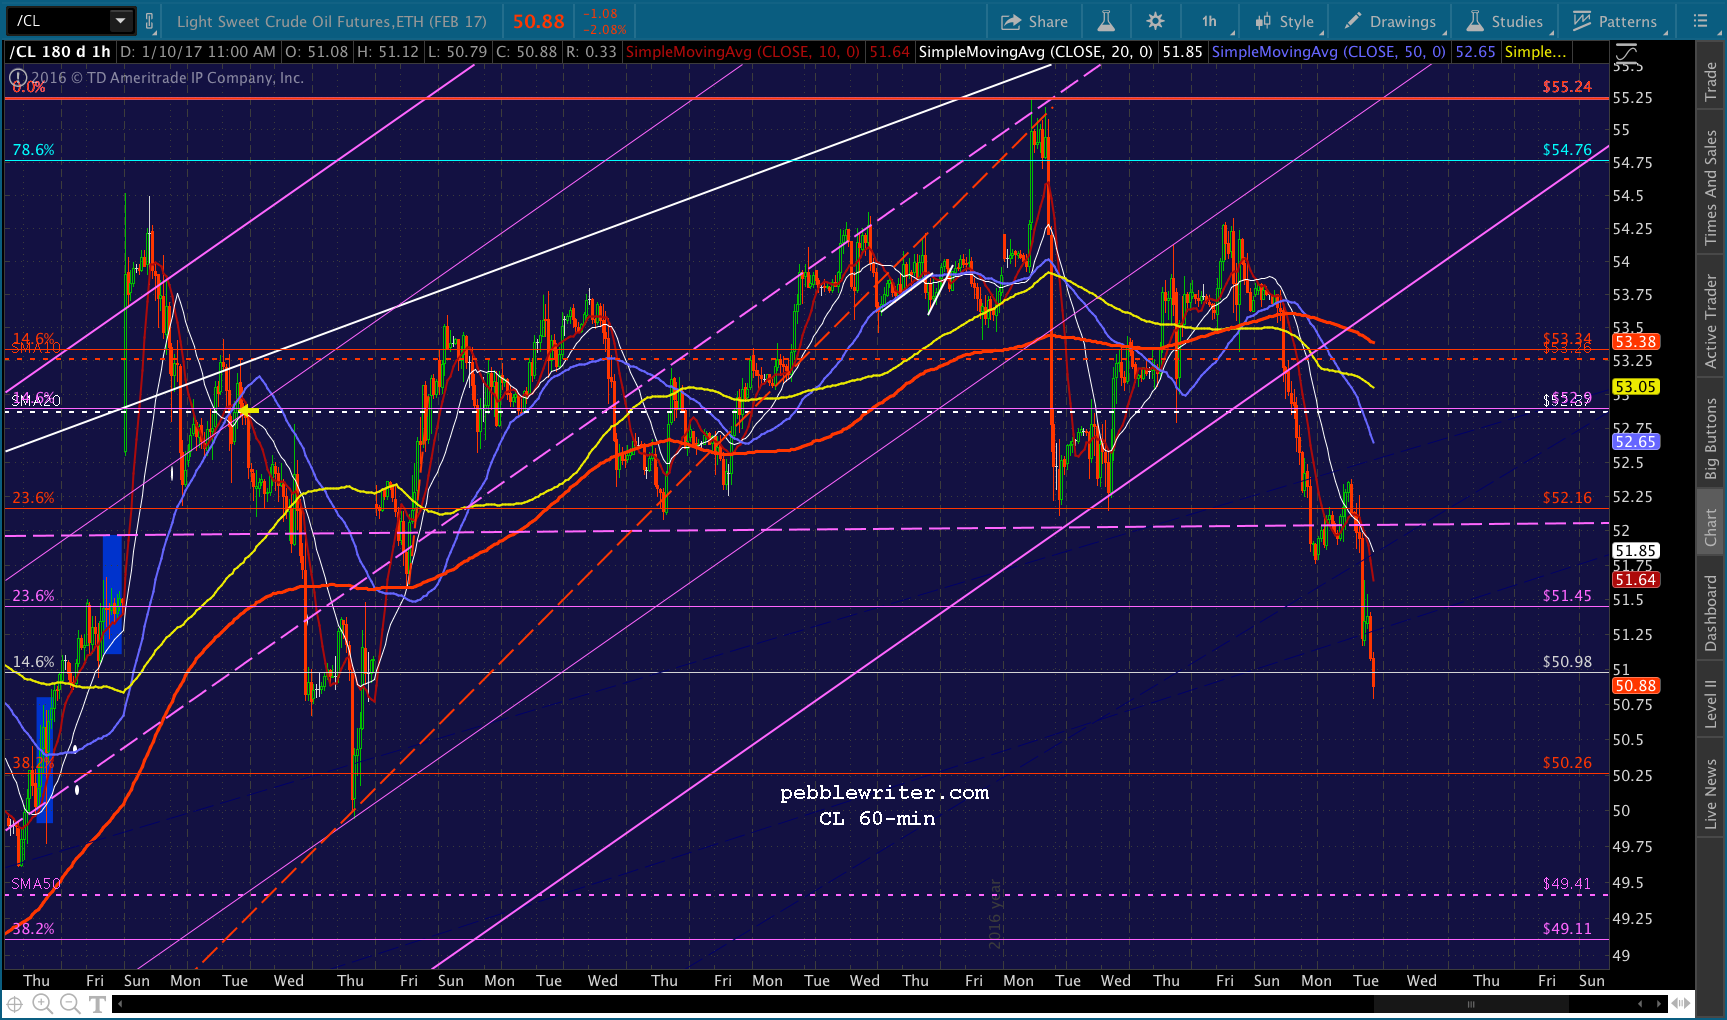
CL is still way too high. At 51.50, it is 21 higher than it was last year at this time — a 70% increase. AAA currently reports a nationwide average gas price of 2.365, a 20% increase from this time last year and a 26% increase from February 2016 lows. The next BLS CPI report, which will report the above information, will be released on Jan 18 or, as we know it, Day 134. Those looking ahead to the Jan 31-Feb 1 FOMC meeting might deem the info bearish.
11:49 AM…SPX just closed the gap from Friday. For anyone who’s not already short, 2277.05 will likely be a nice entry point.

USDJPY, which just broke down last Thursday, can either decline further here or bump along sideways. The key, I believe, is to be available for a spike up to 120.11 over the next week or so — ideally around Feb 11 — and then a “breakout” in early March.
It needn’t be an actual breakout — just a higher high that’s above 120.11, much like what happened between Dec 2014 and Feb 2016.
At that point, it gets interesting. It doesn’t matter much if the yen is losing value while CL is getting cheaper. But, if it happens on top of CL getting more expensive, the Japanese will rightfully complain loud and long.
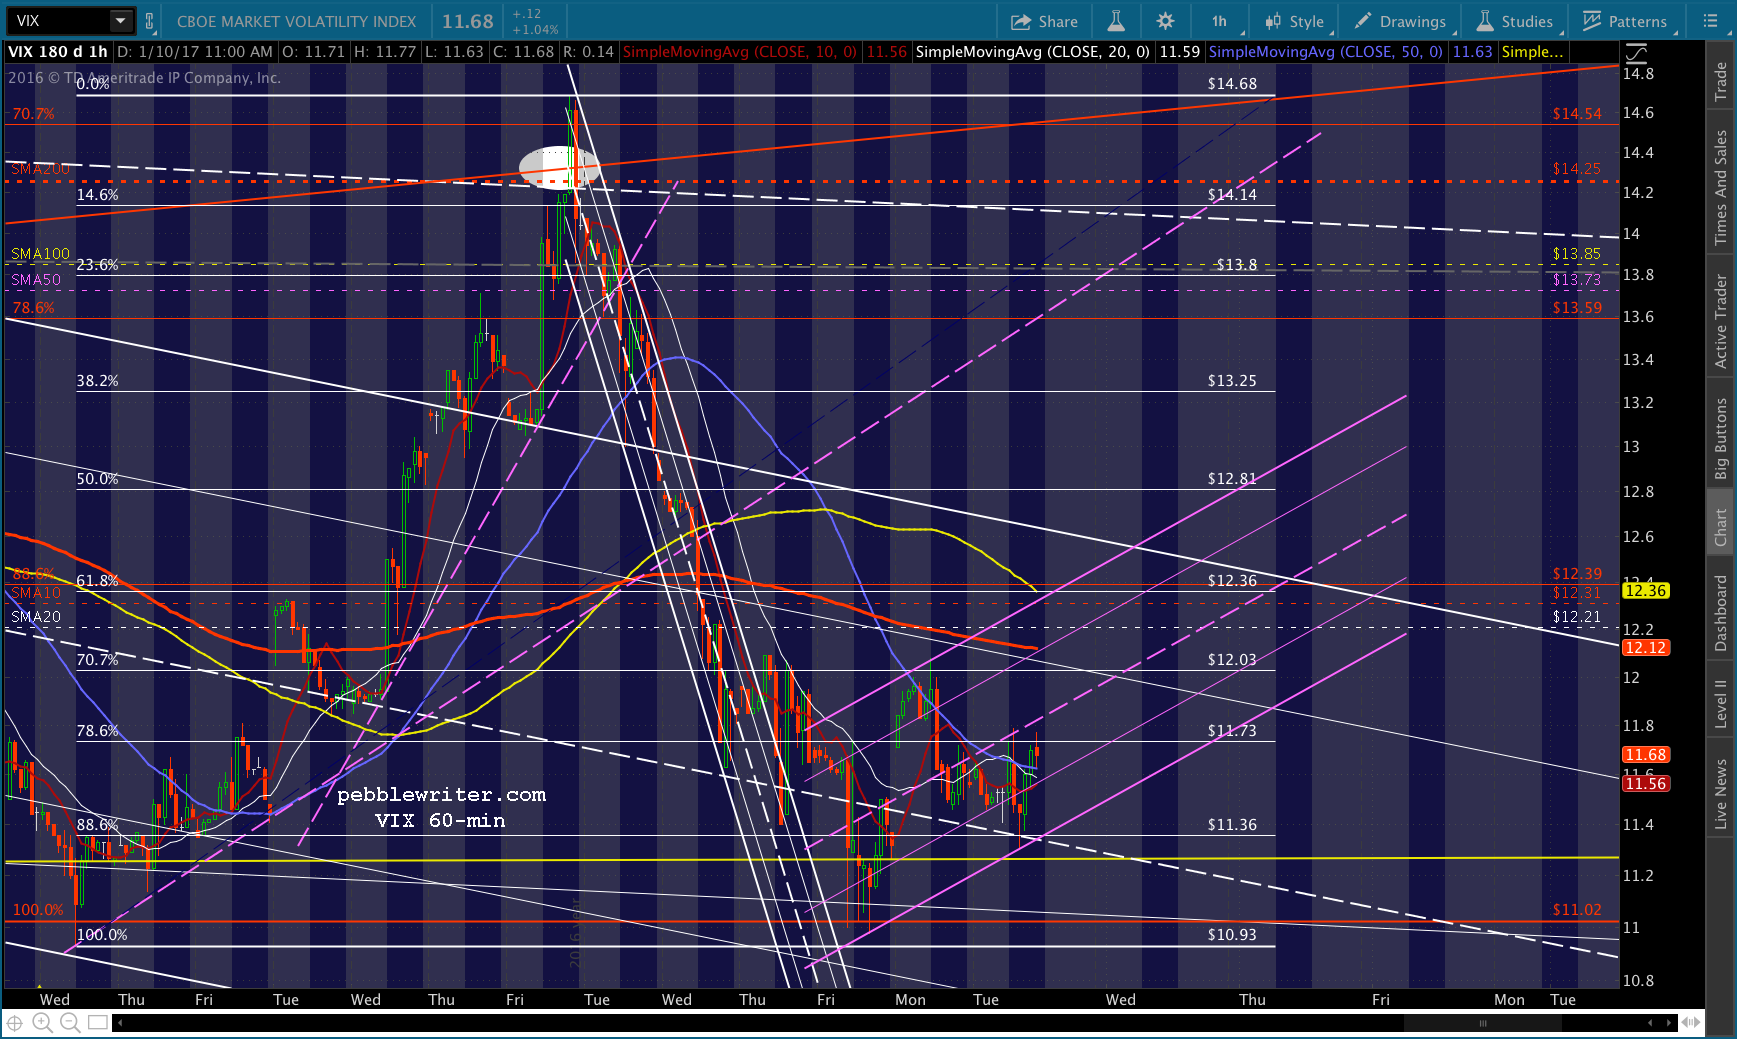
My expectation is that CL will tumble sharply between now and Feb 11, while USDJPY and DX prop it up on the expectation of higher interest rates. VIX can also be helpful. As we’ve seen today, a quick drop can work wonders in keeping stocks afloat while CL drops.
If things get out of hand to the downside (+3%?) VIX has the potential to break down below its yellow channel bottom. It would be unorthodox, and completely unjustified. But, VIX has long since ceased to be an indication of risk.
And, as tidy a channel as the yellow one is, it has only been one since 2010. If we expand the VIX chart, we can see several periods where VIX declined below 10 and made kamikaze dives towards it. Naturally, these occurred at times when TPTB were trying to get SPX up over harmonic resistance (the purple grid.)
The period from Mar 14 – 21, when VIX fell from 21.25 to 11.21 in order to push SPX up over its .886 and, then, its 2000 highs, looks quite a bit like the price action from this past November, when VIX was critical to reversing equities’ initial plunge following the US election results.
UPDATE: 2:45 PM
Going into the last hour, and SPX is back down to breakeven on the day after closing Friday’s gap. 2261 still looks good, either this afternoon or tomorrow morning. Shorting CL still looks great, and VIX looks good for a pop to at least the white channel top at 12.40ish. I’m going to take off the rest of the day, will post more this afternoon after the close. GLTA.