Everyone has their own opinion about what the FOMC will announce today. Let’s see what the charts are saying.
The 2s10s continues to tighten, closing yesterday at 13.9 bps — extremely close to a .886 retracement of the rise from -0.19 to 2.91 between 2006 and 2011. Is the Fibonacci .886 important?
It mattered a great deal in Feb 2006 when the 2s10s reversed very close to an .886 retracement of the runup from -0.52 to 2.75. And, as we’ve discussed many times, it’s not the flattening of the yield curve that deflates stocks. It’s the rapid steepening.
The 2s10s is also sitting at the bottom of a falling channel and a falling wedge — both of which also suggest a reversal.  Having said that, the 2s10s recently broke trend to the downside again. Per our yield curve model, a drop through the yellow TL spells trouble for stocks. A breakout above the red TL is also bearish.
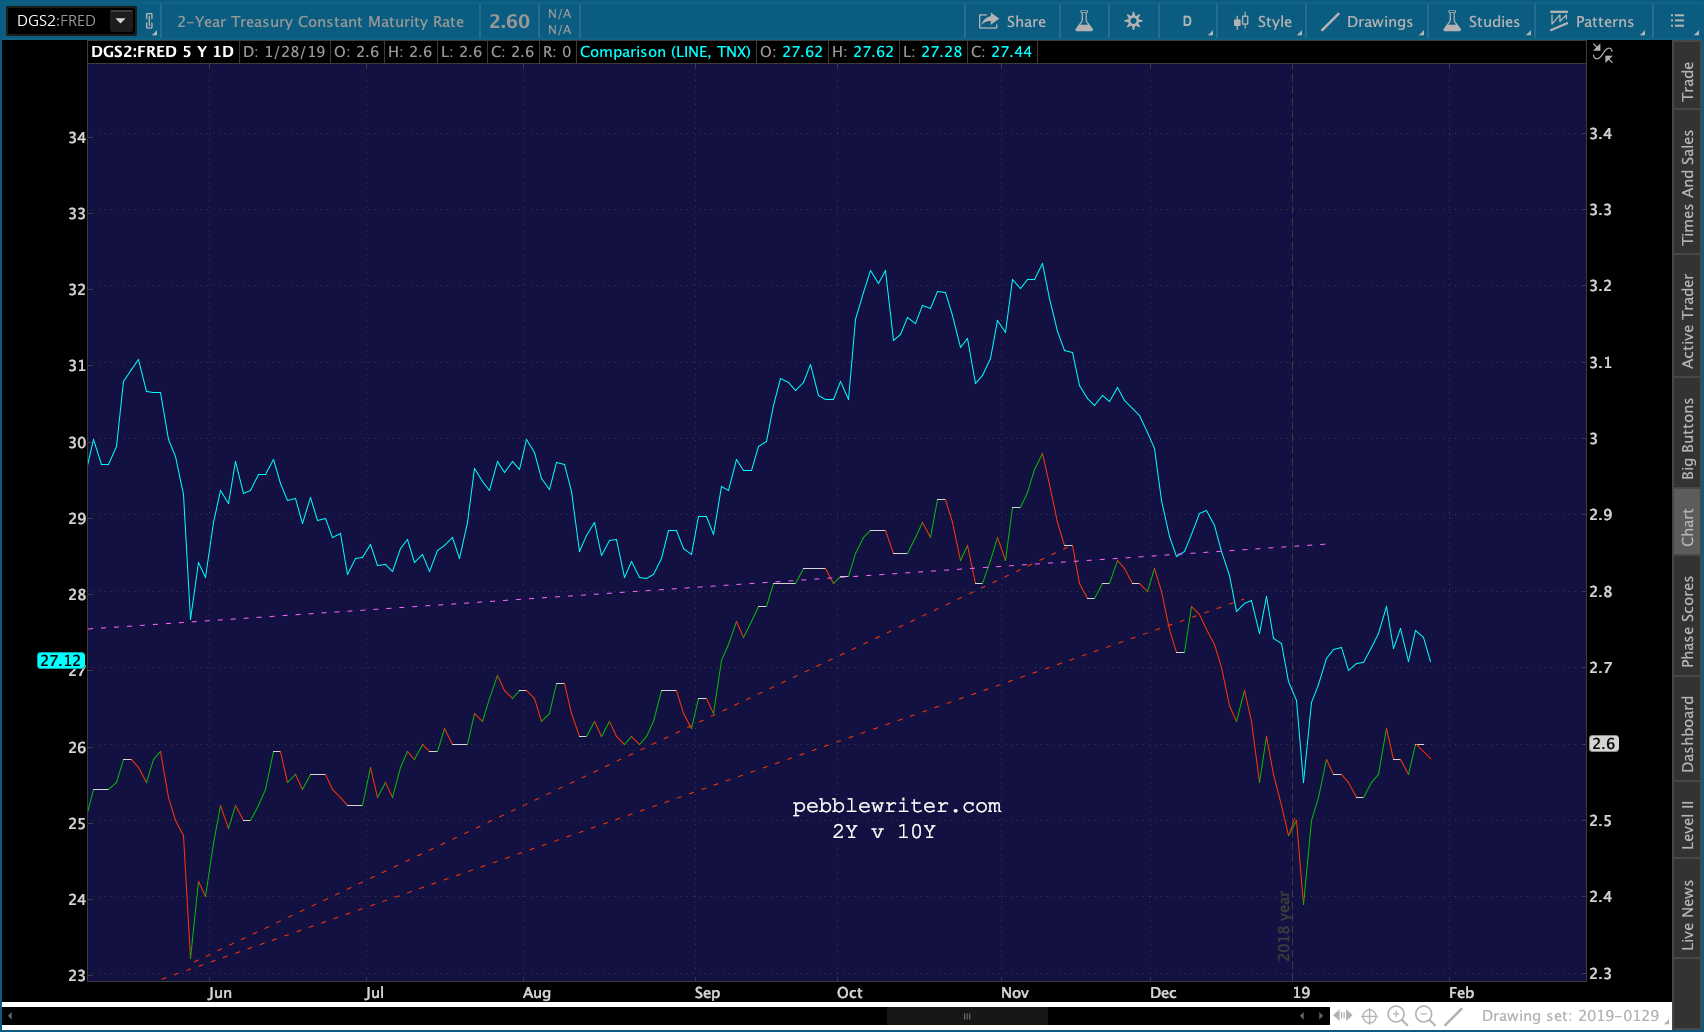
About the only bullish move would be to consolidate through late February without making new lows or breaking out. By then, it will have to choose one or the other. Both the 2Y and the 10Y have been sliding since oil and gas prices peaked on Oct 3. Our premise, which proved correct, was that oil and gas would slide sharply to prevent inflation and interest rates from pushing to a level that upsets the markets: 3% for CPI and the 10Y.
 With YoY comparisons in gas prices (the most volatile and immediate impact on CPI) going negative, CPI should be much closer to 1% than 2% in the next month or so. Without at least a minor recovery in oil and gas prices, CPI could fall to or even below 0%.
 As a result, the FOMC obviously cannot justify further rate hikes. In the absence of a recovery in oil and gas prices, there is a much better chance of a rate cut. All else being equal, the decision will likely rest on whether the oil and gas price declines persist or prove to be transitory.
Central banks have managed the fallout quite well so far. The EURUSD, which has looked likely to bounce up to its SMA200 ever since October, has instead waited patiently for the SMA200 to come to it. As a result, DXY has held up remarkably well…
  …and, TNX is well behind the curve in reflecting plunging CPI.
 This has produced a nice bounce in ZN since our bottom call in October, with more upside likely ahead.
 The trick will be how to accommodate such a move without trashing stocks.
continued for members… (more…)


 To be sure, there are half a dozen defenders in between here and a score – starting with 380-lb All-Pro VIX. Its 200-DMA at 16.54 is now resistance, and it has a reputation for cheap shots.
 Thanks to exhaustive scouting, though, our yield curve model suggests there’s a weakness in the defense that offers bears a clear path to the end zone — if they don’t fumble the ball.