

Everyone has their own opinion about what the FOMC will announce today. Let’s see what the charts are saying.
The 2s10s continues to tighten, closing yesterday at 13.9 bps — extremely close to a .886 retracement of the rise from -0.19 to 2.91 between 2006 and 2011. Is the Fibonacci .886 important?
It mattered a great deal in Feb 2006 when the 2s10s reversed very close to an .886 retracement of the runup from -0.52 to 2.75. And, as we’ve discussed many times, it’s not the flattening of the yield curve that deflates stocks. It’s the rapid steepening.
The 2s10s is also sitting at the bottom of a falling channel and a falling wedge — both of which also suggest a reversal.  Having said that, the 2s10s recently broke trend to the downside again. Per our yield curve model, a drop through the yellow TL spells trouble for stocks. A breakout above the red TL is also bearish.
About the only bullish move would be to consolidate through late February without making new lows or breaking out. By then, it will have to choose one or the other. Both the 2Y and the 10Y have been sliding since oil and gas prices peaked on Oct 3. Our premise, which proved correct, was that oil and gas would slide sharply to prevent inflation and interest rates from pushing to a level that upsets the markets: 3% for CPI and the 10Y.
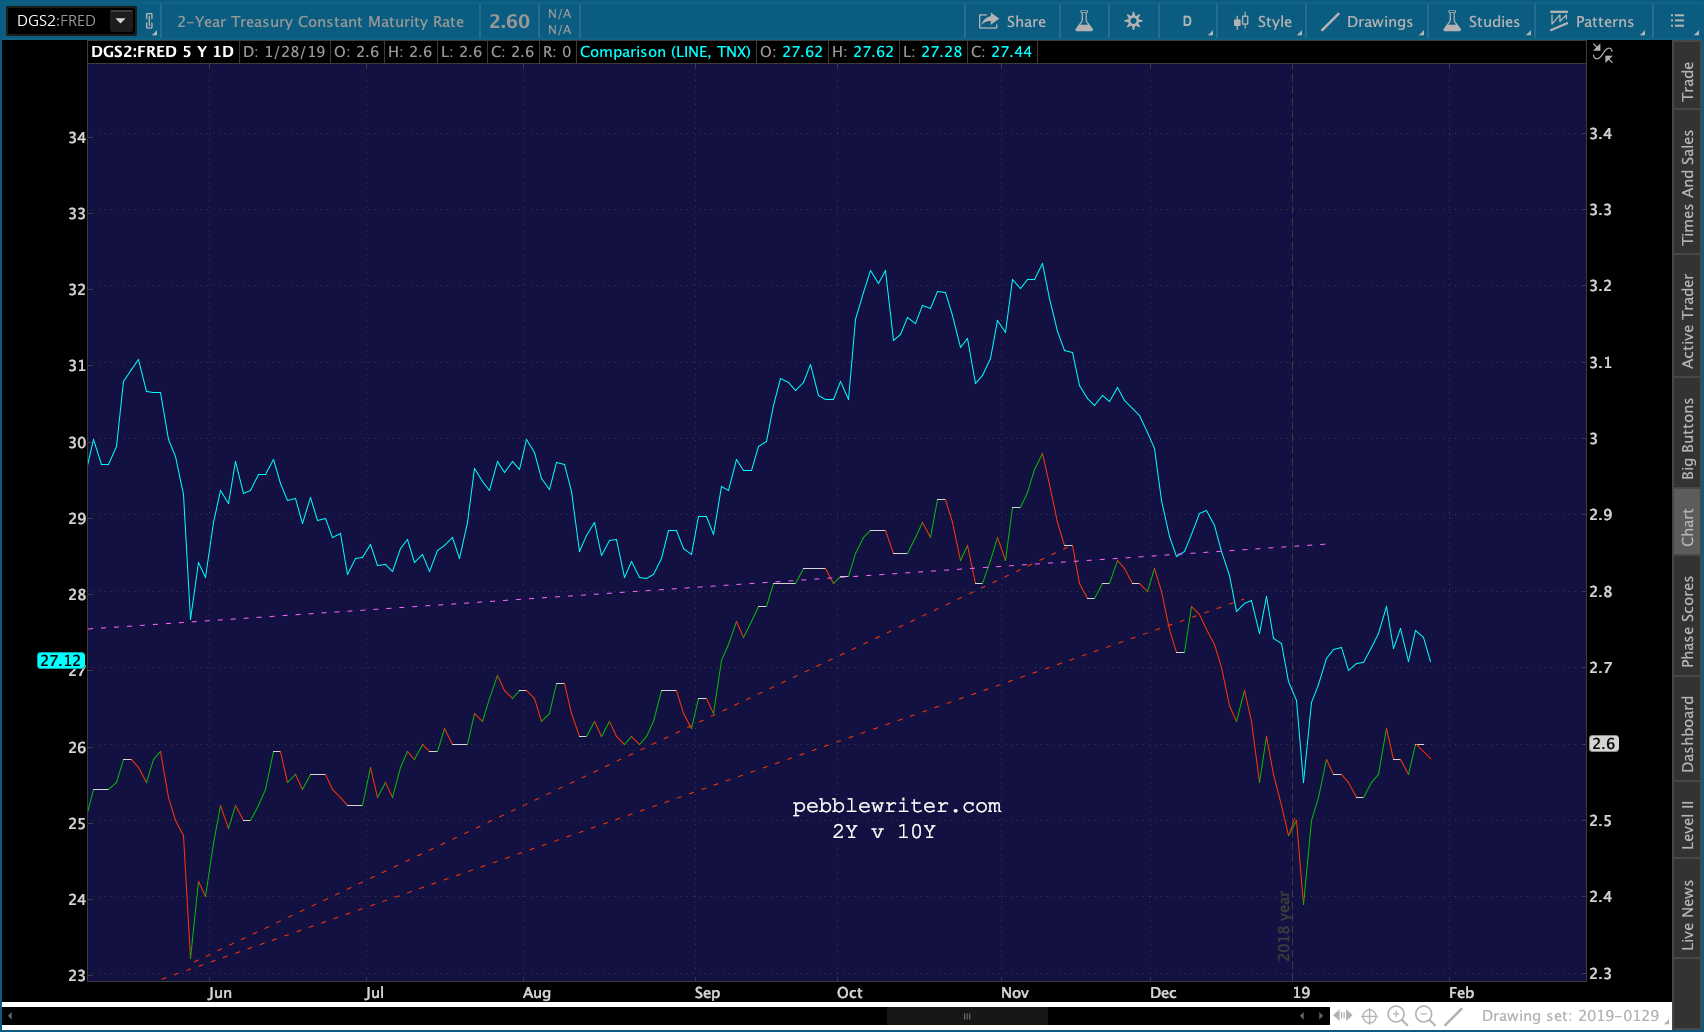 With YoY comparisons in gas prices (the most volatile and immediate impact on CPI) going negative, CPI should be much closer to 1% than 2% in the next month or so. Without at least a minor recovery in oil and gas prices, CPI could fall to or even below 0%.
 As a result, the FOMC obviously cannot justify further rate hikes. In the absence of a recovery in oil and gas prices, there is a much better chance of a rate cut. All else being equal, the decision will likely rest on whether the oil and gas price declines persist or prove to be transitory.
Central banks have managed the fallout quite well so far. The EURUSD, which has looked likely to bounce up to its SMA200 ever since October, has instead waited patiently for the SMA200 to come to it. As a result, DXY has held up remarkably well…
  …and, TNX is well behind the curve in reflecting plunging CPI.
 This has produced a nice bounce in ZN since our bottom call in October, with more upside likely ahead.
 The trick will be how to accommodate such a move without trashing stocks.
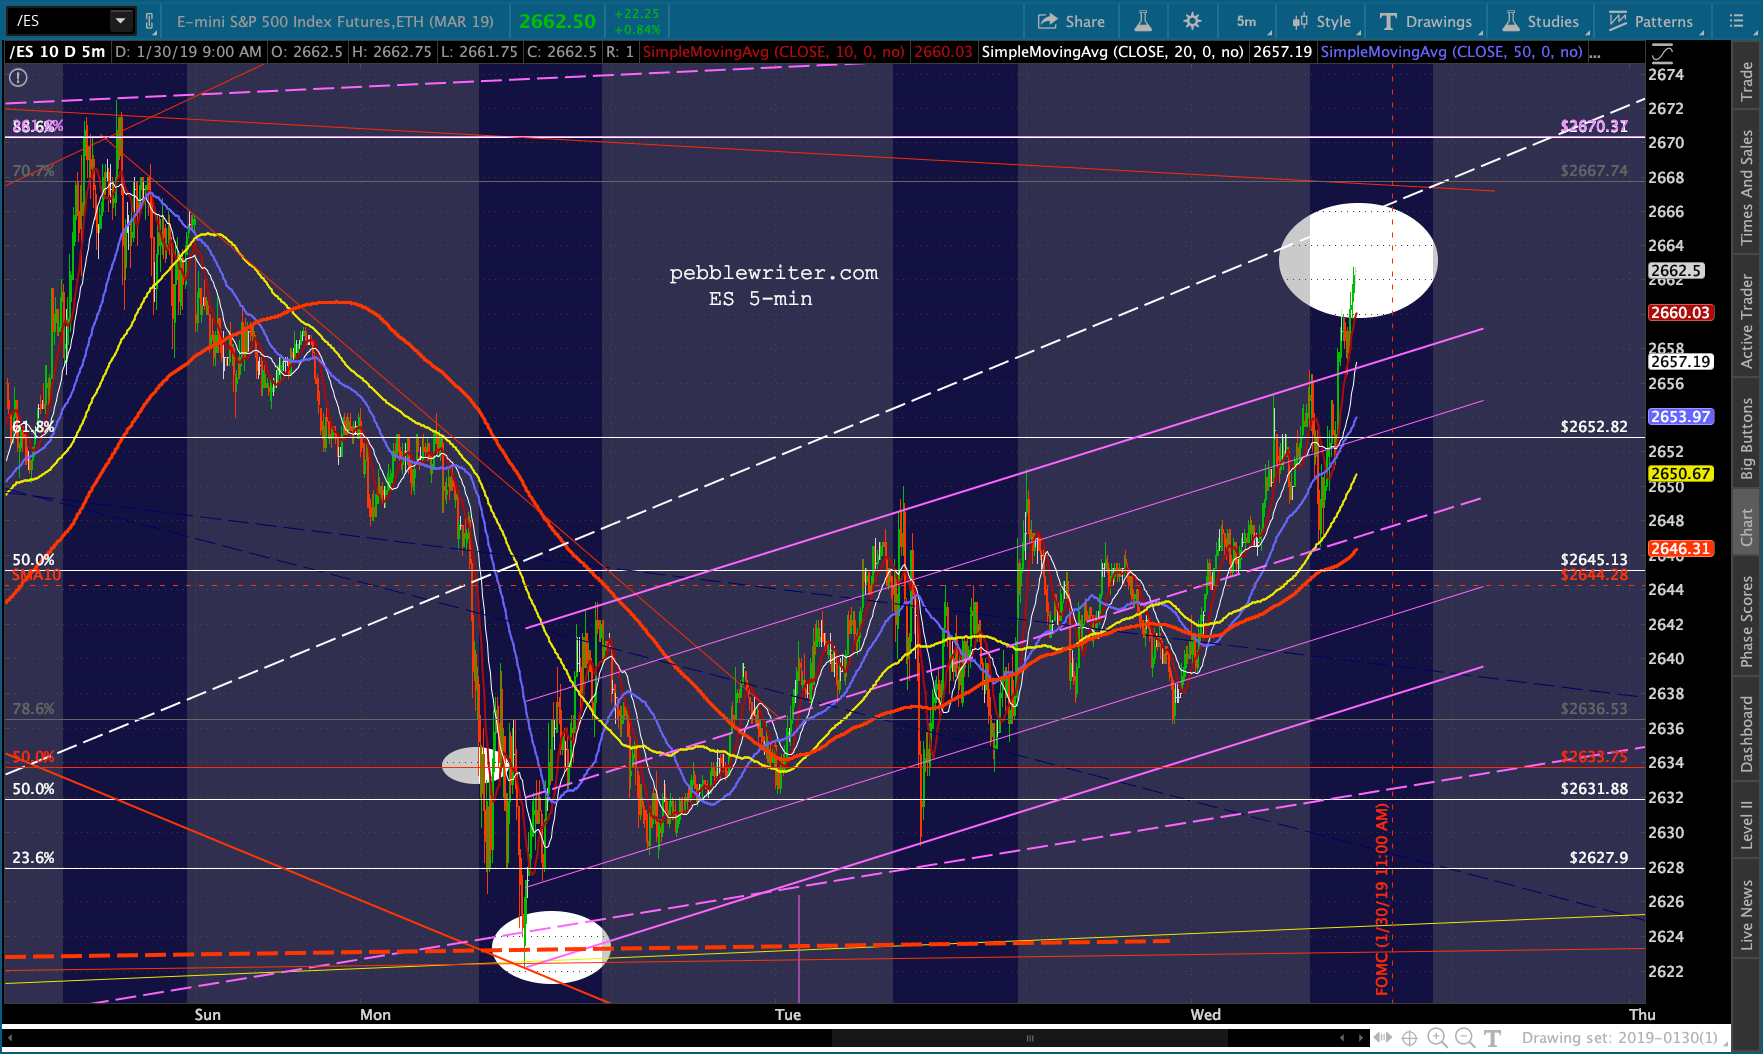
continued for members…Futures are up about 12 points at present, rallying nicely on AAPL’s breakout but with no breakout (yet) from the rising purple flag pattern. As we discussed yesterday, the key is the neckline for both ES and SPX. Above it, continue playing the upside. Below it, short. There remains a scenario where SPX declines very slightly to flesh out the rising purple channel.
 As the chart below shows, SPX has formed a megaphone pattern that could go either way. The rules of channels suggest a drop to the big, falling purple channel bottom.
  But, as we’ve seen over the past couple of weeks, the algos have been taking their marching orders from VIX – which, unless the few remaining carbon-based investors are spooked by Powell’s comments — has a clear path lower after having already broken down.
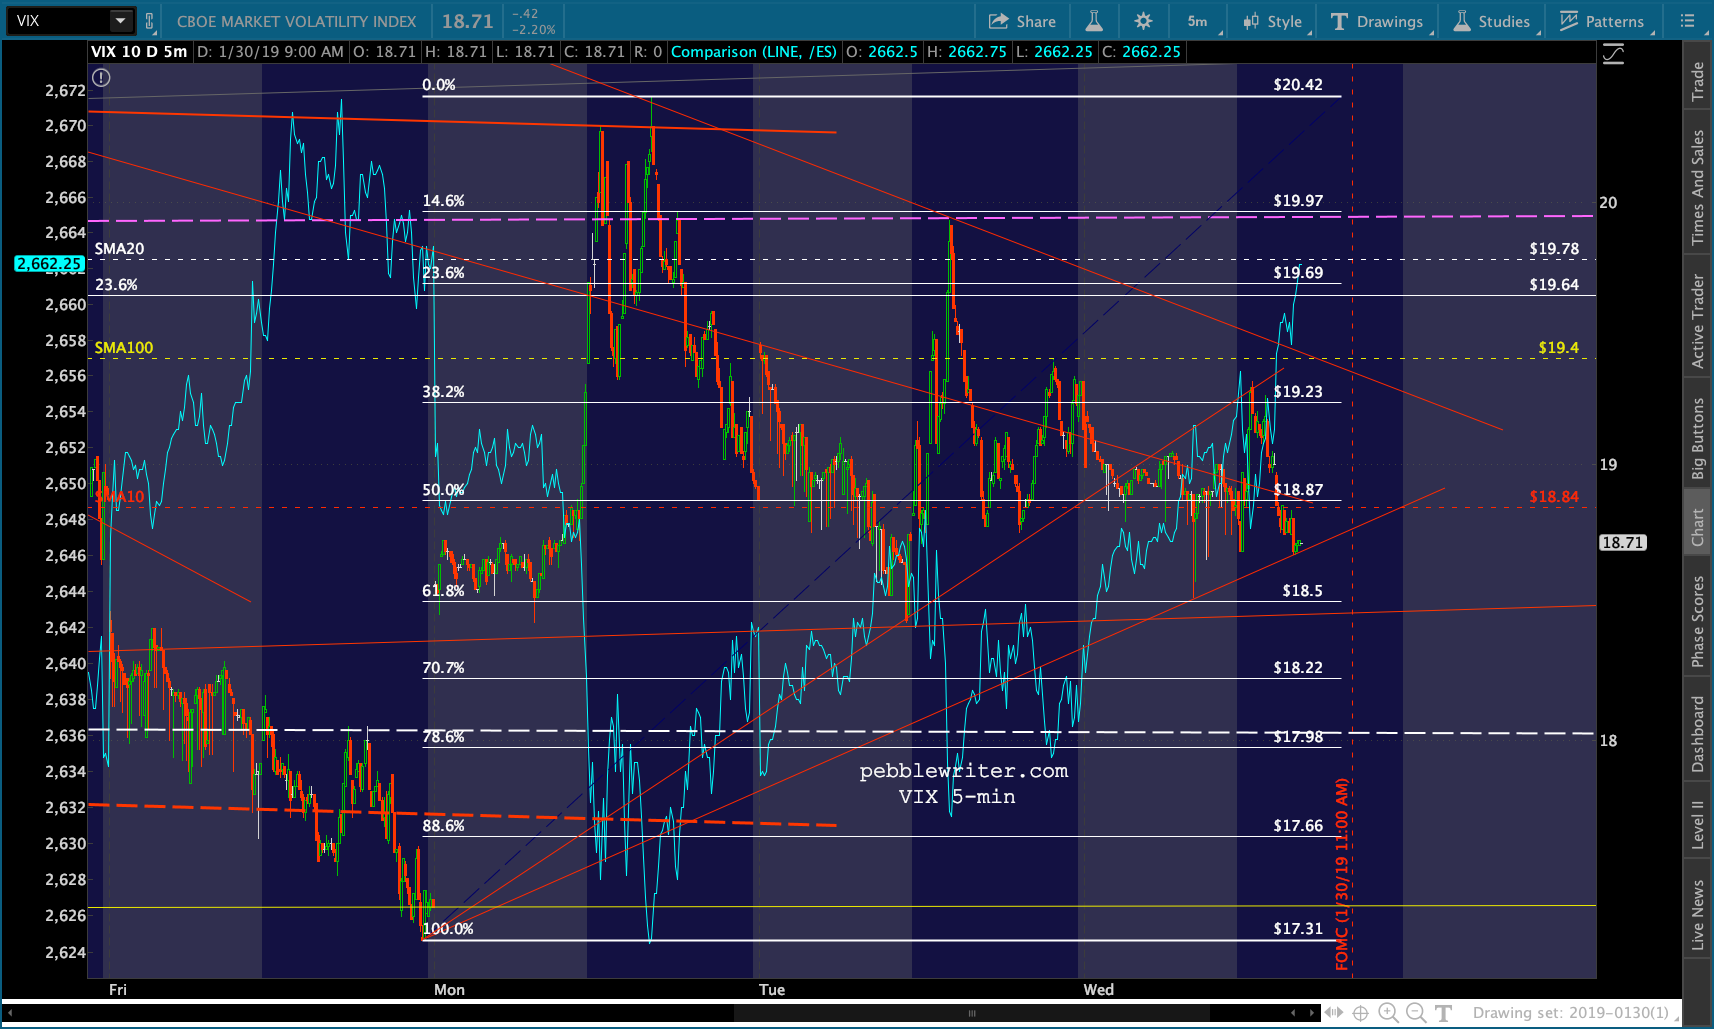
 VIX can send quick, important signals with very little effort by moving to one side or the other of its SMA10. It’s currently below it, signalling the all-clear for bulls. A move back above it means tighten up your stops. And, a breakout above the SMA100 at 19.4 means it’s probably time to short stocks.
 If Powell screws the pooch and spooks markets – say, with continuing, aggressive QT, then those lonely upside targets at 41-45 are still very legitimate.
 The other algo drivers…
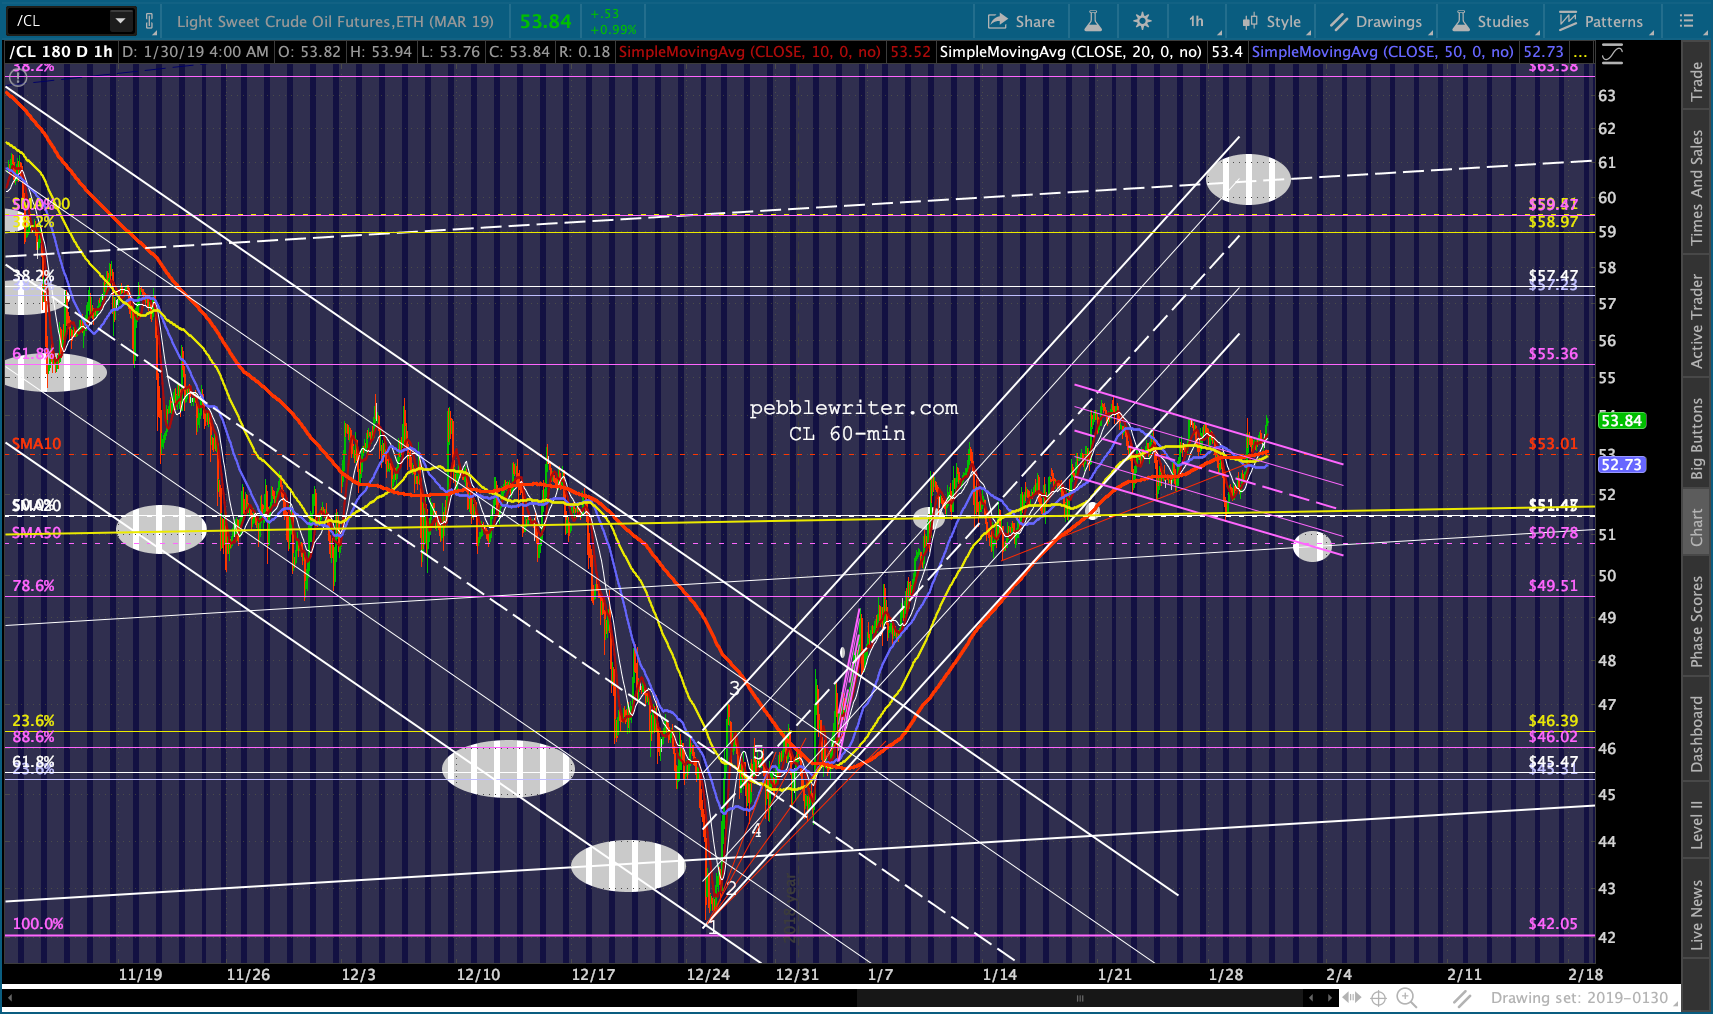
USDJPY, having broken down from the rising white channel, is moving higher in a backtest. And, RB and CL have both broken out of their corrective channels.
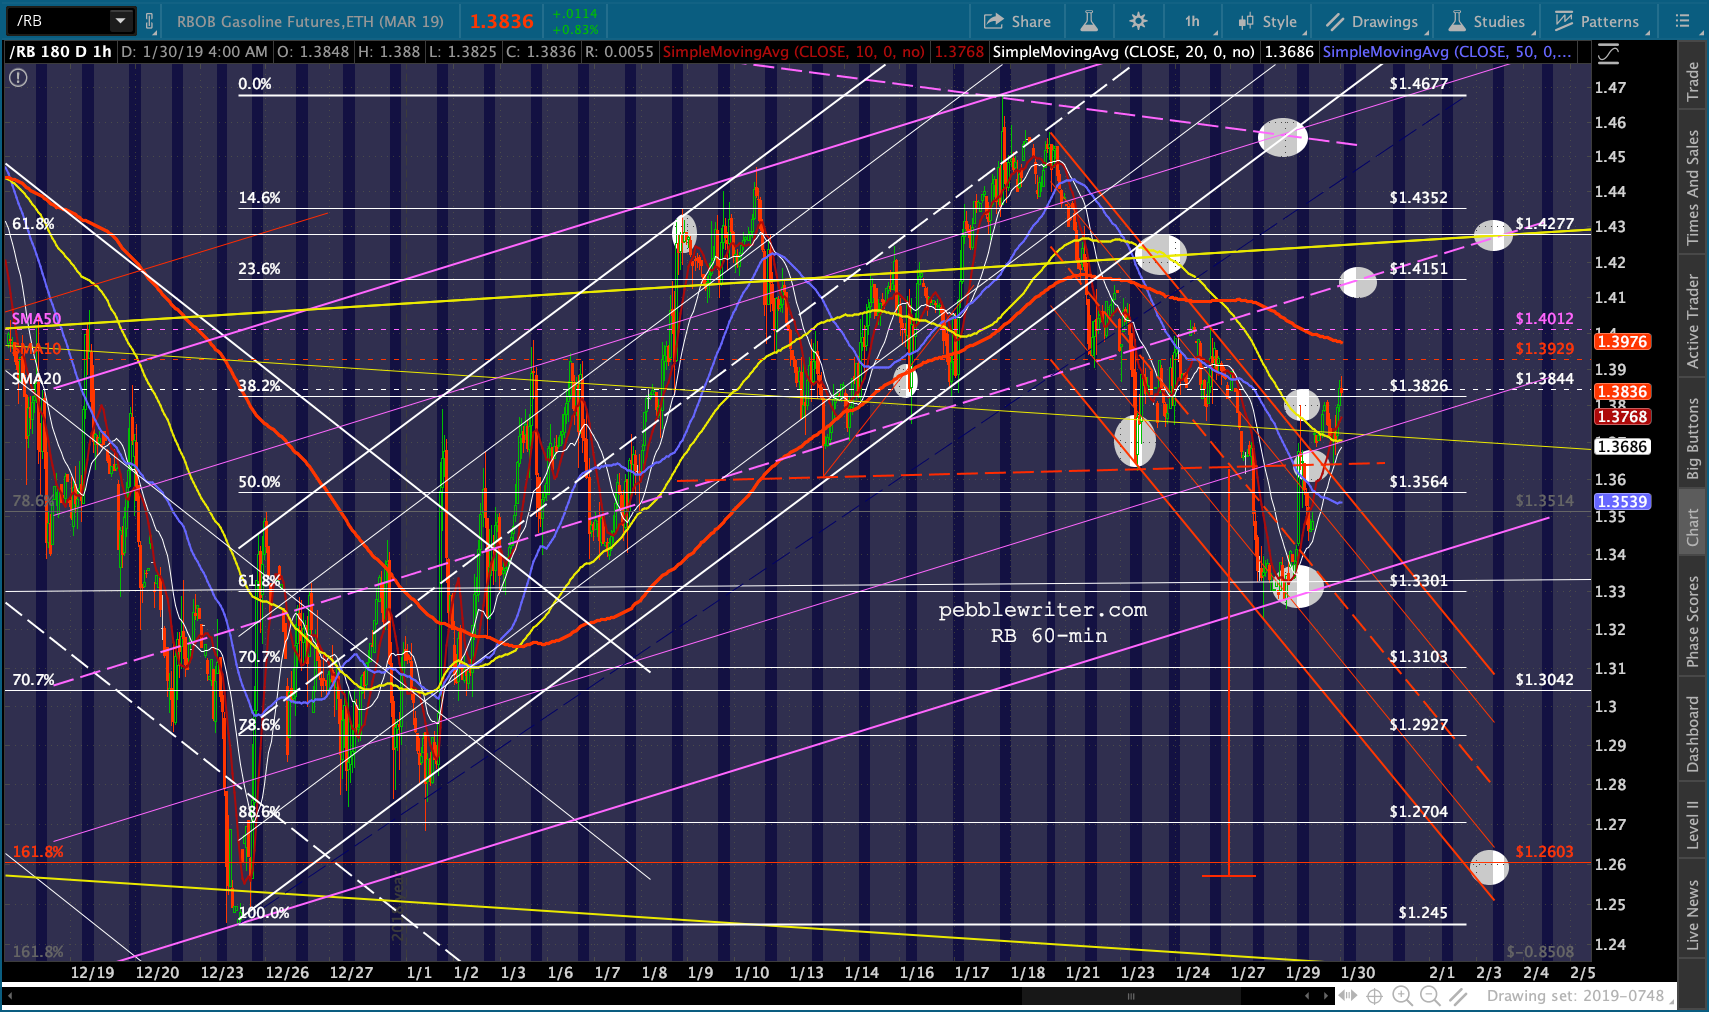
 The afore-mentioned breakout for AAPL…
  …and, the current state of affairs for COMP.
 And, it’s worth pointing out that GC is closing in on our .786 target.
 UPDATE: 10:00 AM
Nice reversal so far. ES could pick up some support at the channel midline, not to mention the SMA5 200 and SMA10 just below.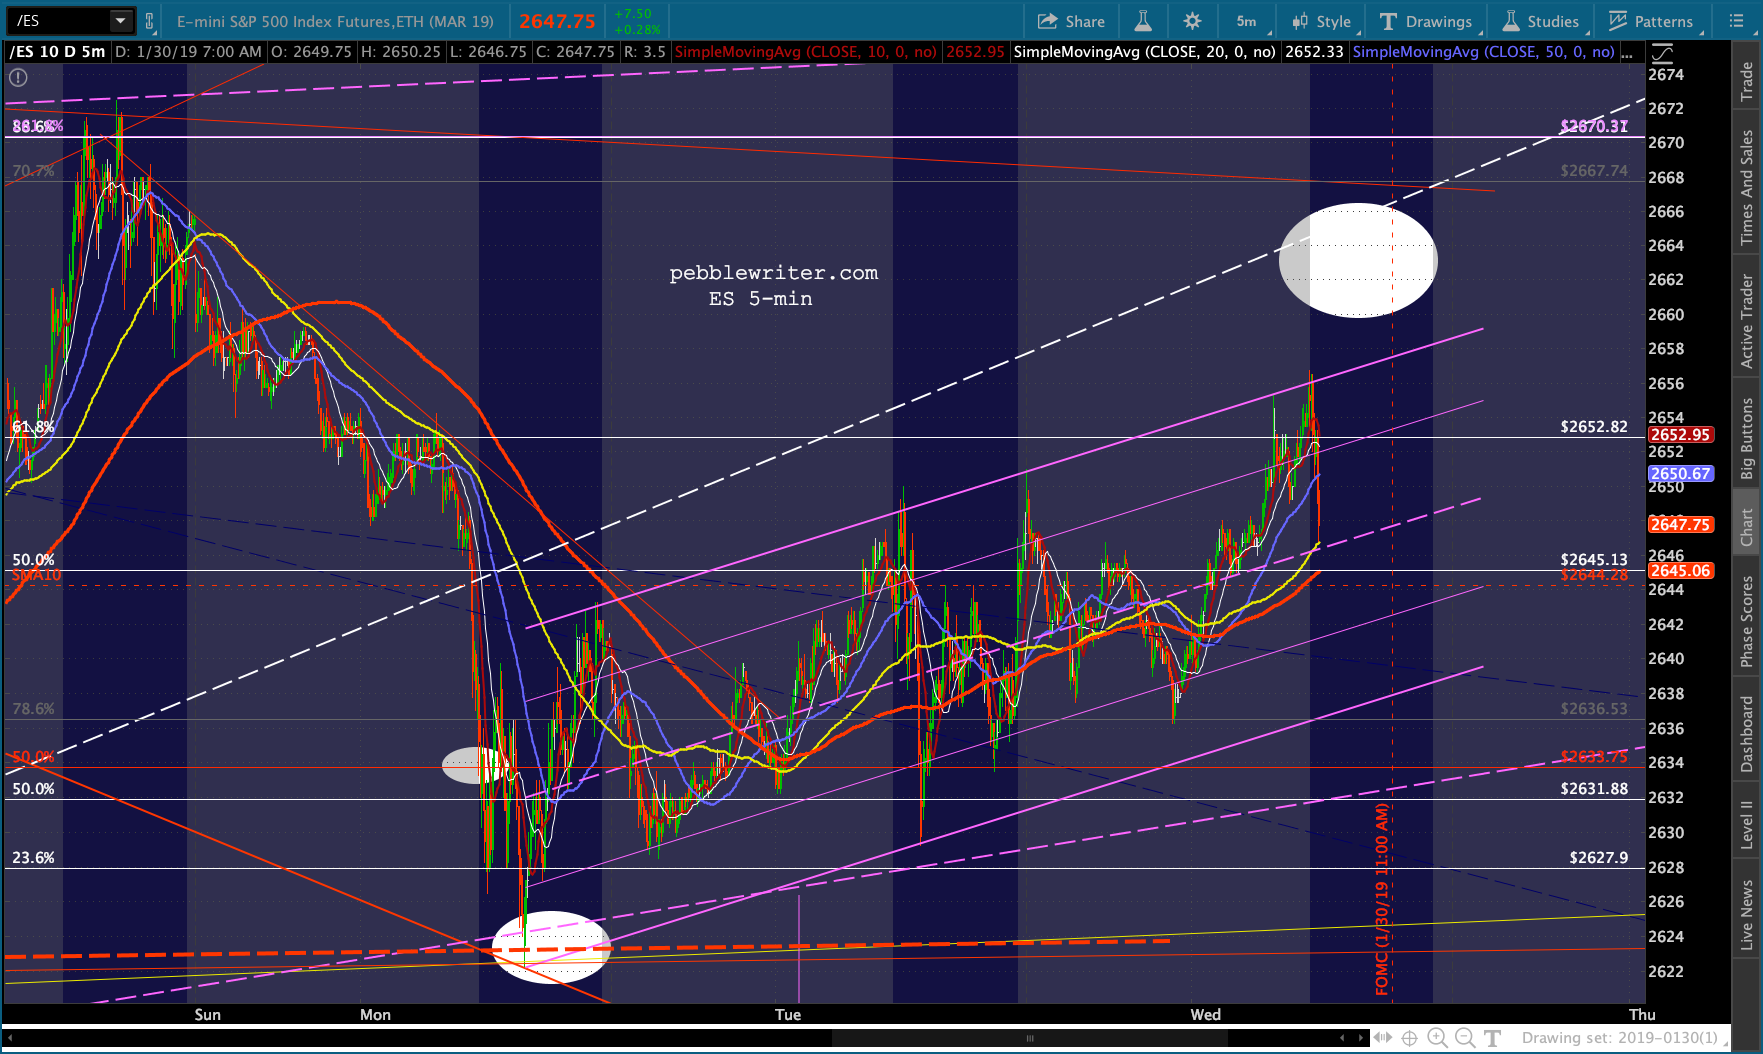 SMA’s SMA10 is a little lower, setting up a mismatch. Key initial support is where the purple neckline and SMA10 intersect at 2639.56 around 2:45 PM.
 VIX has popped back above its SMA10 and is headed for the SMA100.
 Remember AAPL’s breakout? It’s not one any more.
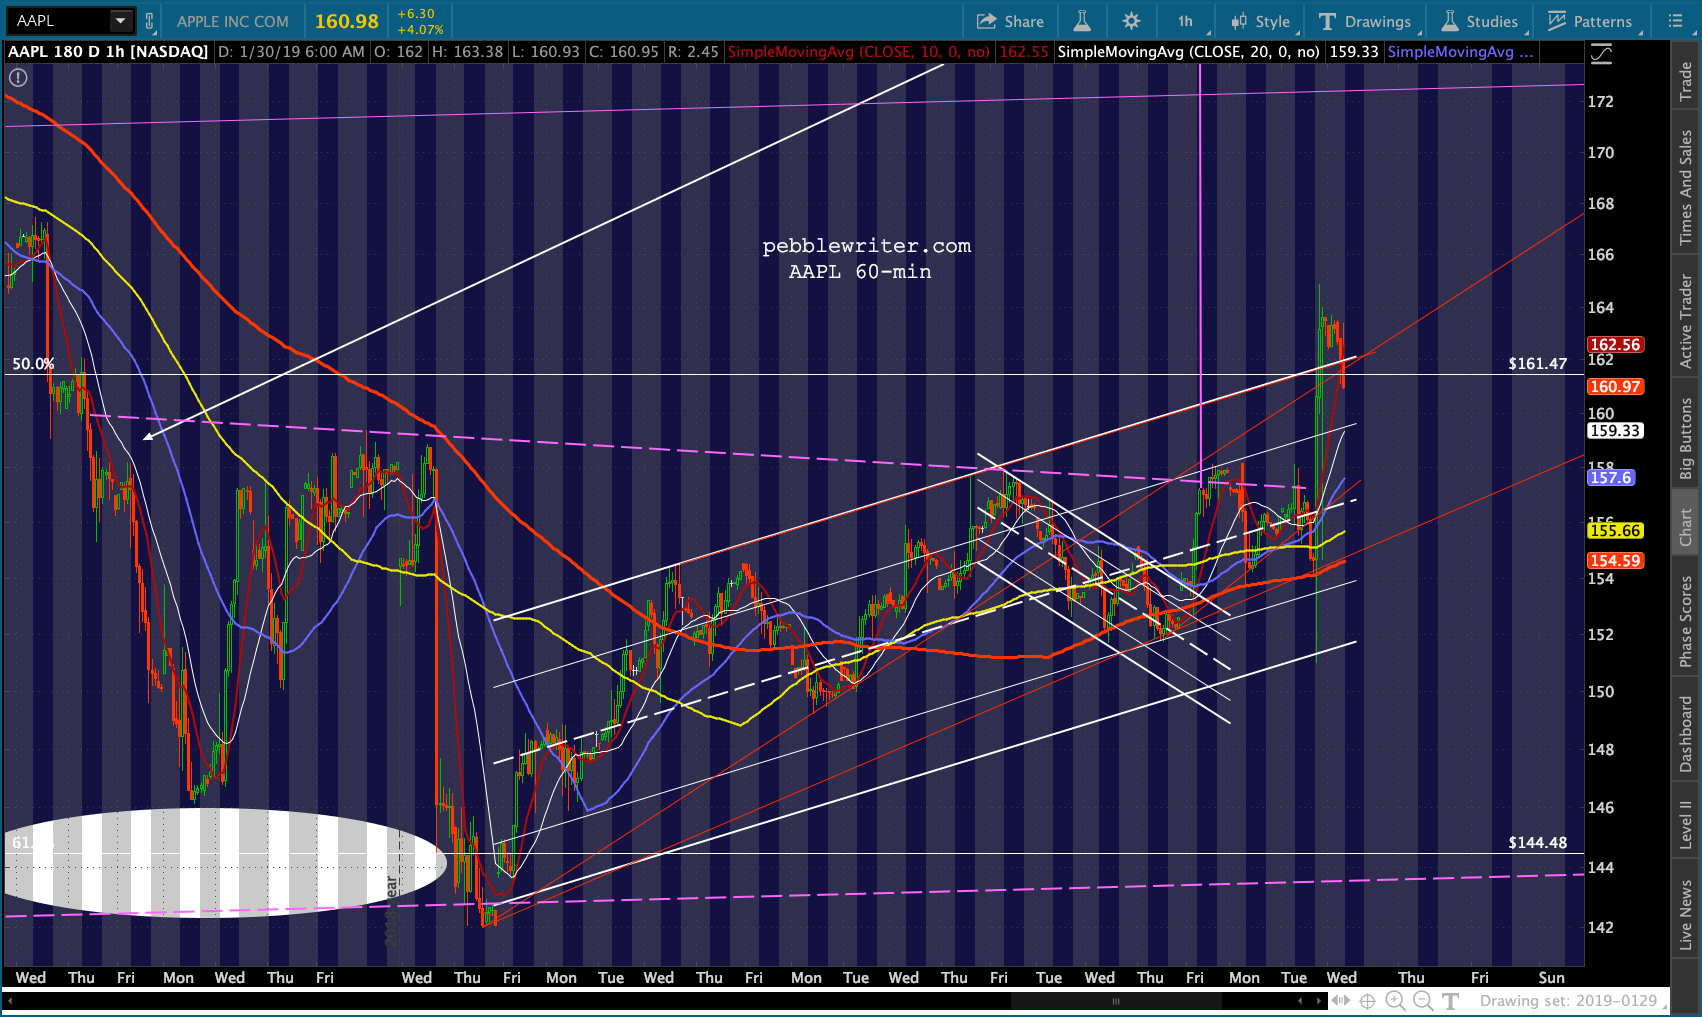 UPDATE: 10:40 AM
EIA inventories reported the first gasoline draw since November and a slight build in crude. We should see RB reverse here and digest its gains from 1.33. A backtest to the SMA50 at 1.4012, the SMA10 at 1.3929 or SMA20 at 1.3826 would make sense, particularly if it could be drawn out over several days to allow the purple channel .236 line to intersect. CL is less obvious, but we’re still due a backtest of the SMA50 at 50.78 or at least the broken purple channel top.
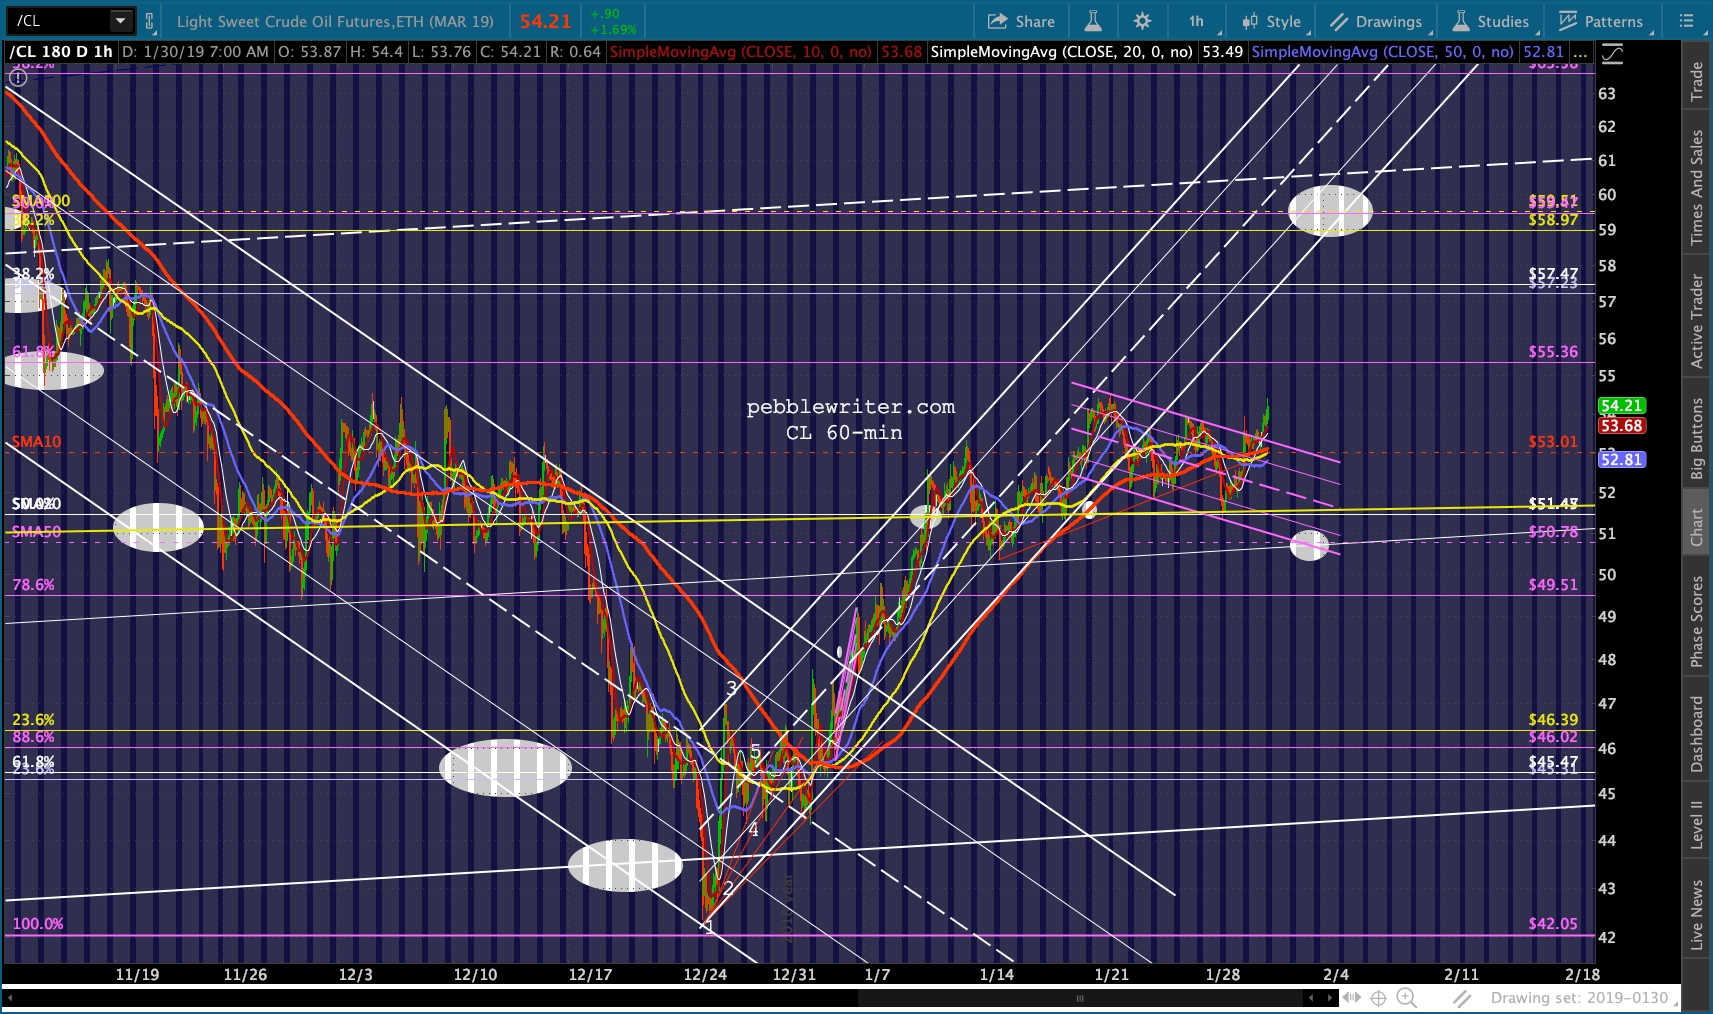
 UPDATE: 12:00 PM
ES just reached our breakout target as SPX reached the top of the megaphone, RB reached our secondary upside target and VIX a fan line from Monday’s lows. Important test all around…

 UPDATE: 2:20 PM
This is as far as it can go without a breakout of the megaphone pattern (technically, we’d be ok with an intraday rise above it, as long as it comes back down by the close.) Note that ES’ .618 is just above at 2706.24, followed by its 2.24 at 2728.79 and its SMA200 at 2742.72.
 Remember, SPX’s SMA200 is very interesting because a reversal there instead of current prices would set up an A=C next leg down to almost exactly 2138.
 As expected, the dollar is weakening against the euro and the yen. EURUSD is spiking higher…
 …as is USDJPY…
 …which is driving DXY toward our 94.2 target…
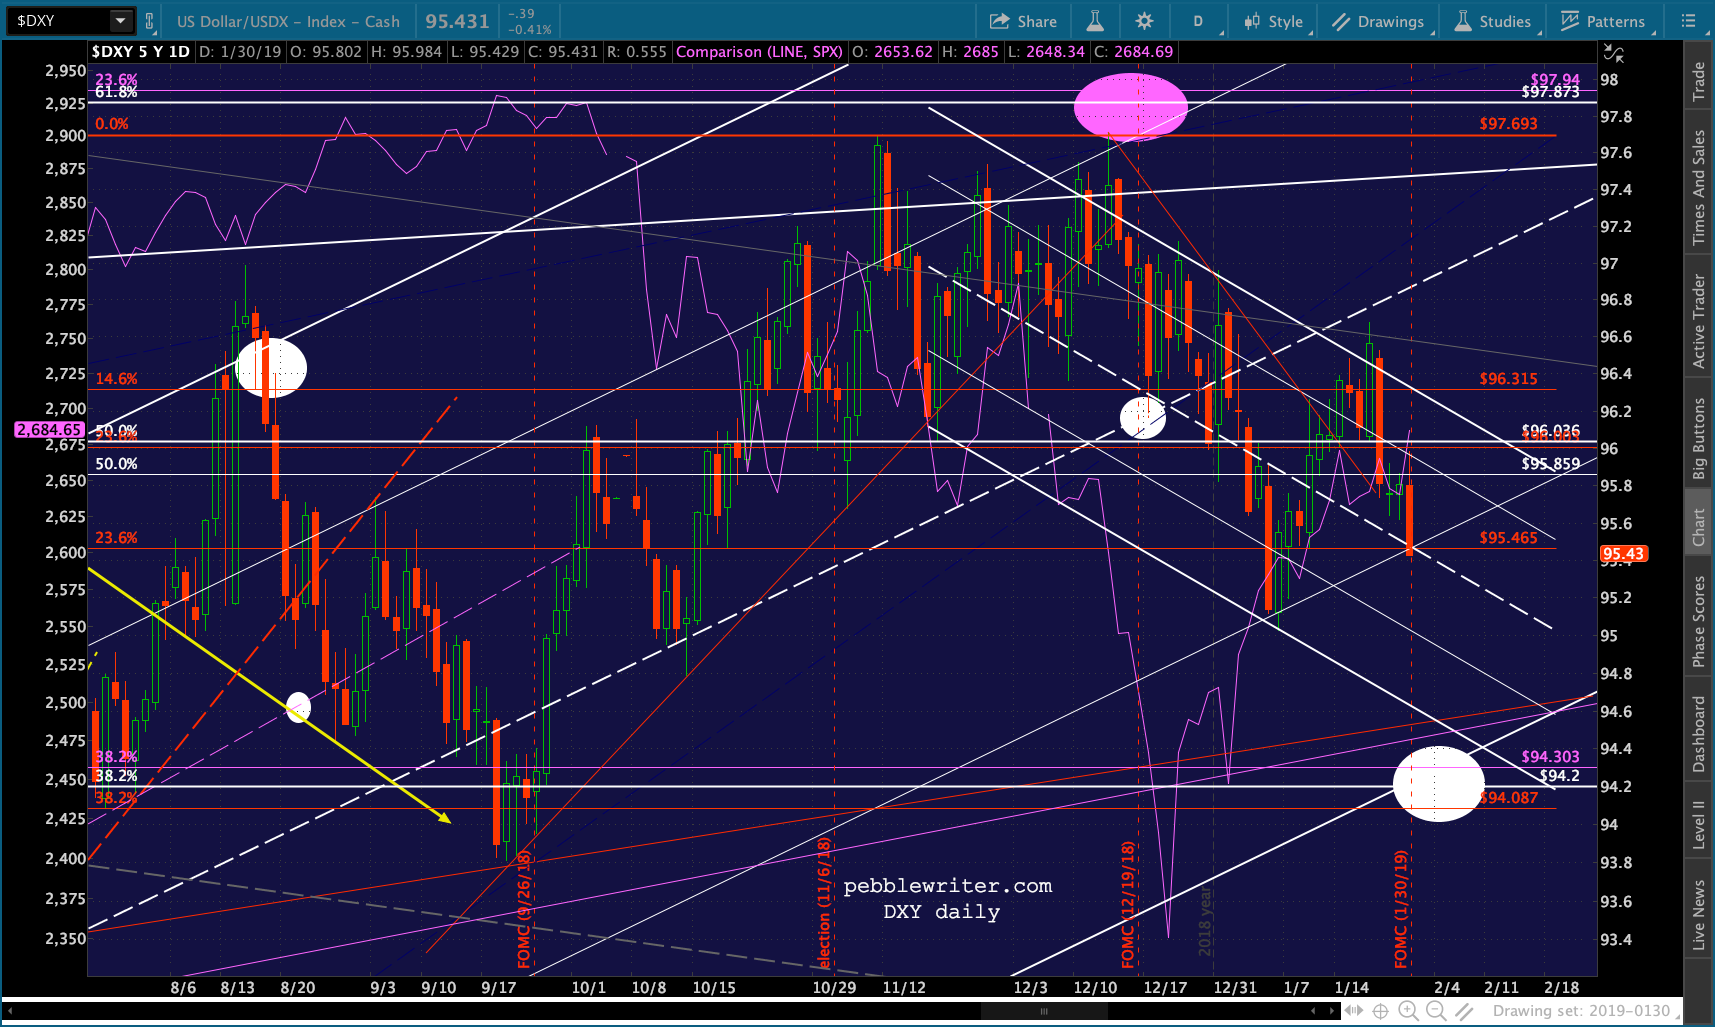 …and GC toward our 1326.1 target.
 VIX is pushing past its small-scale .886 (white), with several targets (previous lows, the SMA200 and the yellow channel top) not far below that. A drop to the SMA200 should be worth a rise by SPX to at least its 2.24 at 2703, and potentially its SMA200 at 2741.
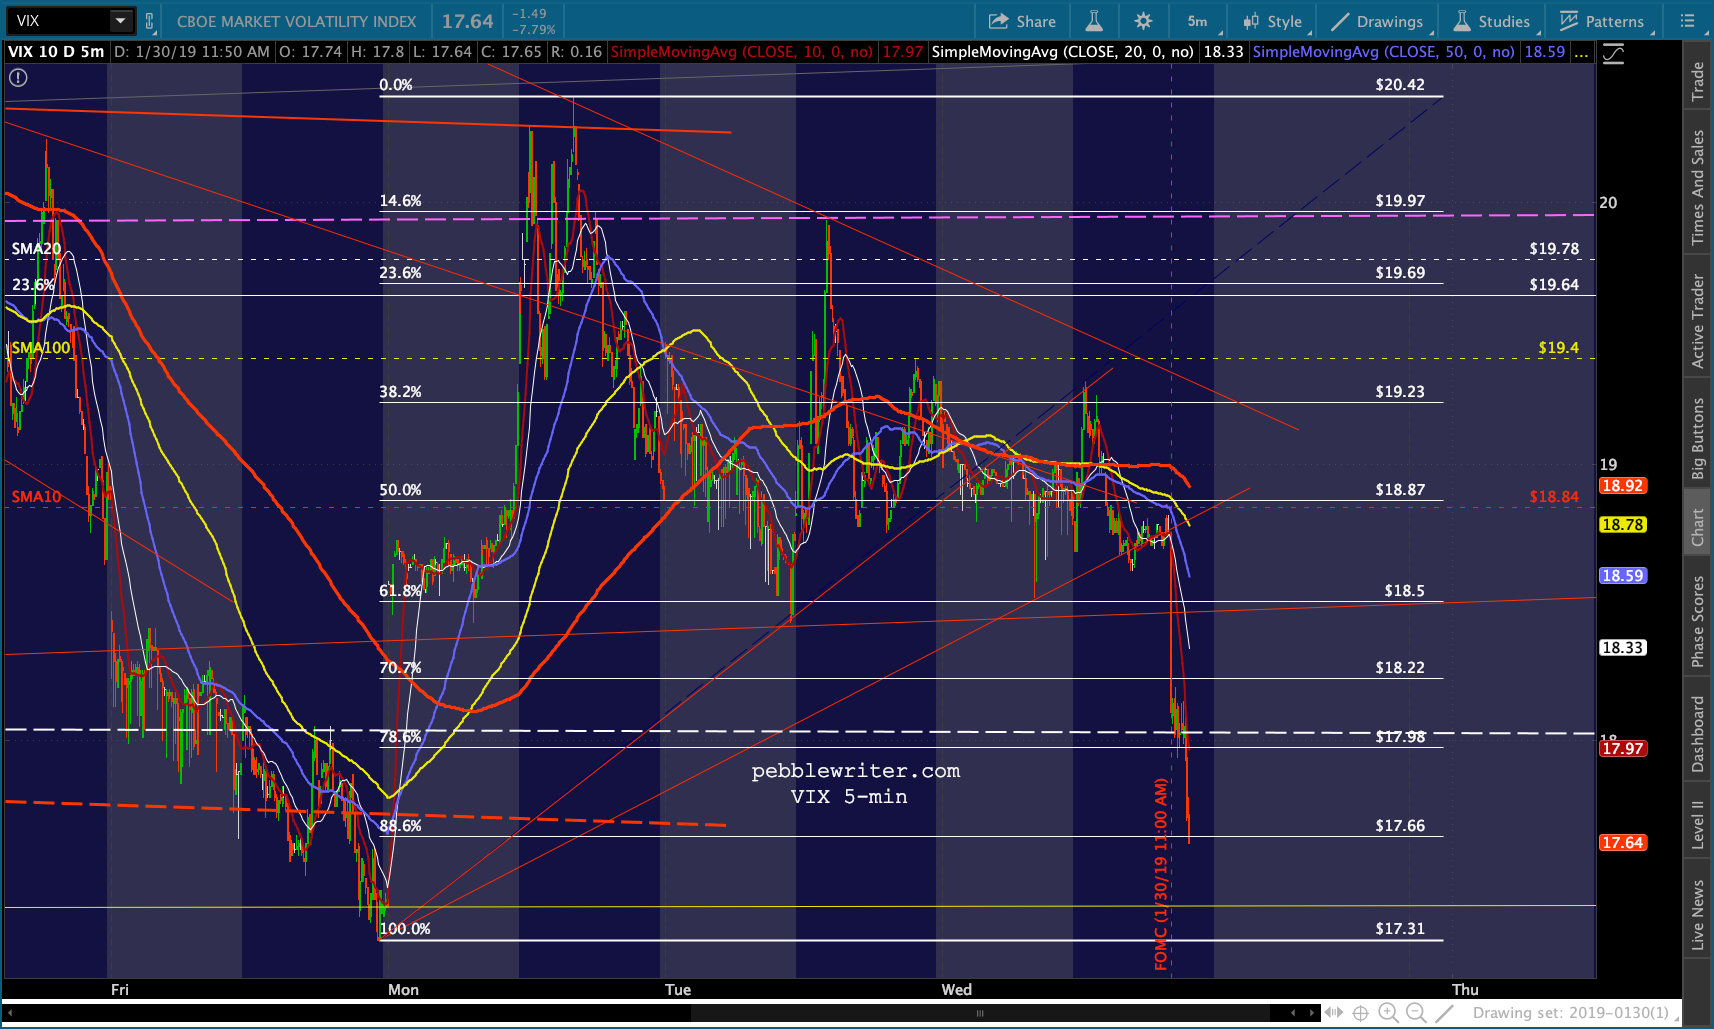
 Here’s a close-up of the lower targets.
 Since the FOMC gave the markets exactly what they wanted, the possibility of a sharp 1987-style crack in the SPX is obviously off the table.
The lower targets are still possible, but the timing would likely be in March.  Obviously, we’d need to see VIX keep tumbling rather than bouncing at this .886.
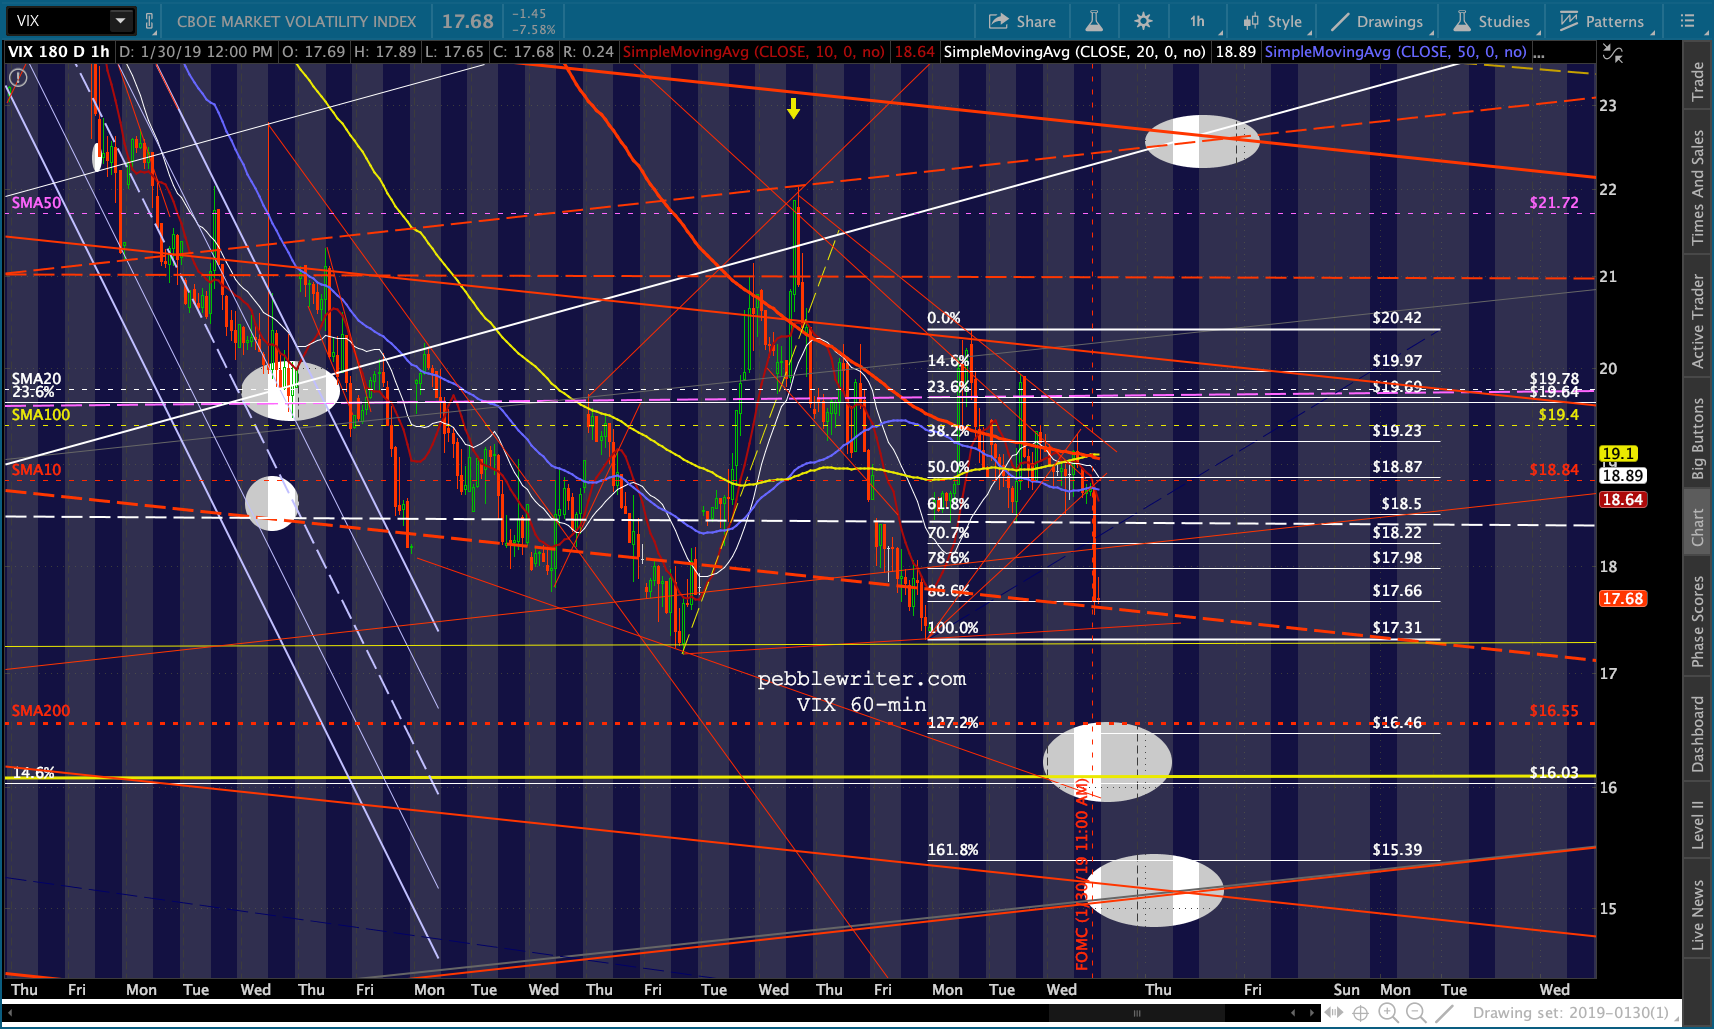 Note that GC has reached our next target — a gain of 11.1% since recovering from the yellow TL on Aug 20.