

Judging from CAT’s results, yes. Despite a $10 billion buyback plan and timely positive guidance, the stock has been beat up pretty badly this past year. The latest results add insult to injury. The S&P futures are currently off around 24 points in sympathy. But, at least half of that came before CAT’s results. So, there’s something else going on besides earnings.
 continued for members…
Note that AAPL is also having trouble this morning – reversing at its IH&S neckline rather than punching through in the lead up to its earnings.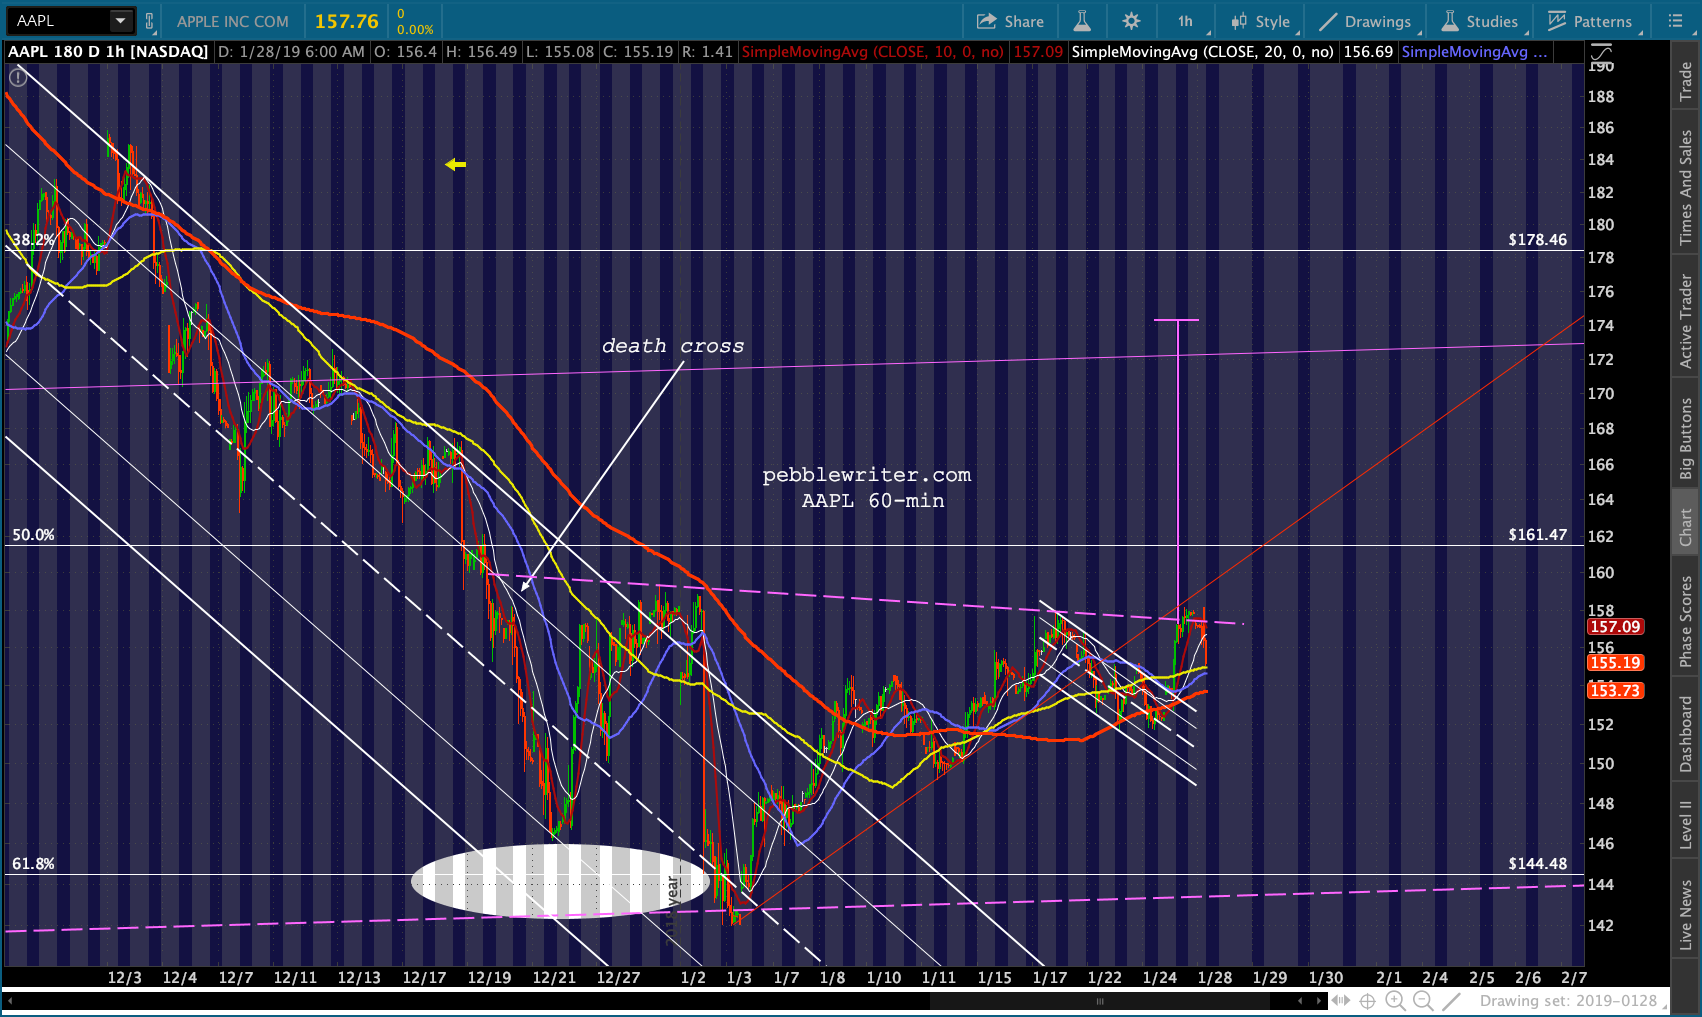 SPX and ES are overdue for a backtest and have plenty of room to drop before testing their necklines again. ES is at 2623ish.
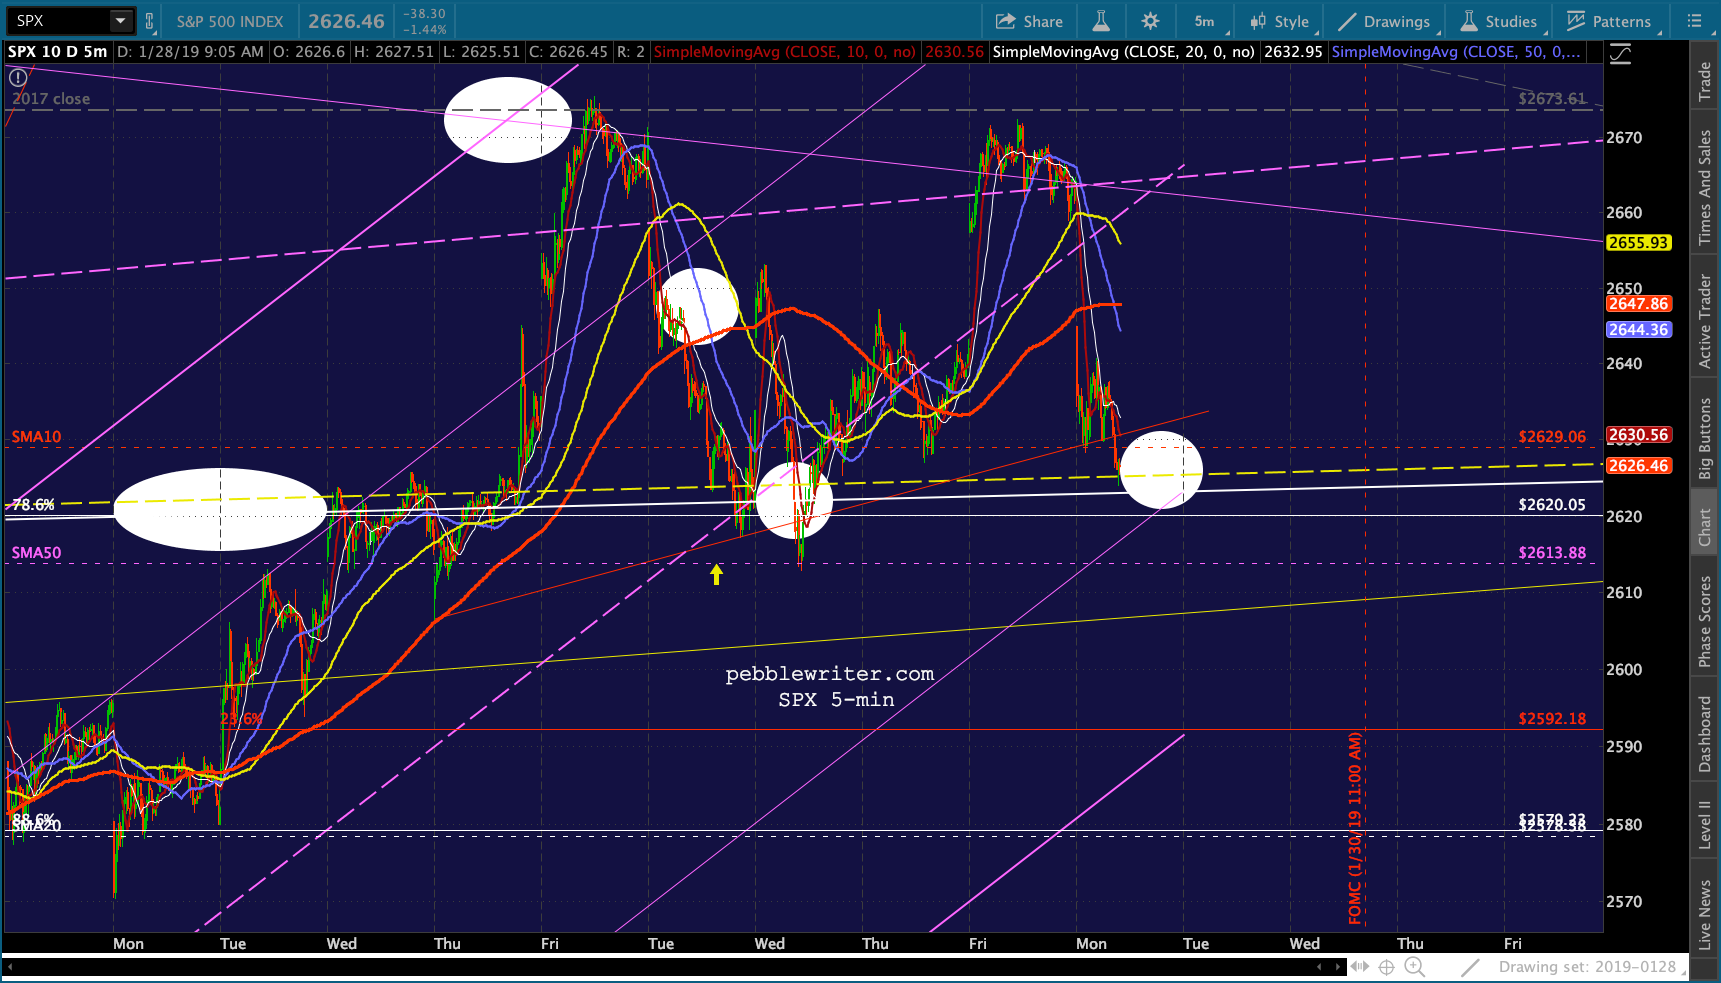
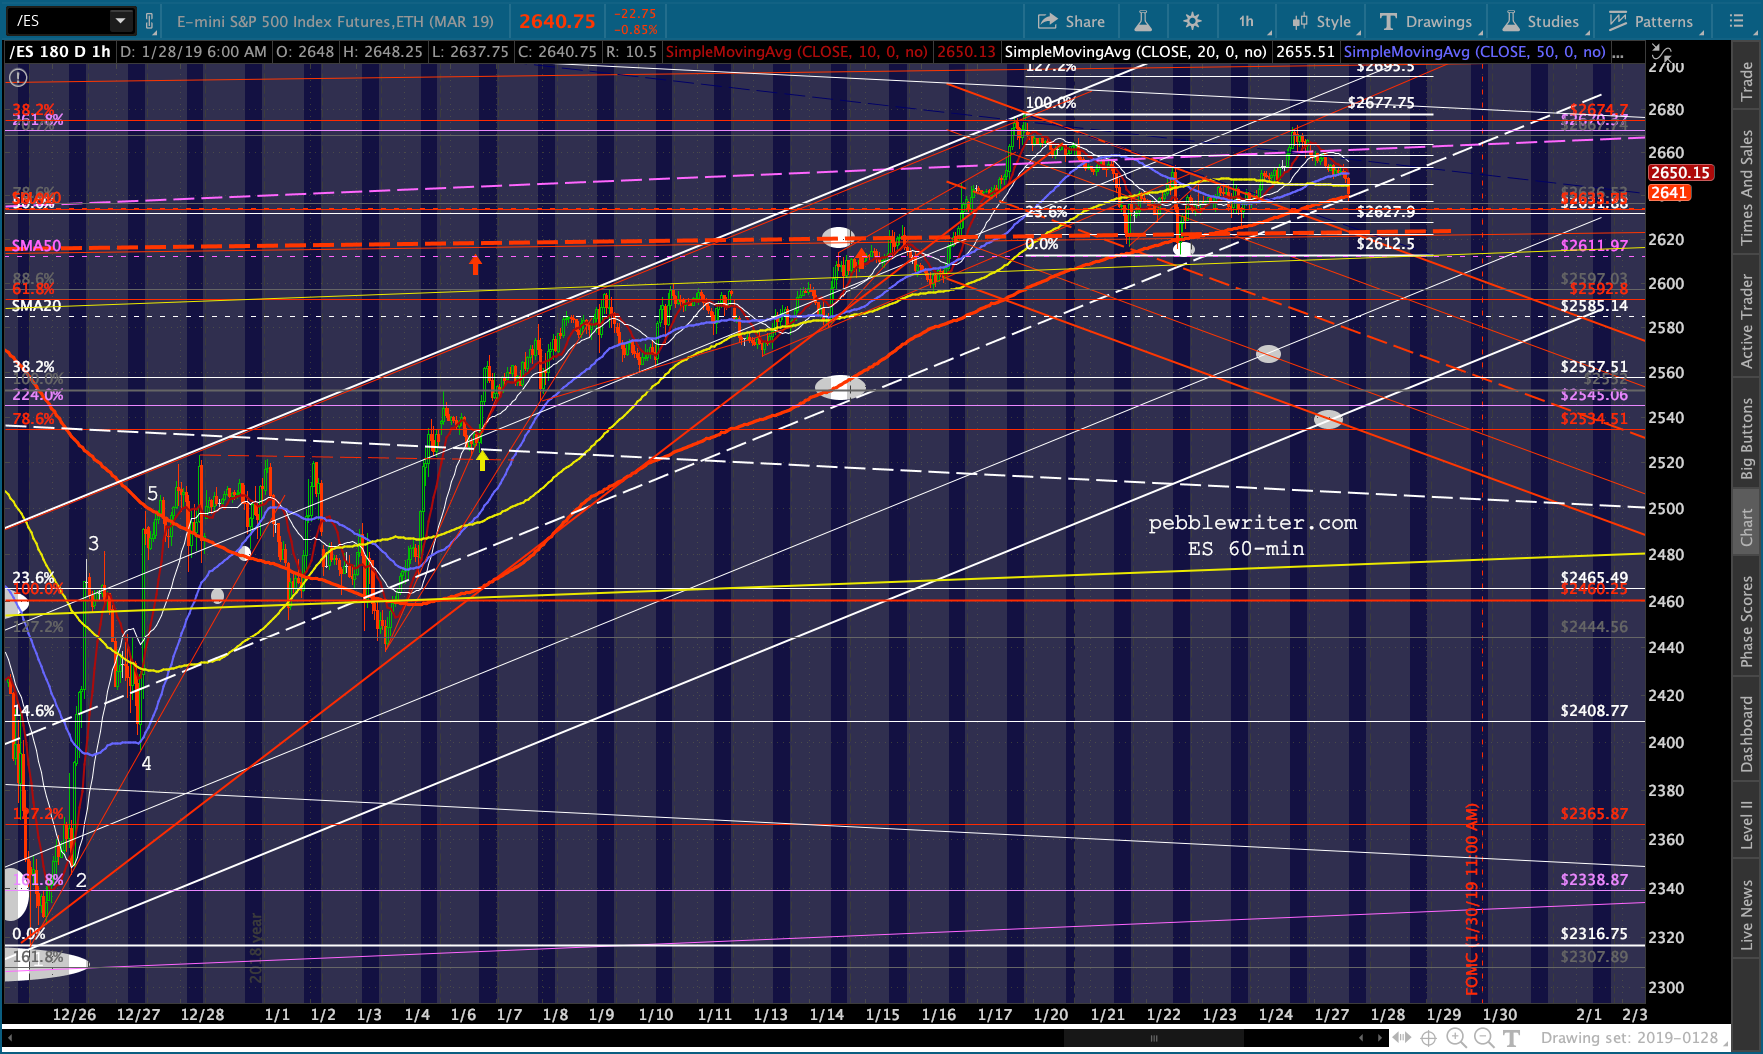 SPX is down around 2625, just below its SMA10 at 2629.06.
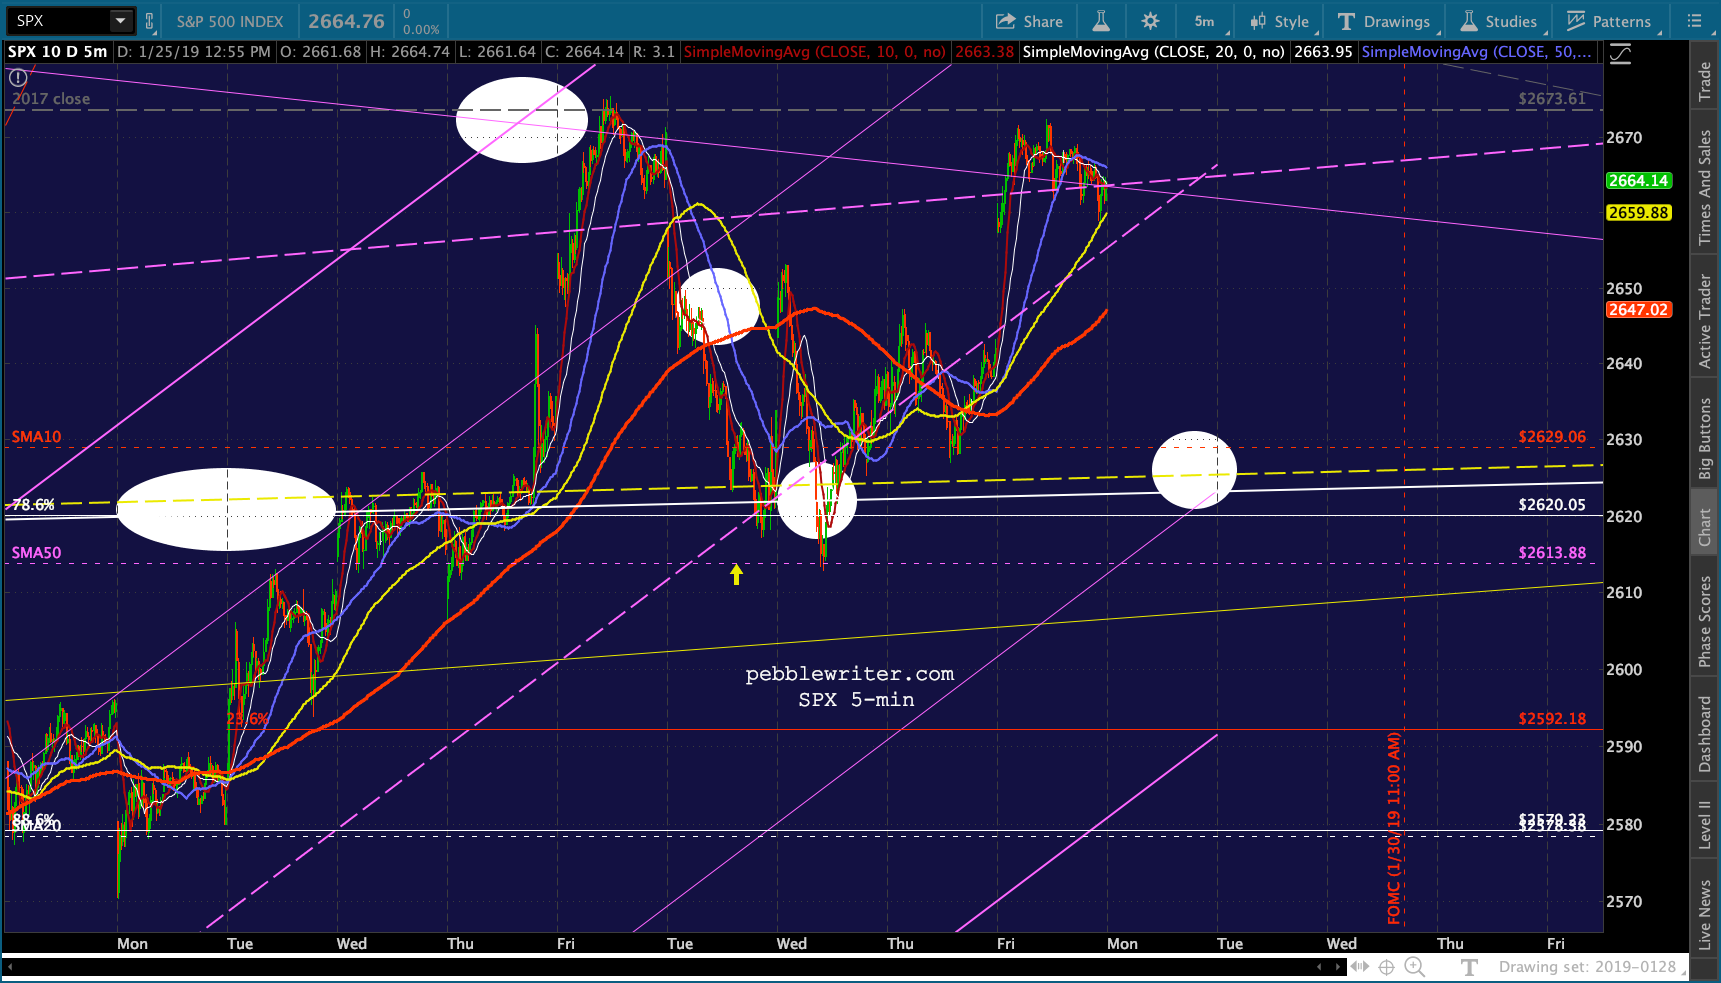
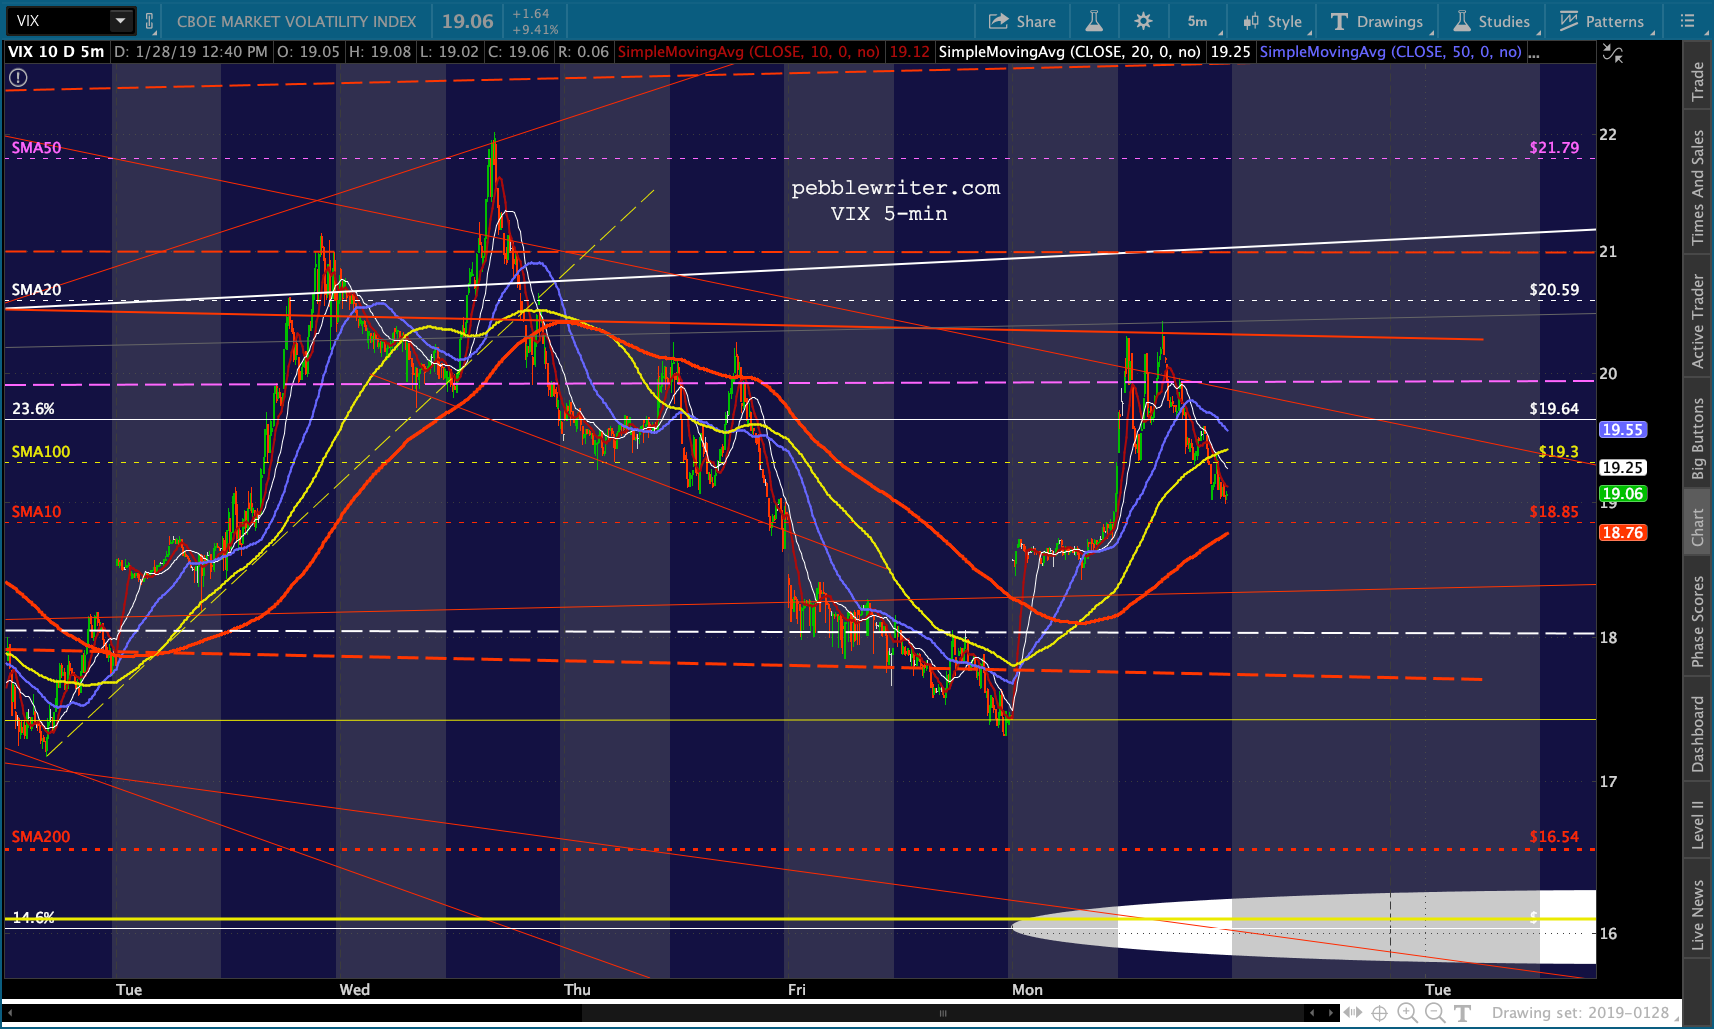
 We’ll watch to see if VIX backtests again as the necklines are reached. This happened on the 22nd and 23rd. A backtest today would be around the SMA50 at 21.79.
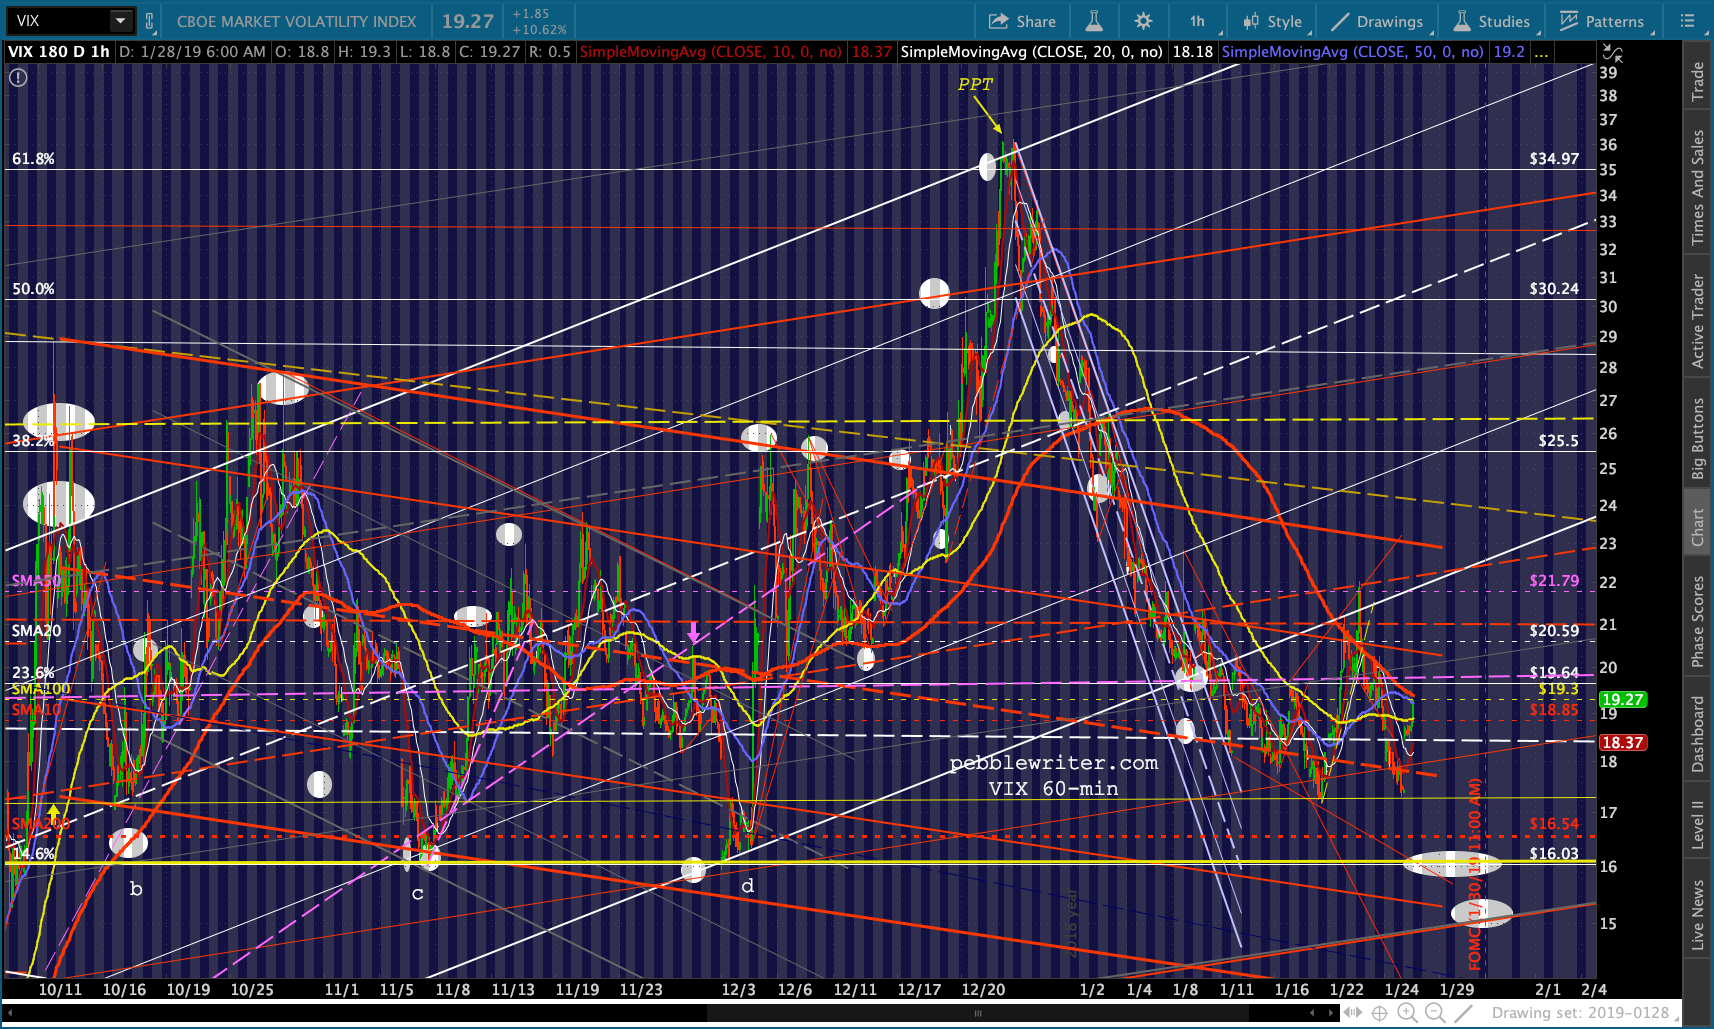 As we discussed last week, our yield curve model has turned bearish with the break down through the yellow TL and the white TL coming up.
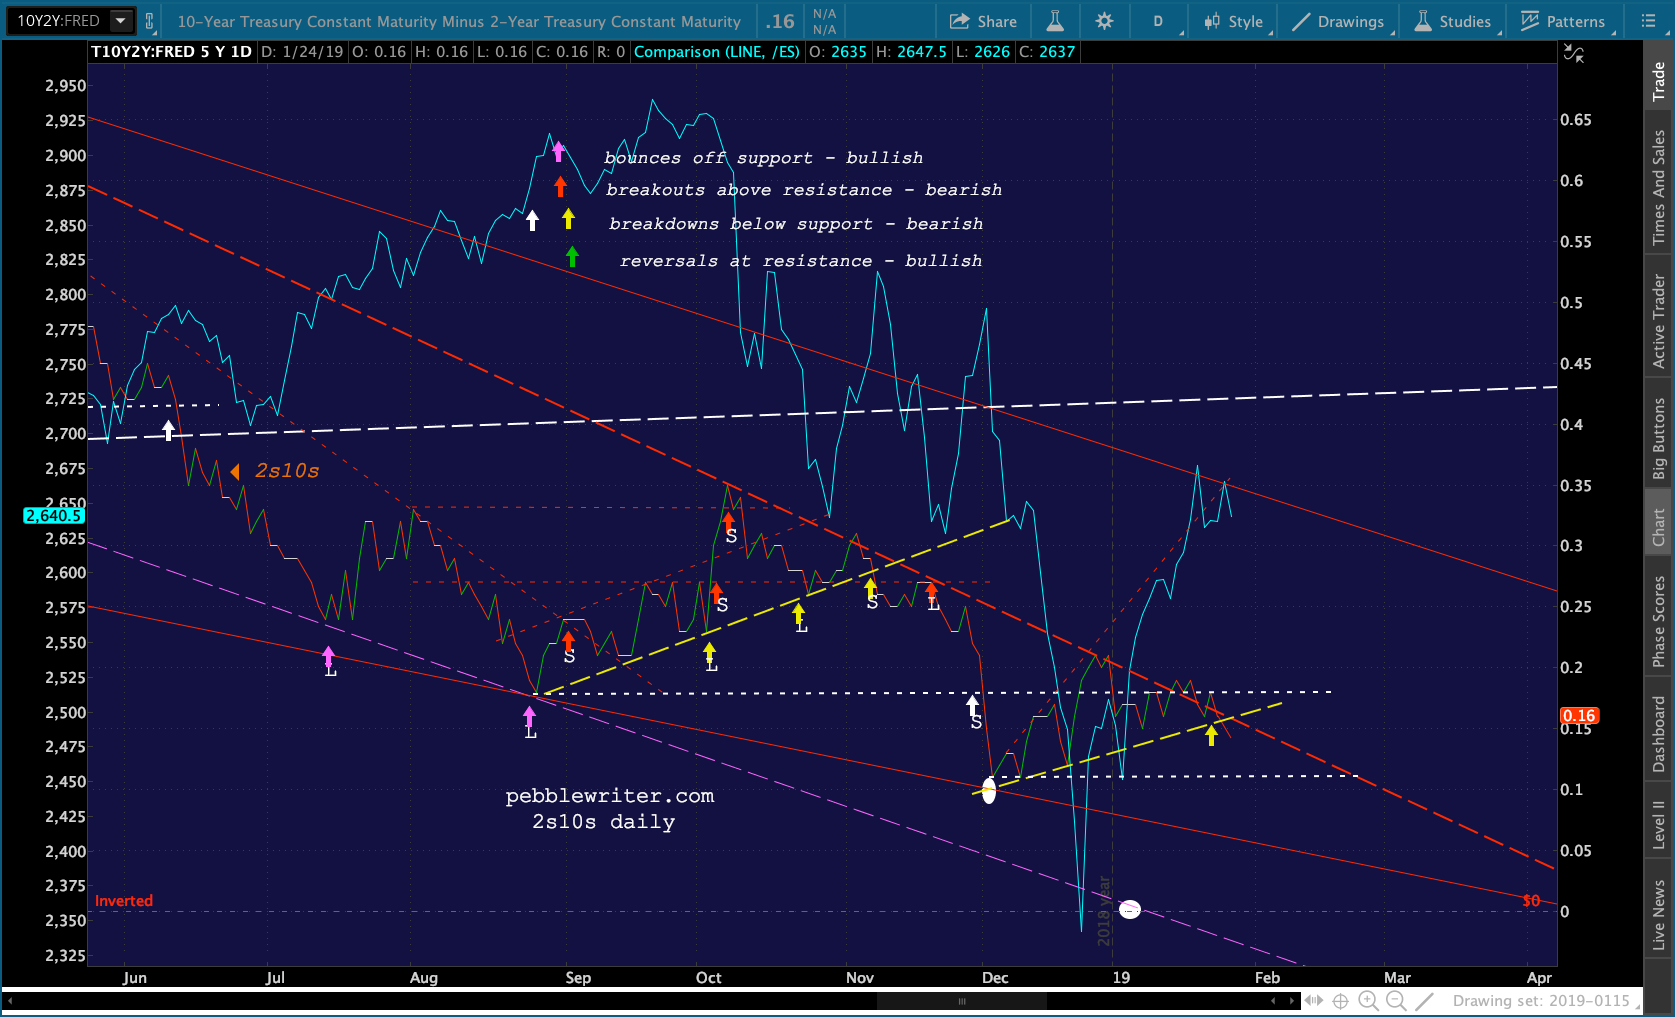 Most of this is due to the expectation that the Fed will stand pat on rates Wednesday. The dollar continues its creep toward the channel bottom…
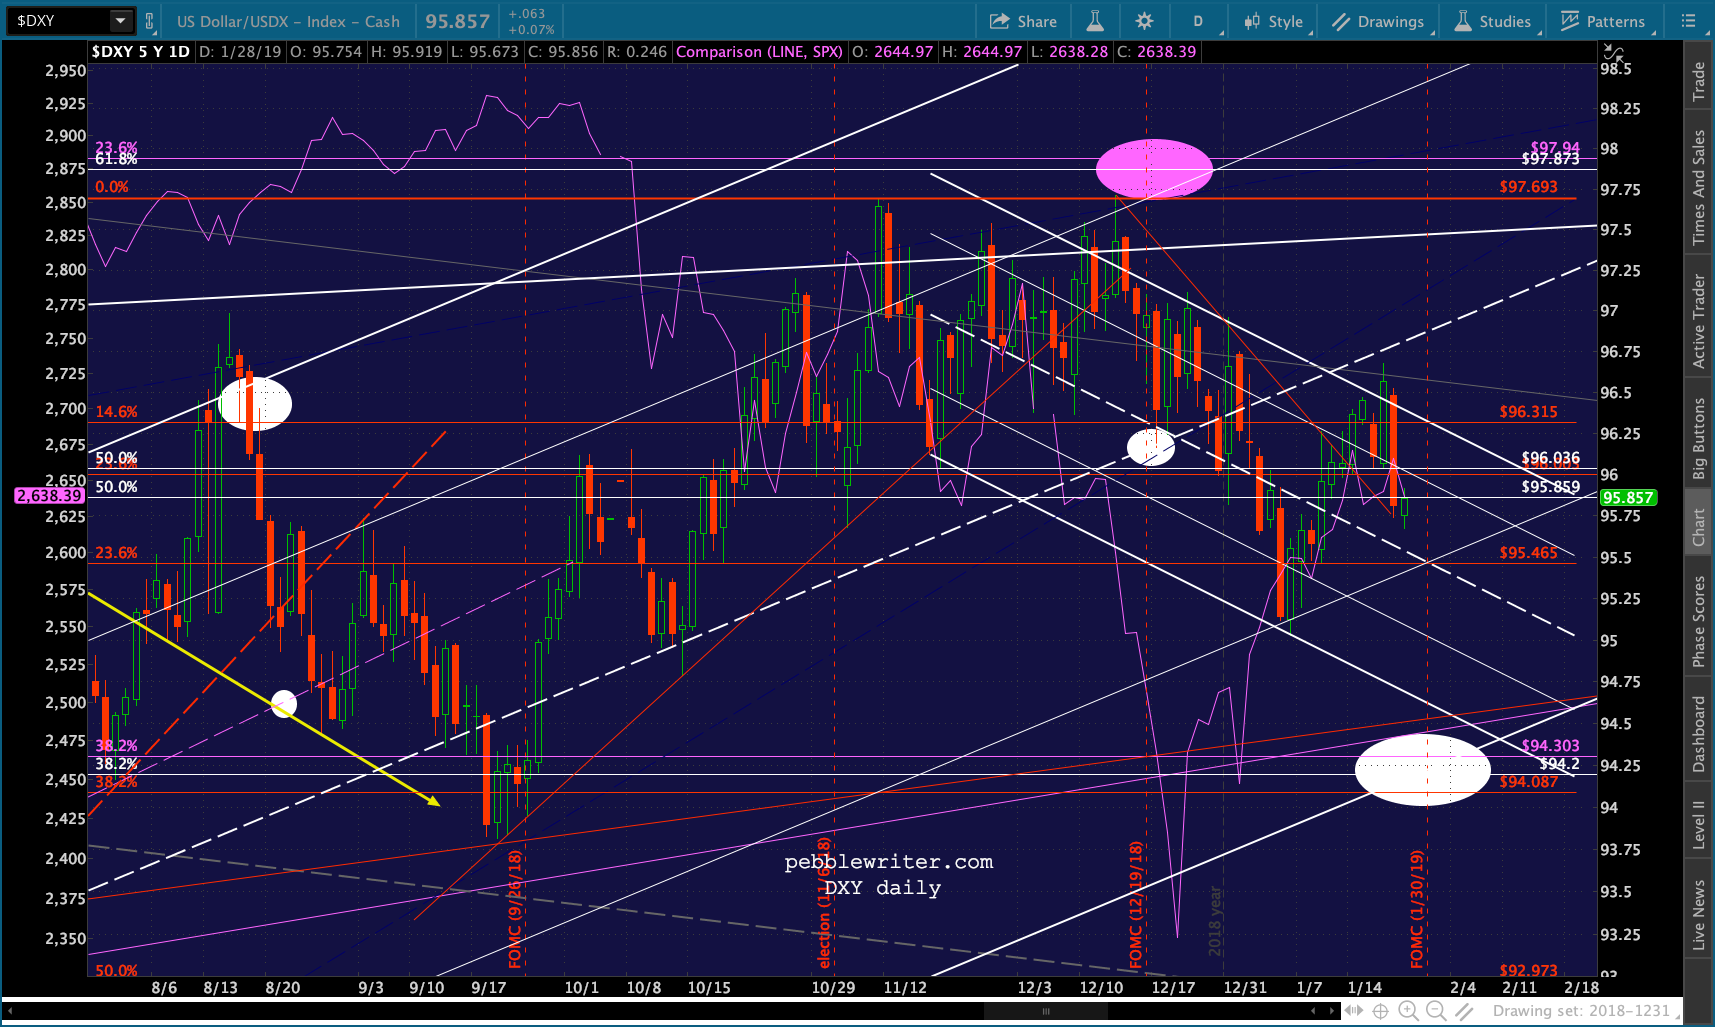 …and is losing ground to the euro as the SMA200 finally draws near.
  The USDJPY’s breakdown is also telling.
 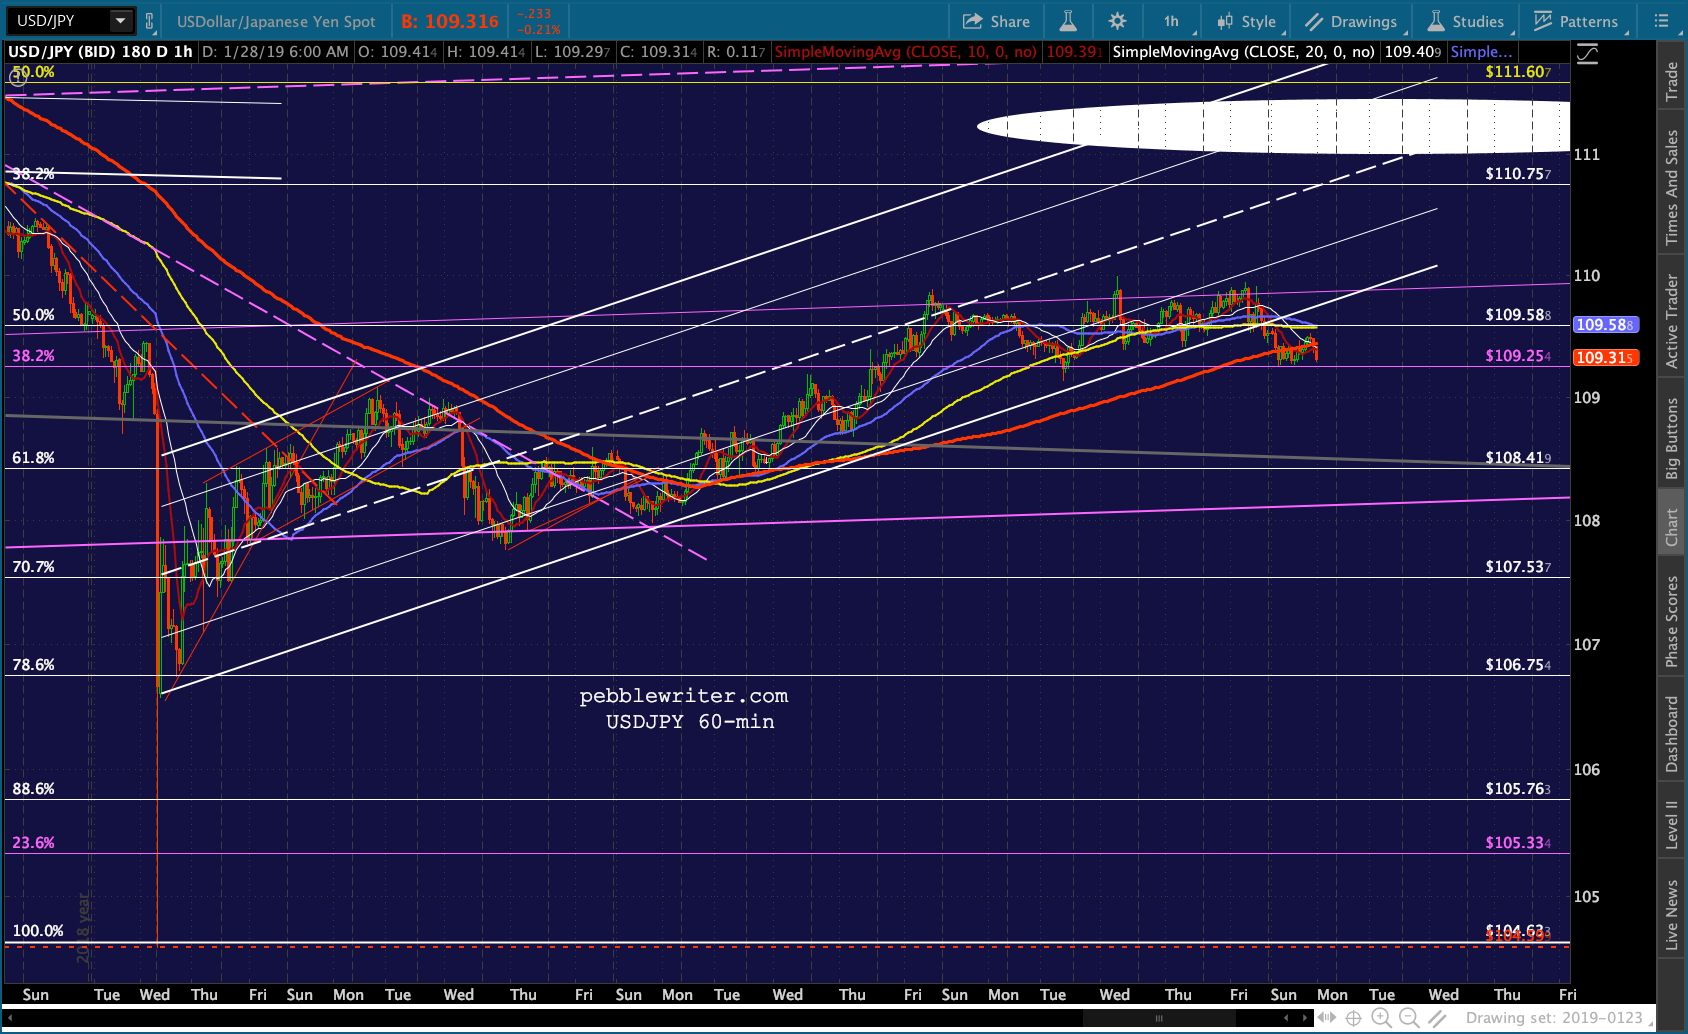 And, with the FOMC meeting, don’t expect a rescue from CL or RB. Their job is to convince the Fed that no rate increase is needed at this time, or any time soon for that matter.
While CL is seeing moderate declines and testing SMA support…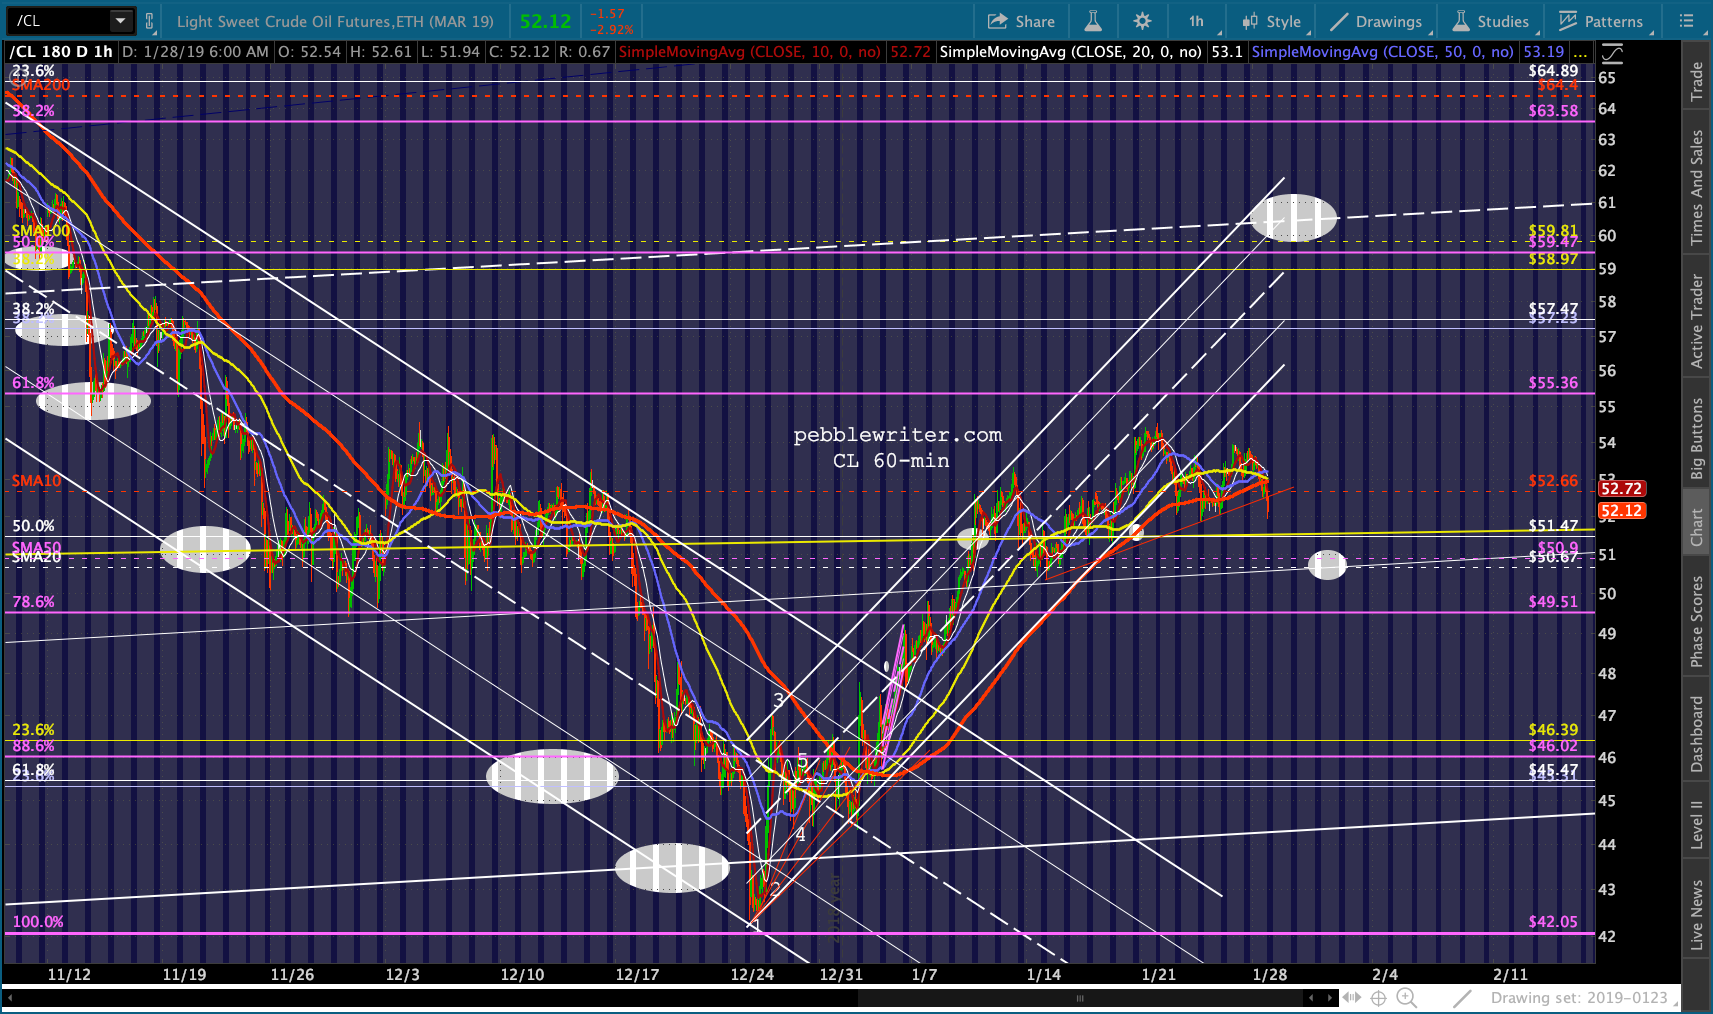 …RB is in danger of seeing a little H&S play out which would mean pretty big declines. The white channel which broke down on Jan 22 might yield to the purple — a pretty nice fit — which would support the idea of the .618 as the downside target. There is simply no need for lower, but the decline could get carried away.
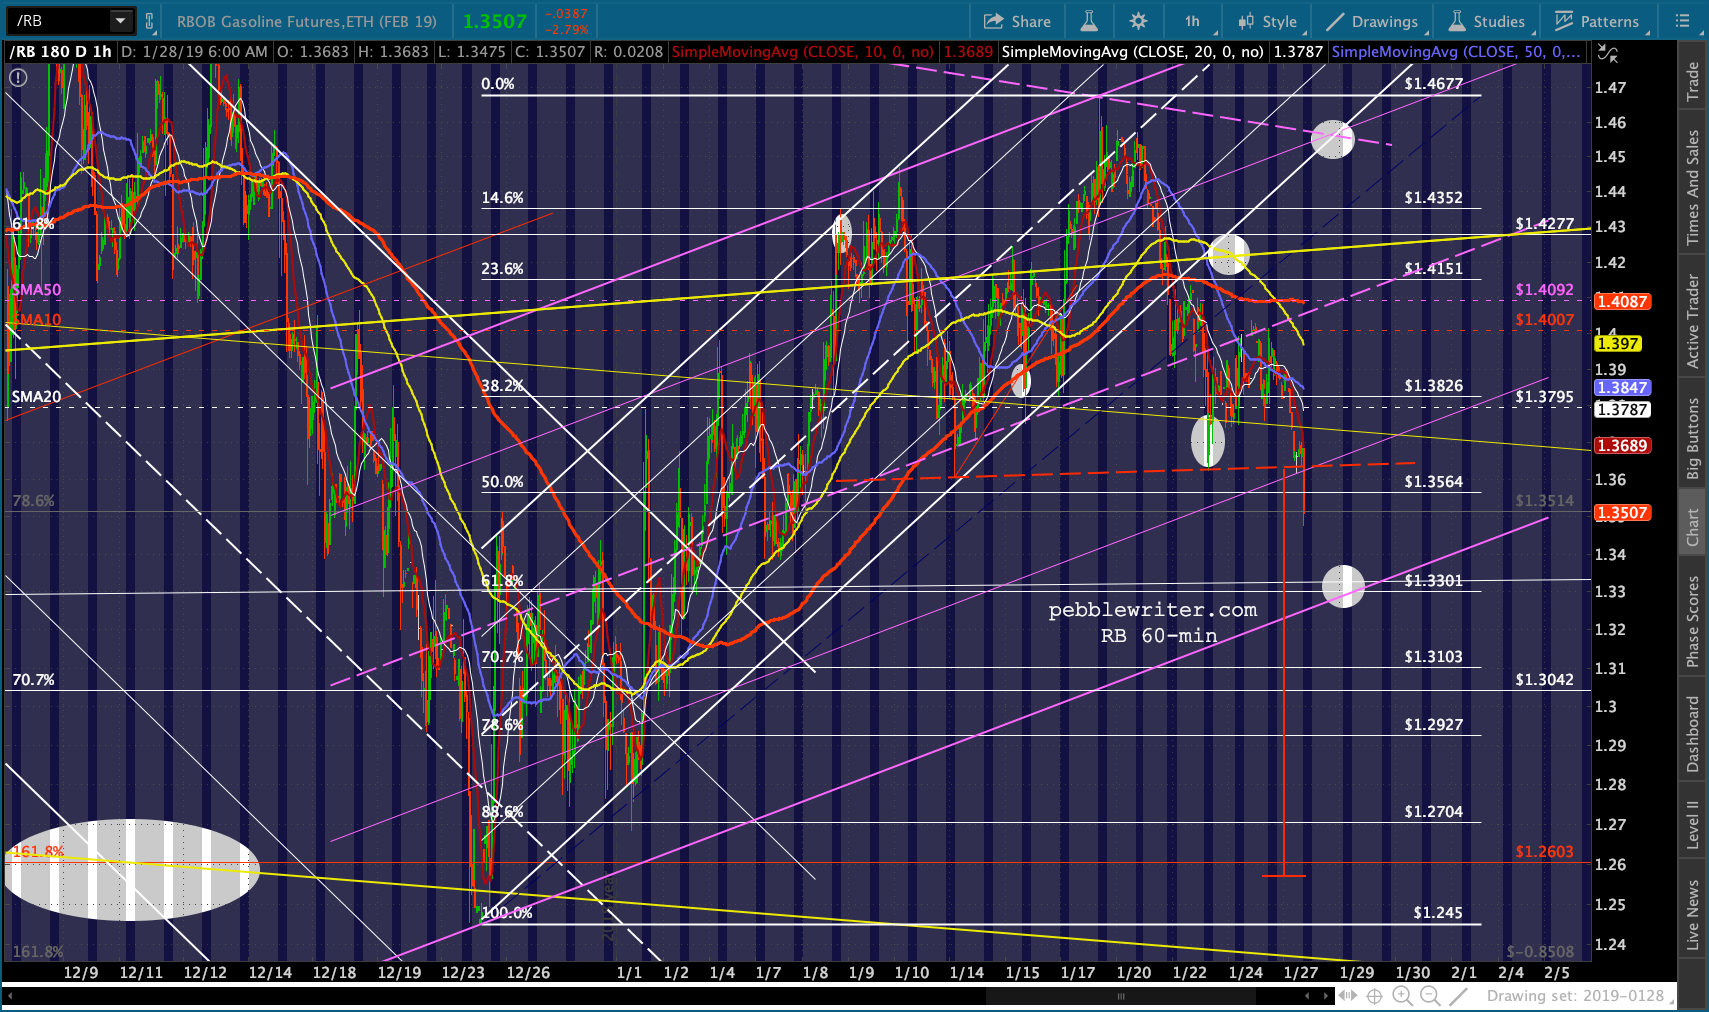 UPDATE: 12:08 PM
There’s the ES and SPX backtests.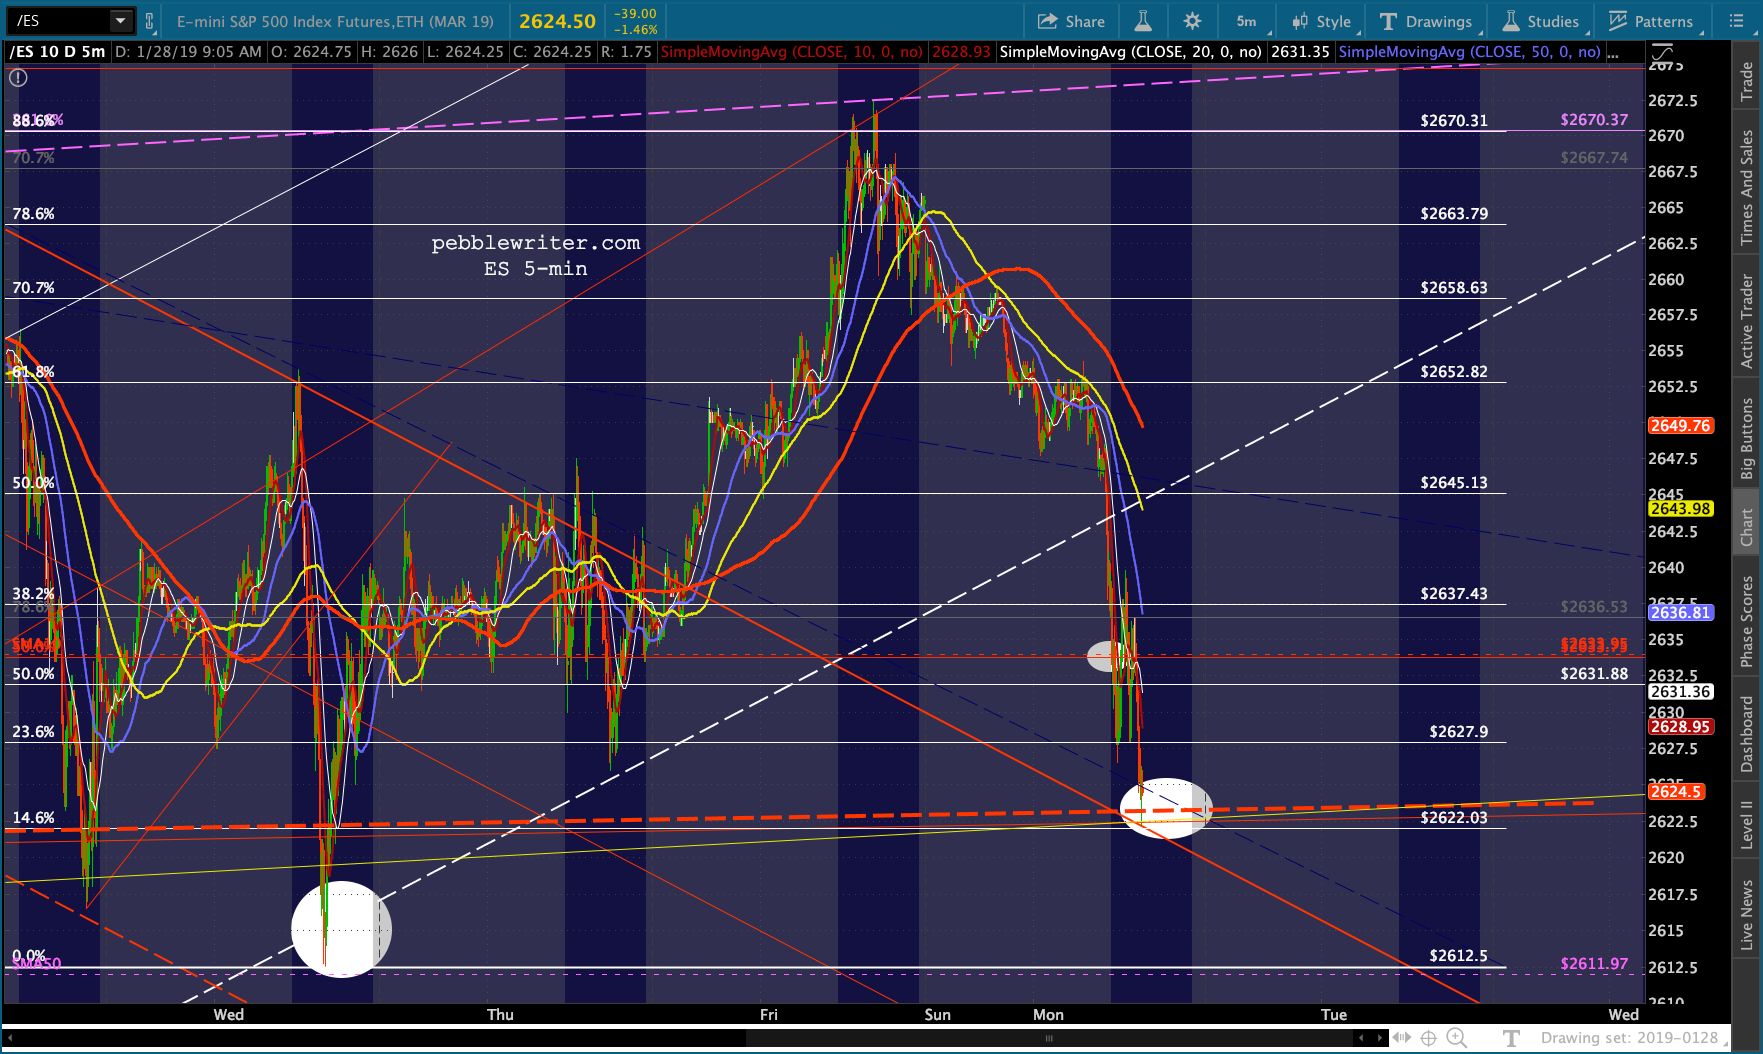
 VIX hasn’t done much other than reverse at a fan line from the Dec 24 highs.
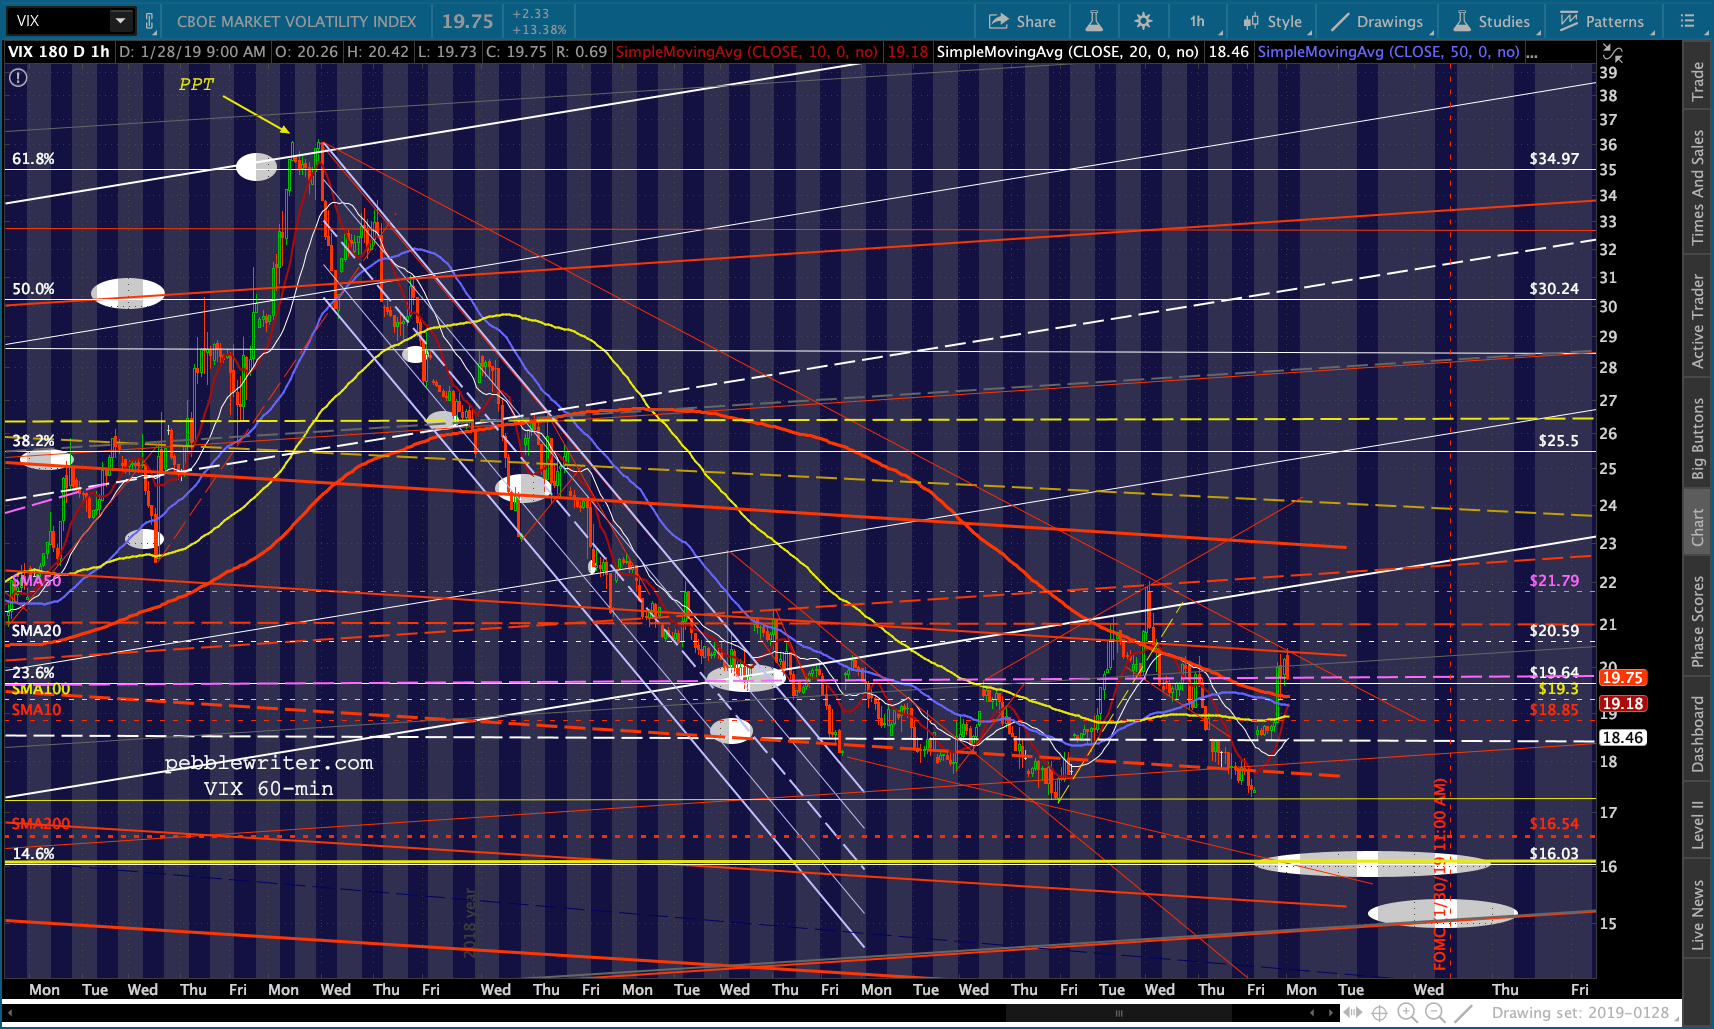 CL has reached the yellow channel line that factored in the November-December lows (prior to the breakdown on Dec 17.) There’s obviously better support at the SMA20/50 at 50.67-50.90 — but we could get that after the close if they’re determined to hold the ES/SPX necklines — which I suspect they are.
  RB likewise hasn’t quite reached its support – the .618 and purple channel bottom.
 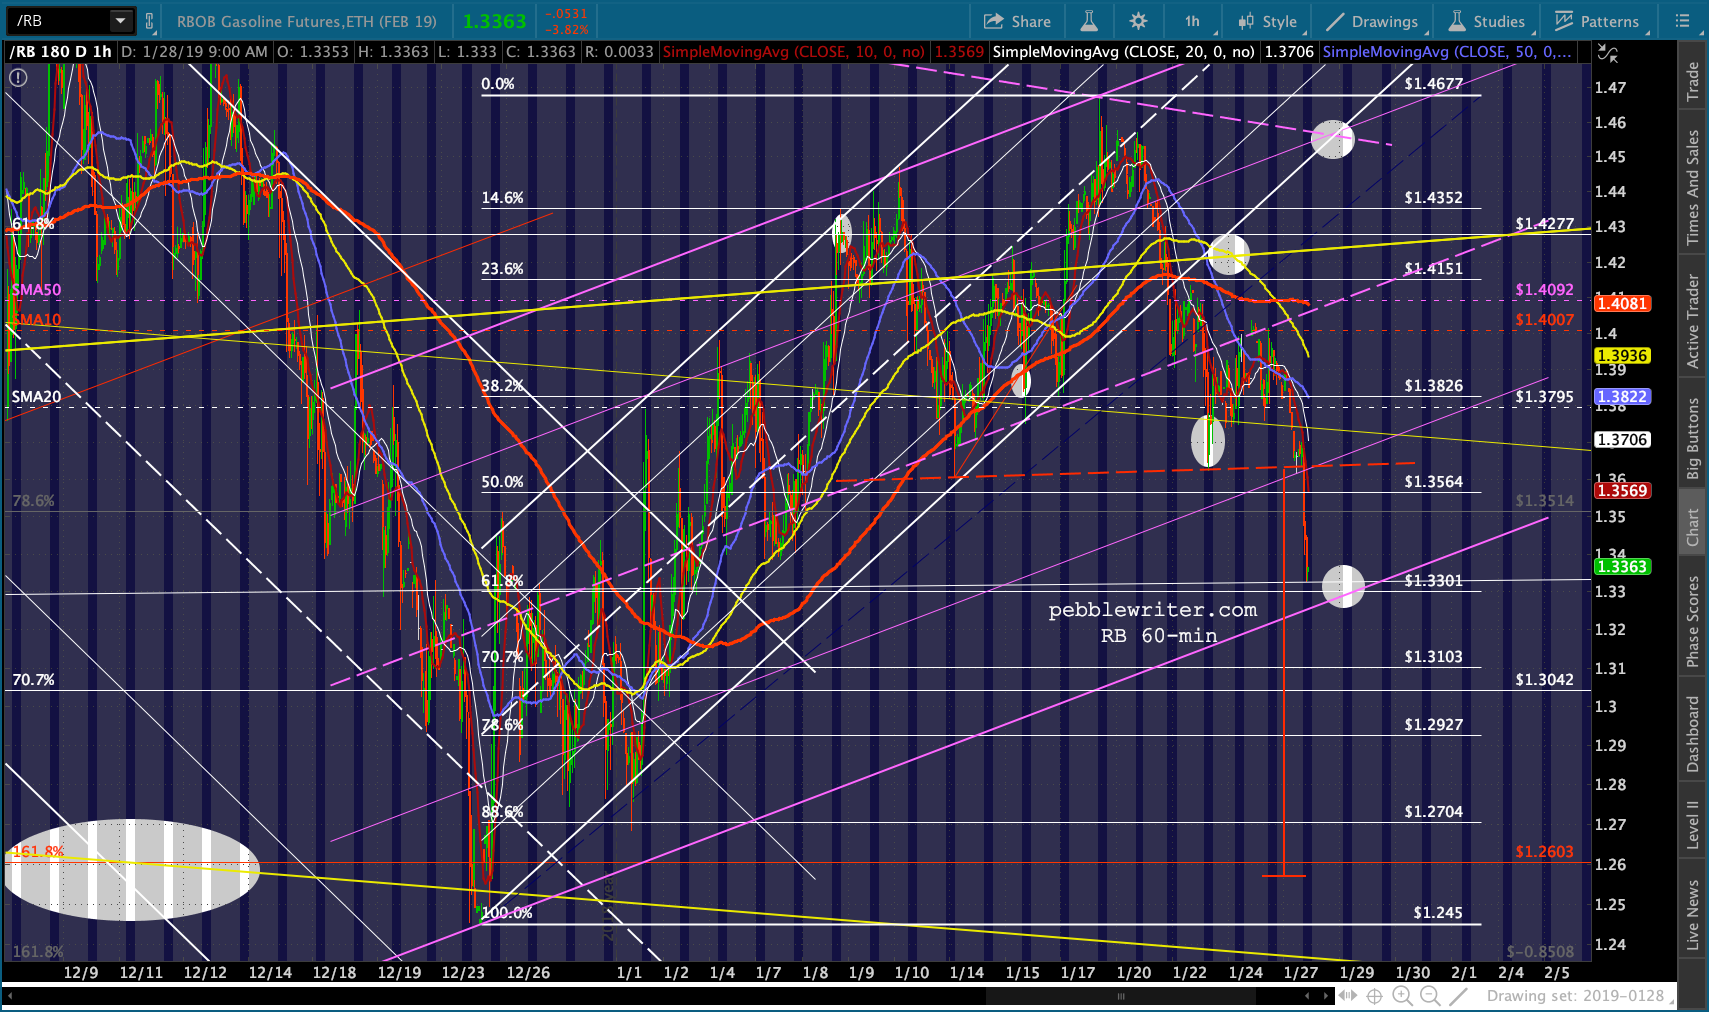 UPDATE: 1:00 PM
I didn’t really point it out at the time, but SPX recently completed a H&S Pattern that didn’t get a chance to play out (at least, yet.) As soon as the pattern completed and SPX dipped below its purple neckline, the algos took over.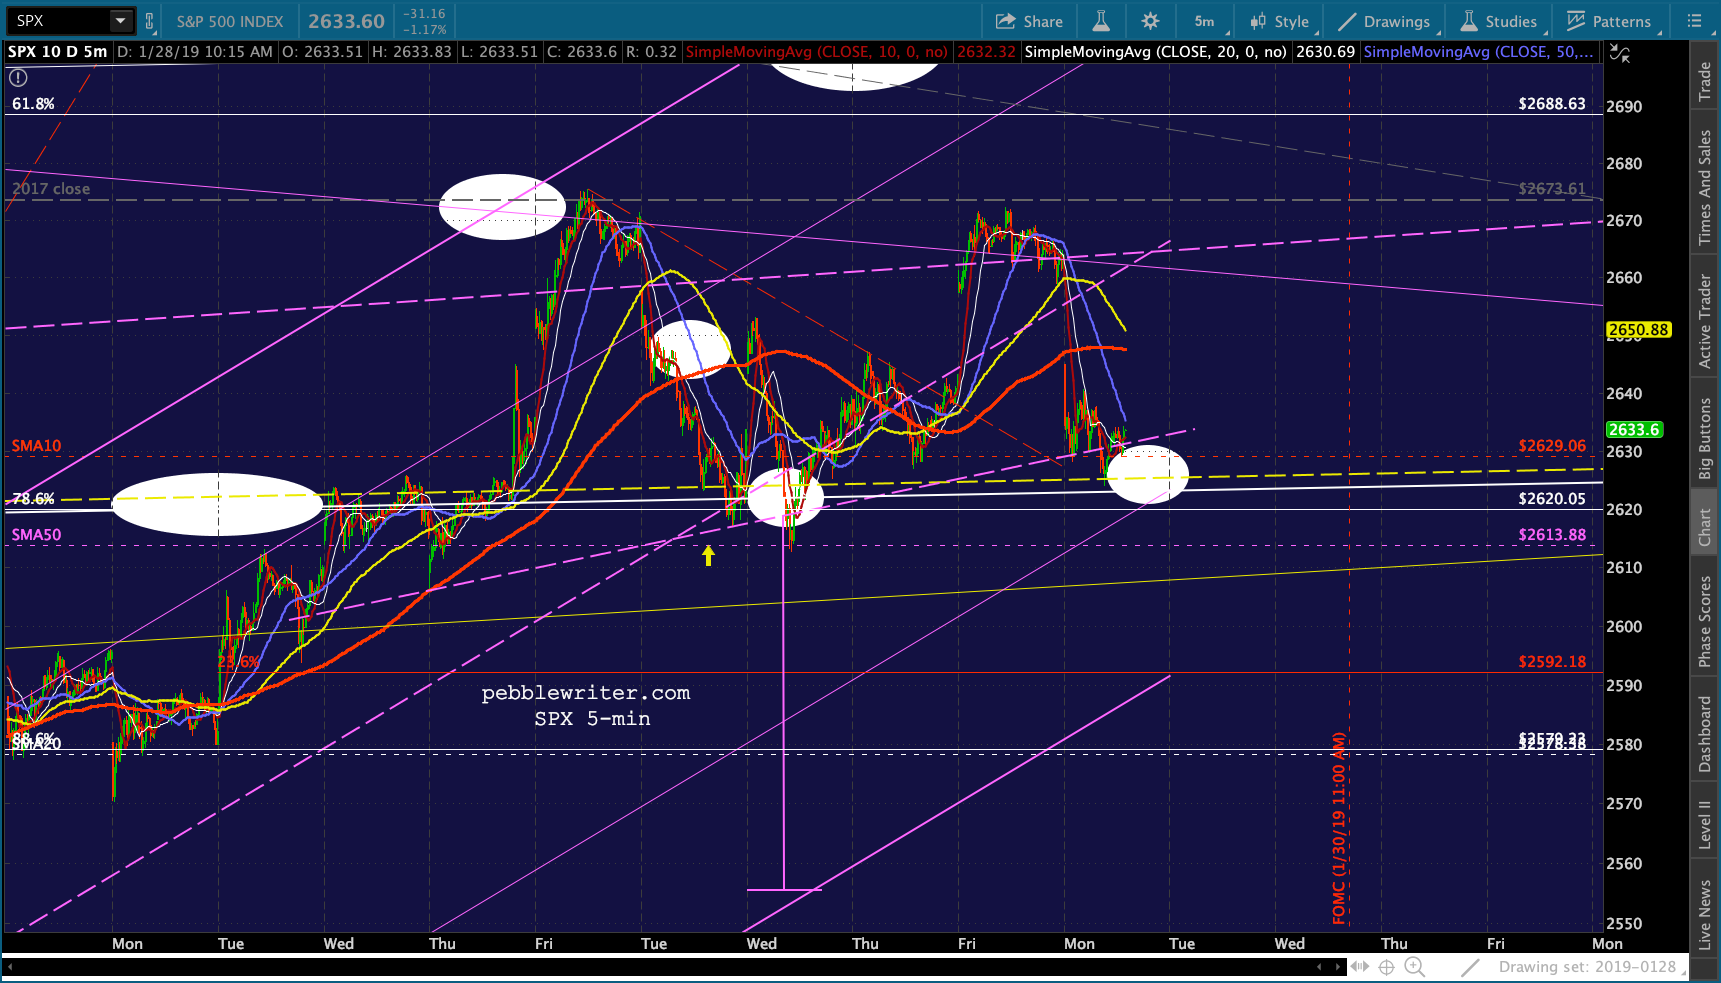 The method was VIX’s abrupt reversal (yellow arrow), which was bogus from a charting standpoint. VIX had already backtested the broken white channel, SMA20 and SMA50 on the 22nd.
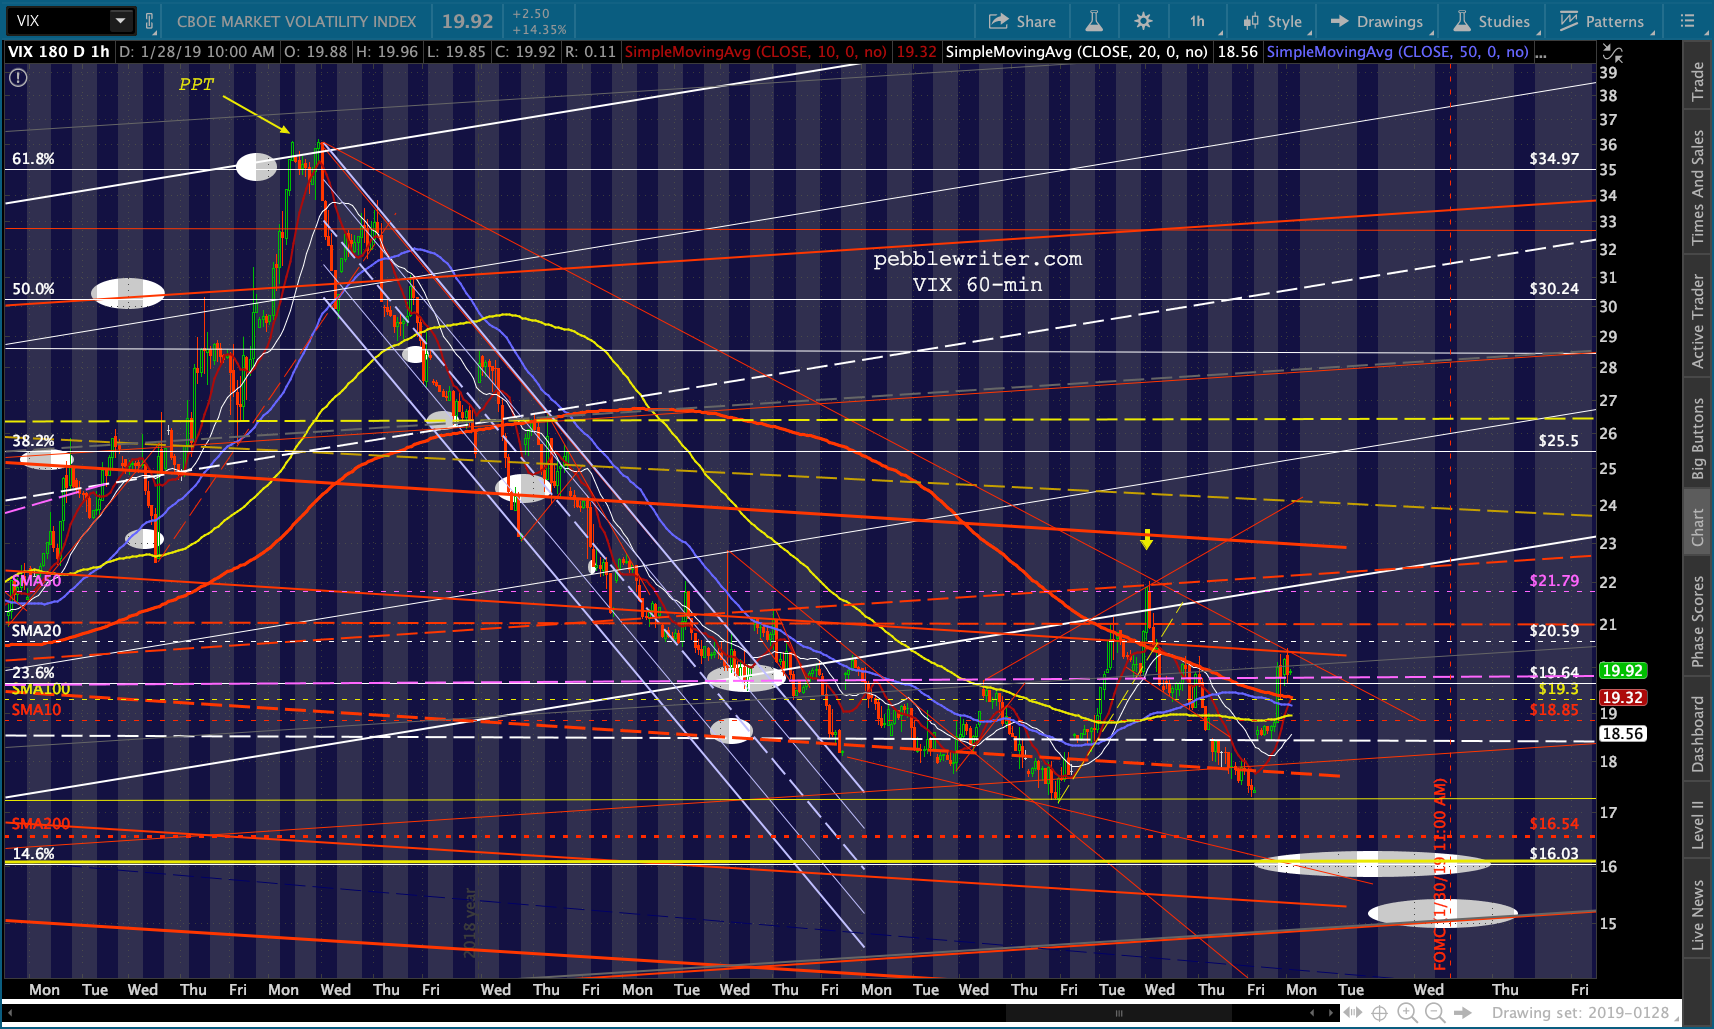 The high on the 23rd was a breakout and should have resulted in ES/SPX following their channels lower. But, instead, VIX was hammered and we saw ES and SPX gap higher the following day.
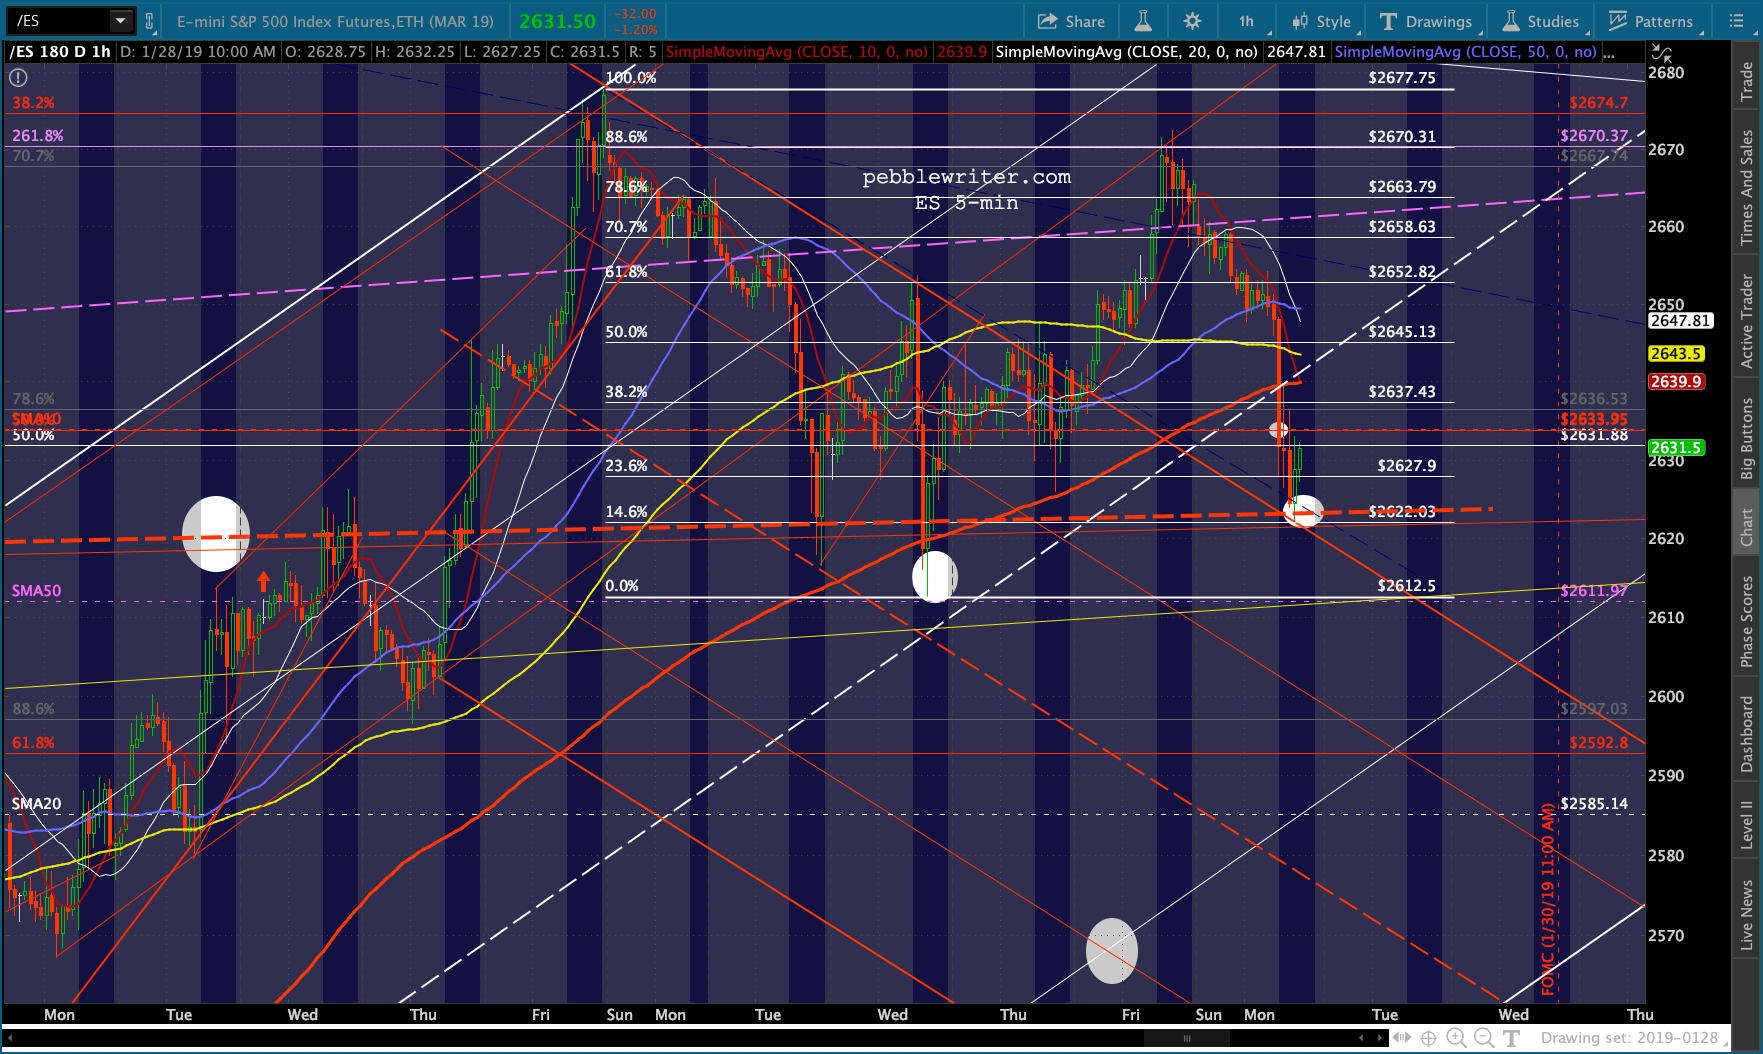
Nothing really earth shattering here, just pointing out the latest instance of market manipulation… There’s obviously a very determined effort to hold ES/SPX above the necklines.
UPDATE: 2:19 PM
This is a much better reversal point for RB. If it bounces here, initial target is the neckline at 2.3645ish followed by 1.38, 1.41 and 1.4277. If it drops through, stay short for 1.255-1.27.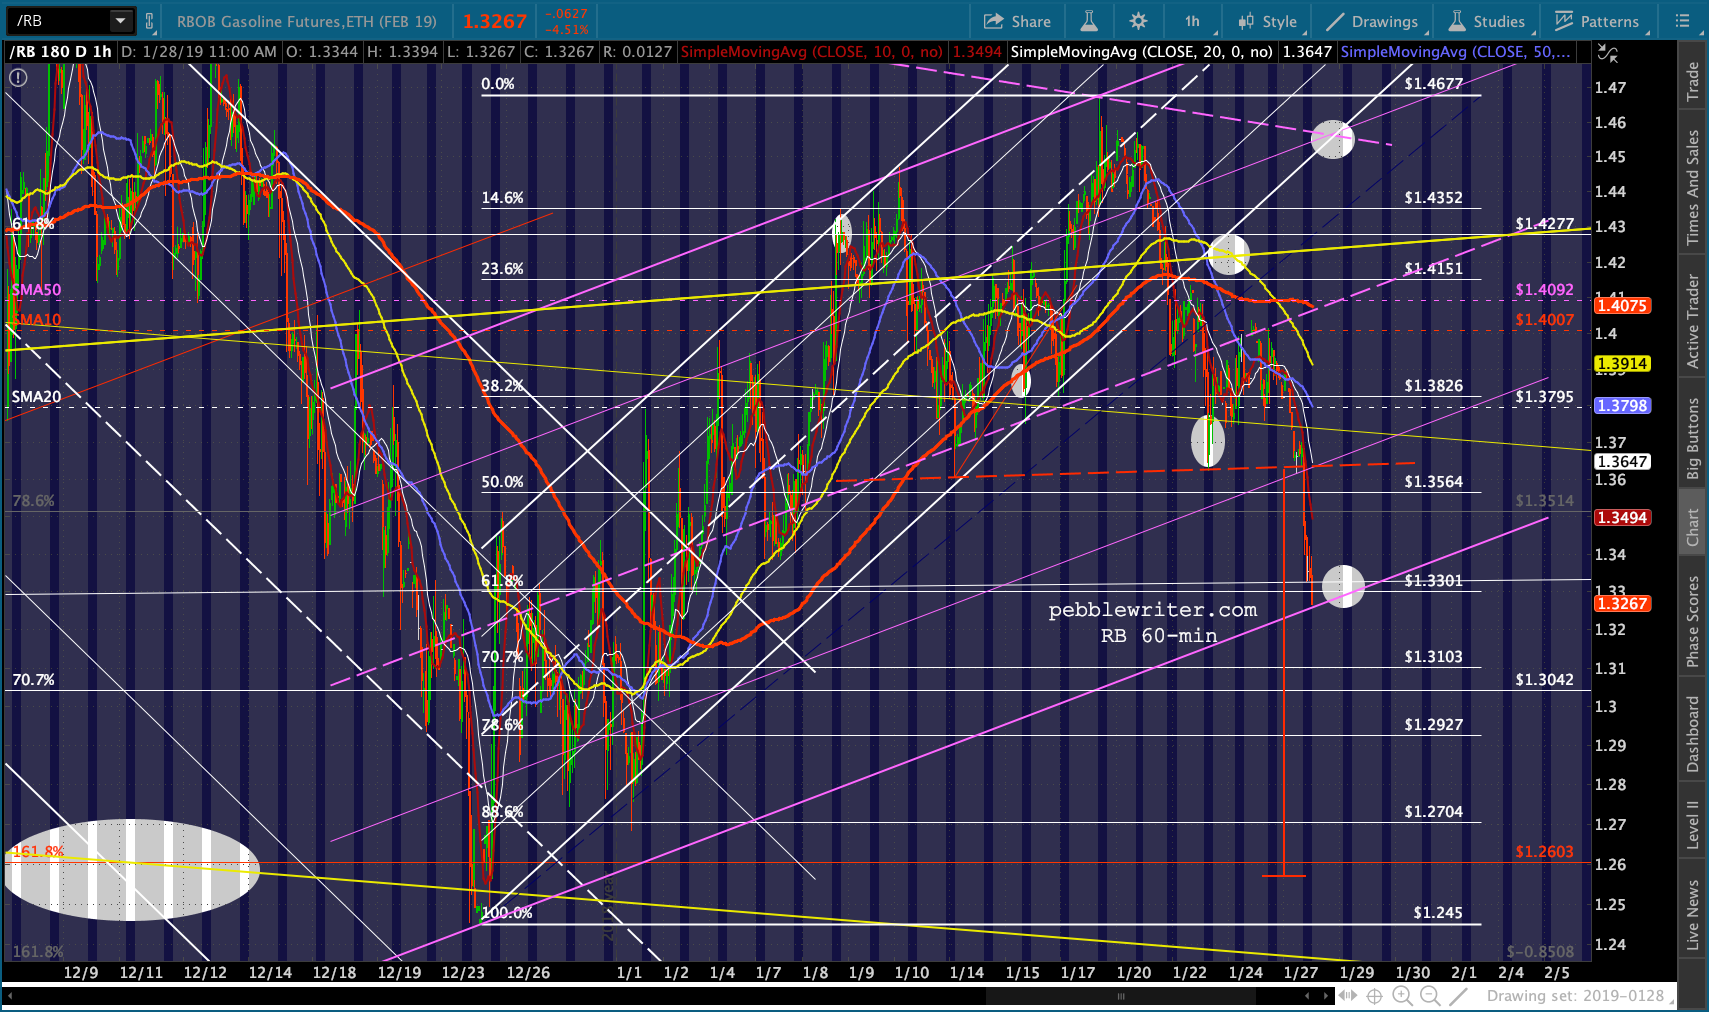 UPDATE: 2:44 PM
RB, updated with upside and downside targets…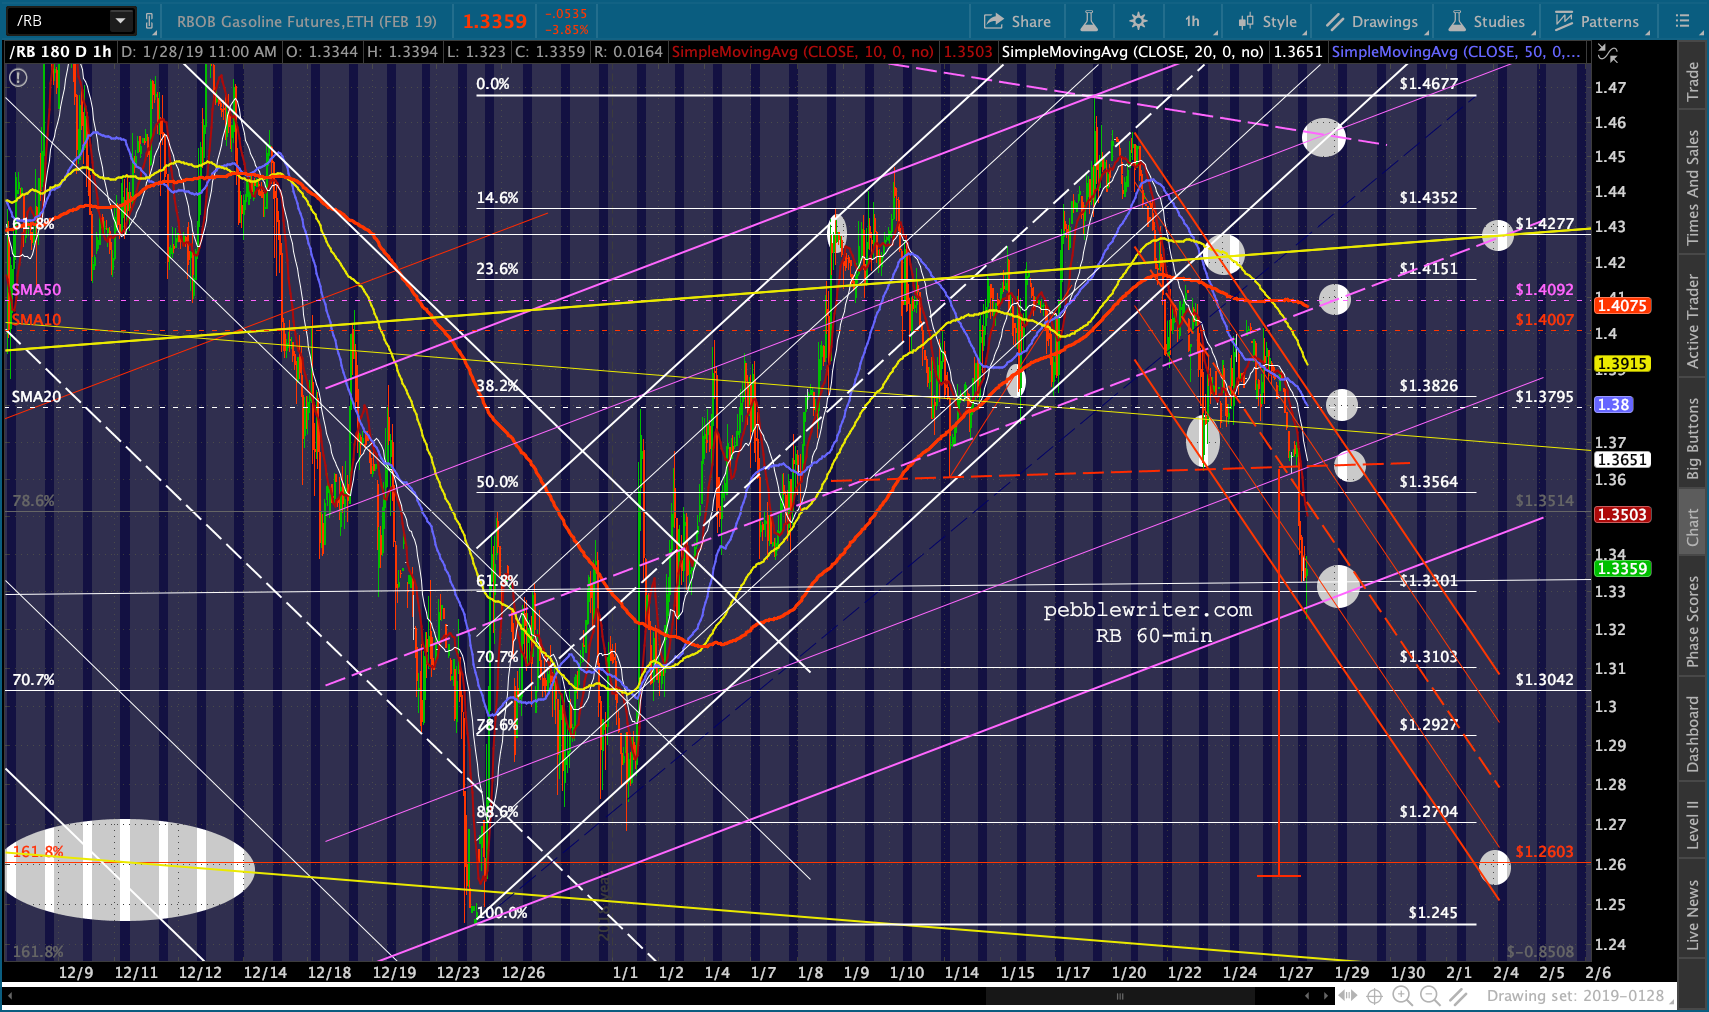 As an aside, USDJPY can close above its SMA10 today even though it appears to be breaking down on the 60-min charts.
 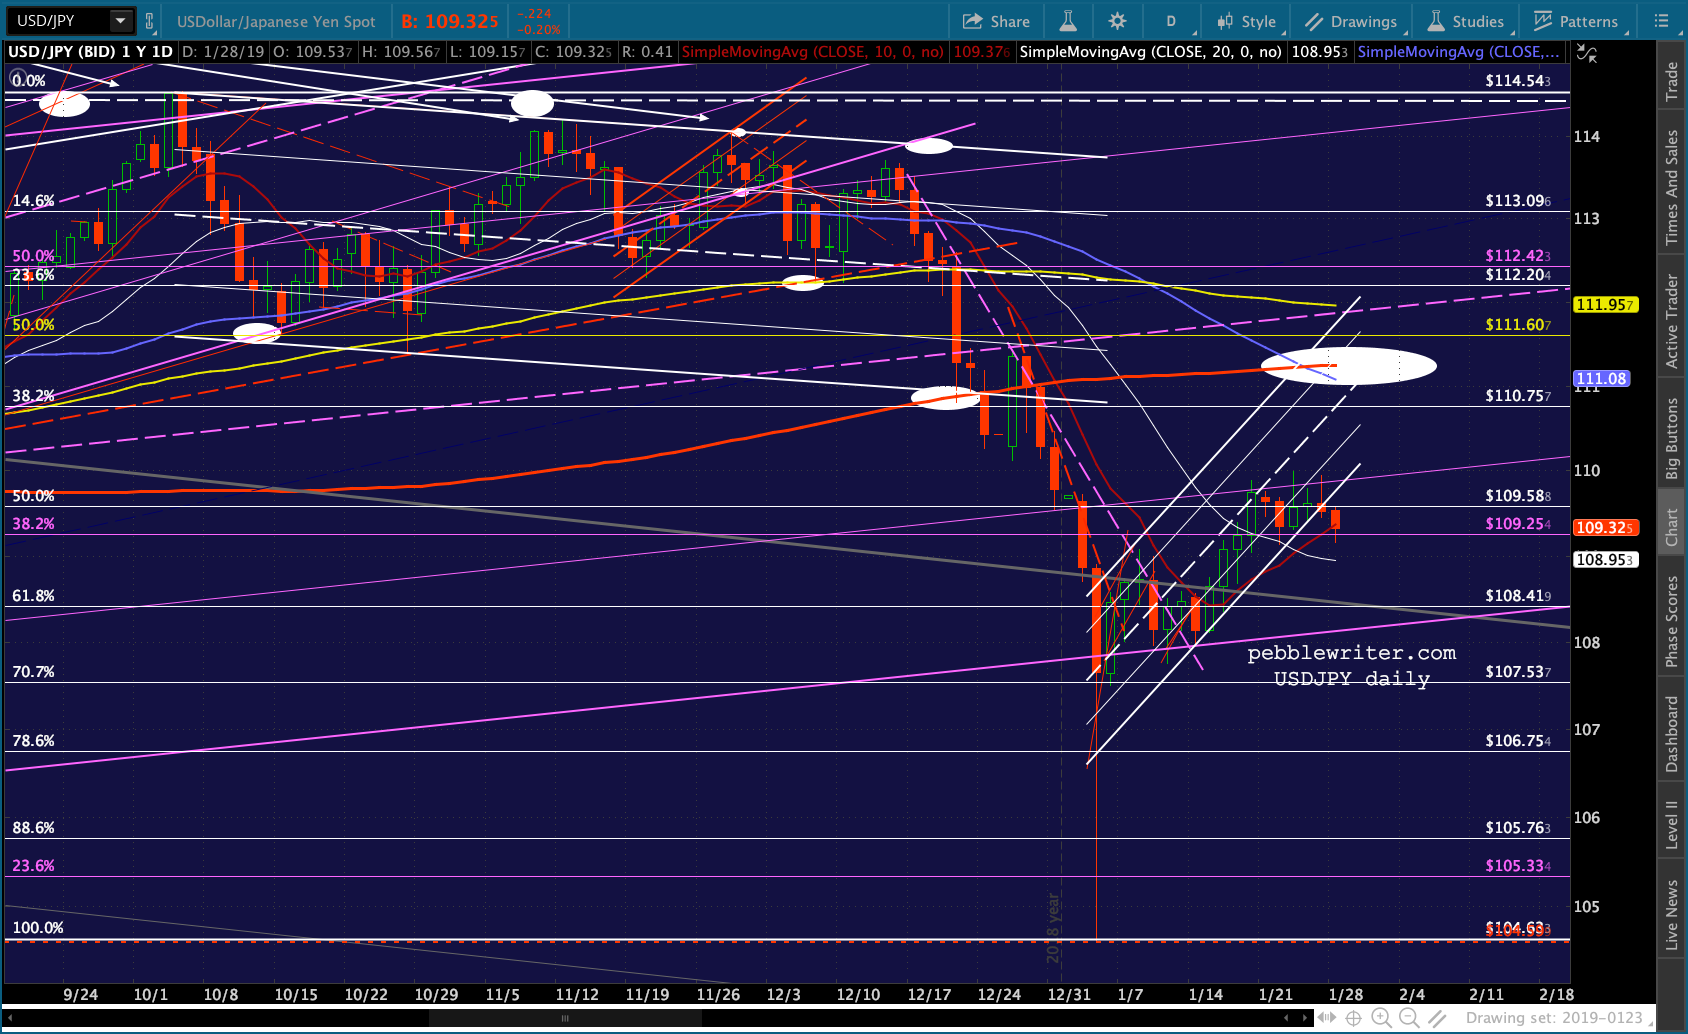 Likewise, all SPX has to do is hold steady over the next few days in order to keep the rising purple channel intact.
 VIX is getting battered again…
 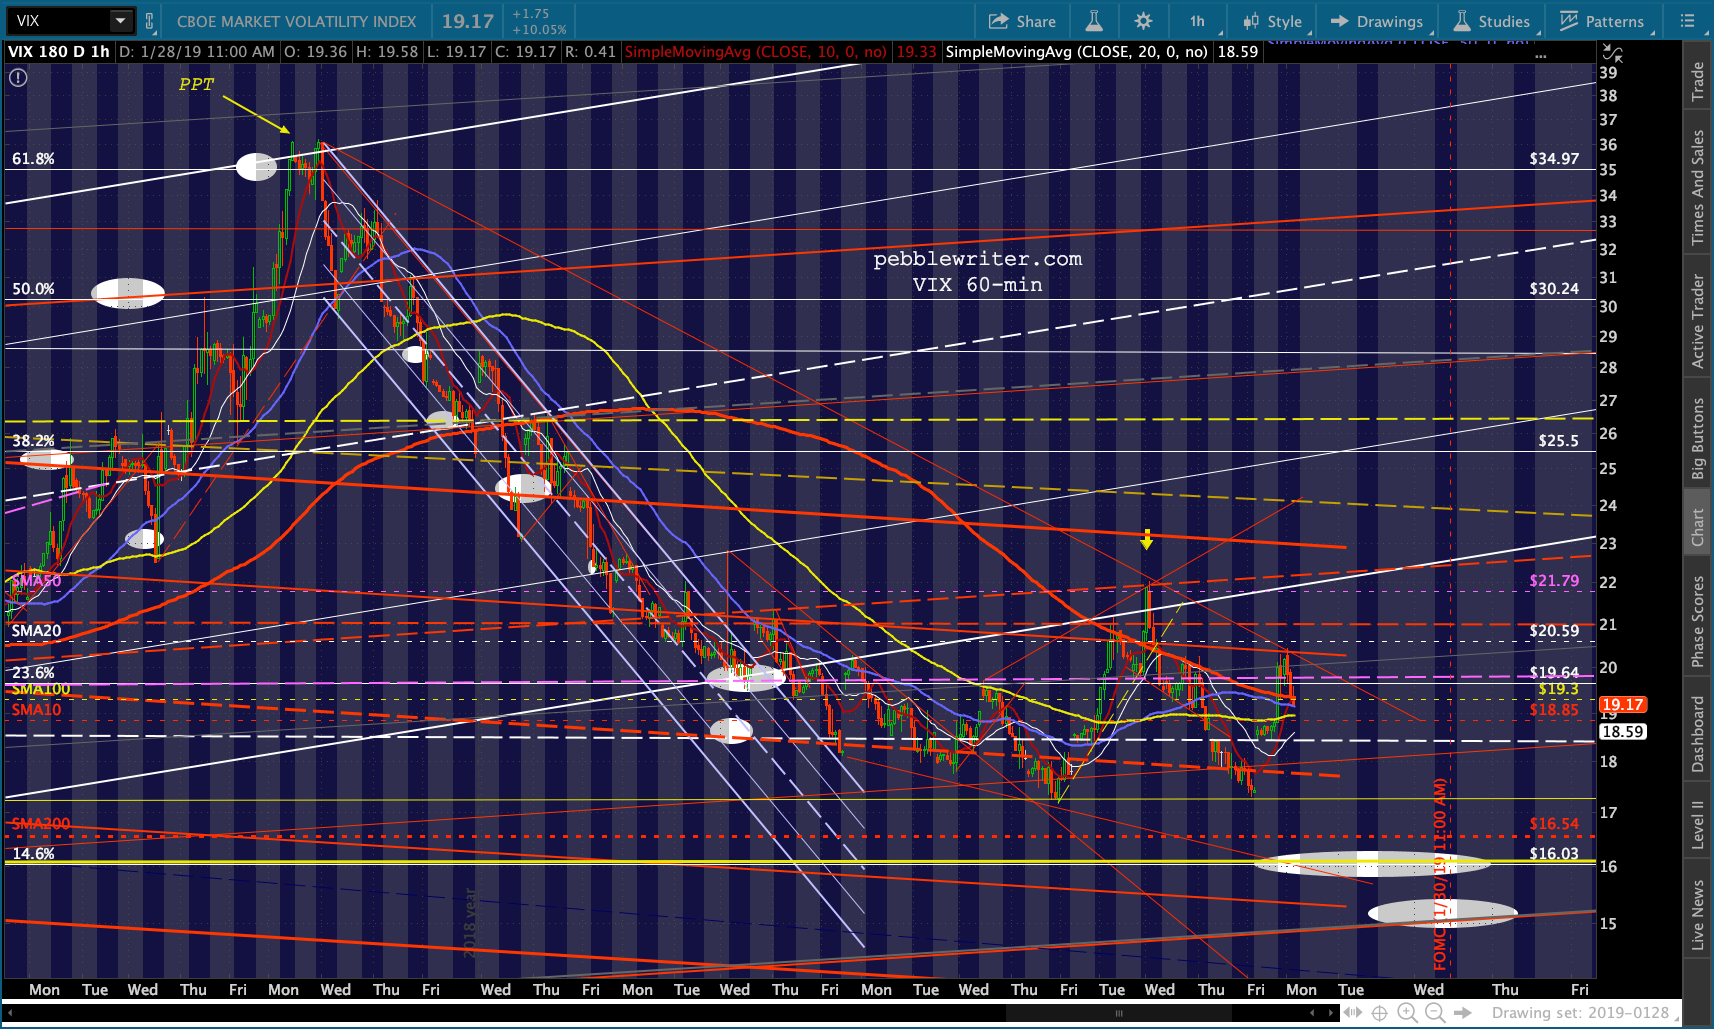 …and AAPL is recovering nicely — looks like a buying program in place.
 UPDATE: 3:00 PM
ES just backtested its white midline – important indicator of next steps… For those playing the ST bounce off the neckline, probably a good time to take profits.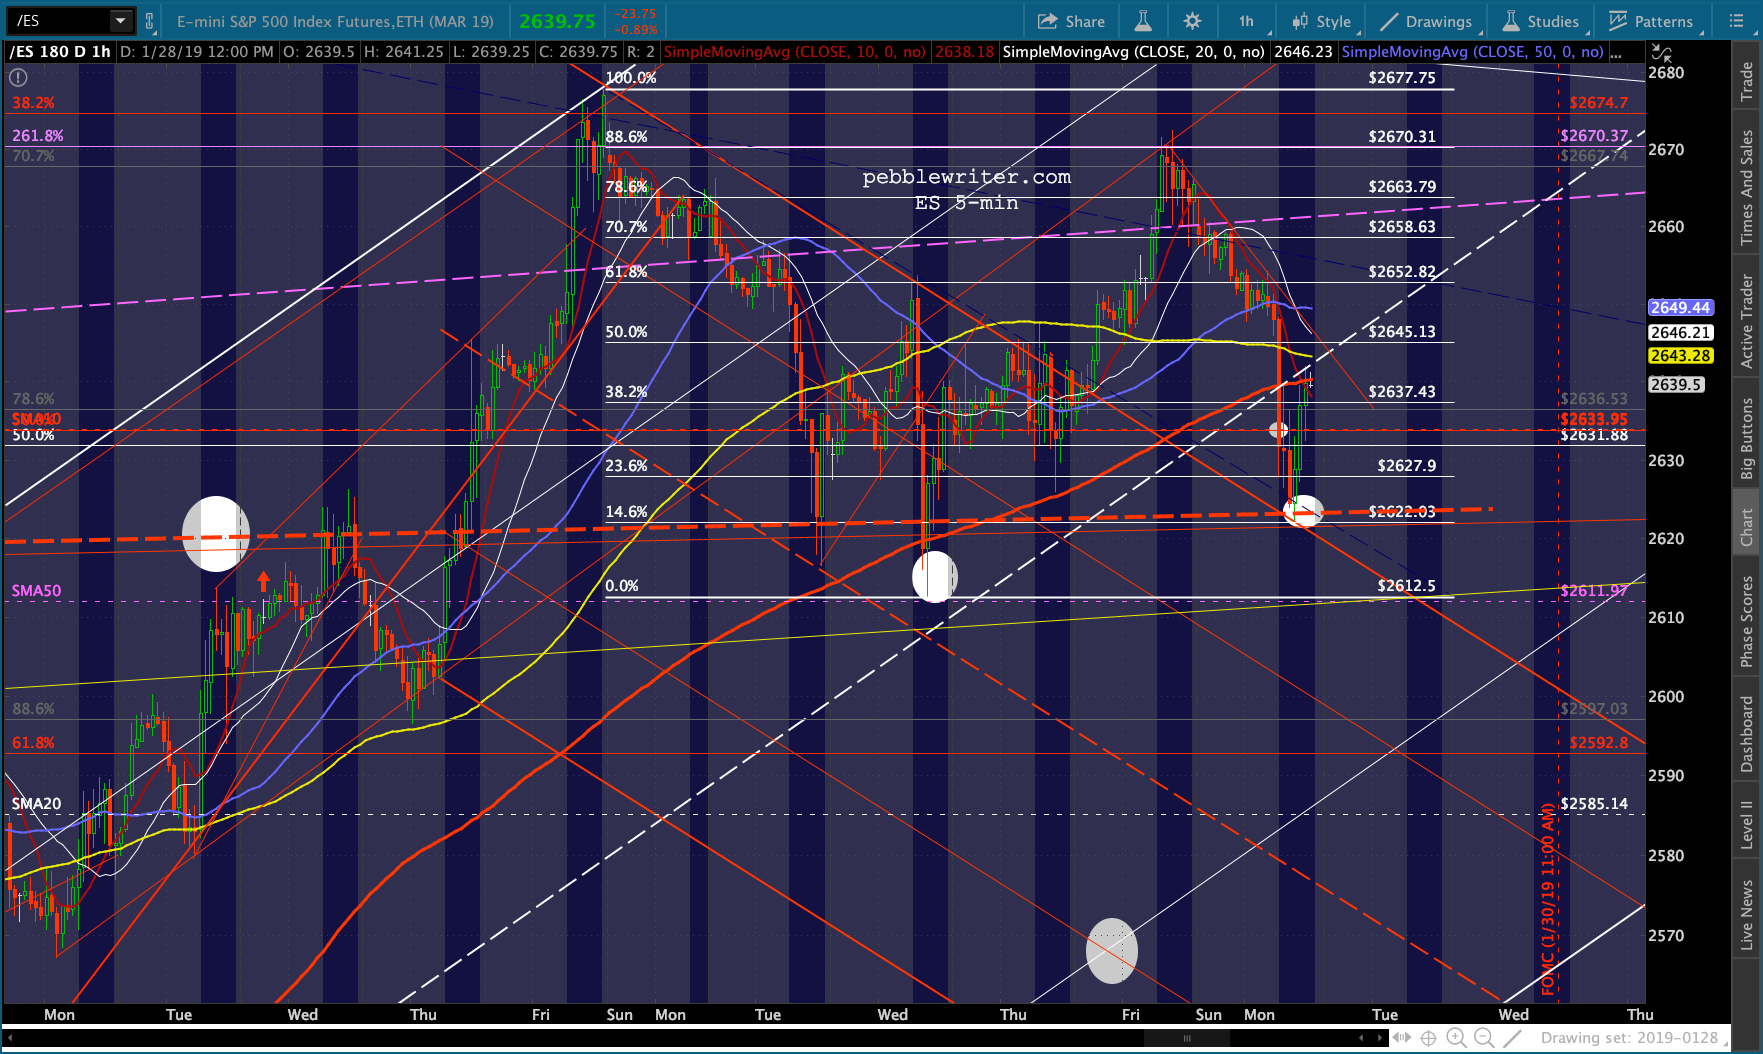 …though SPX seems likely to test its SMA5 200…
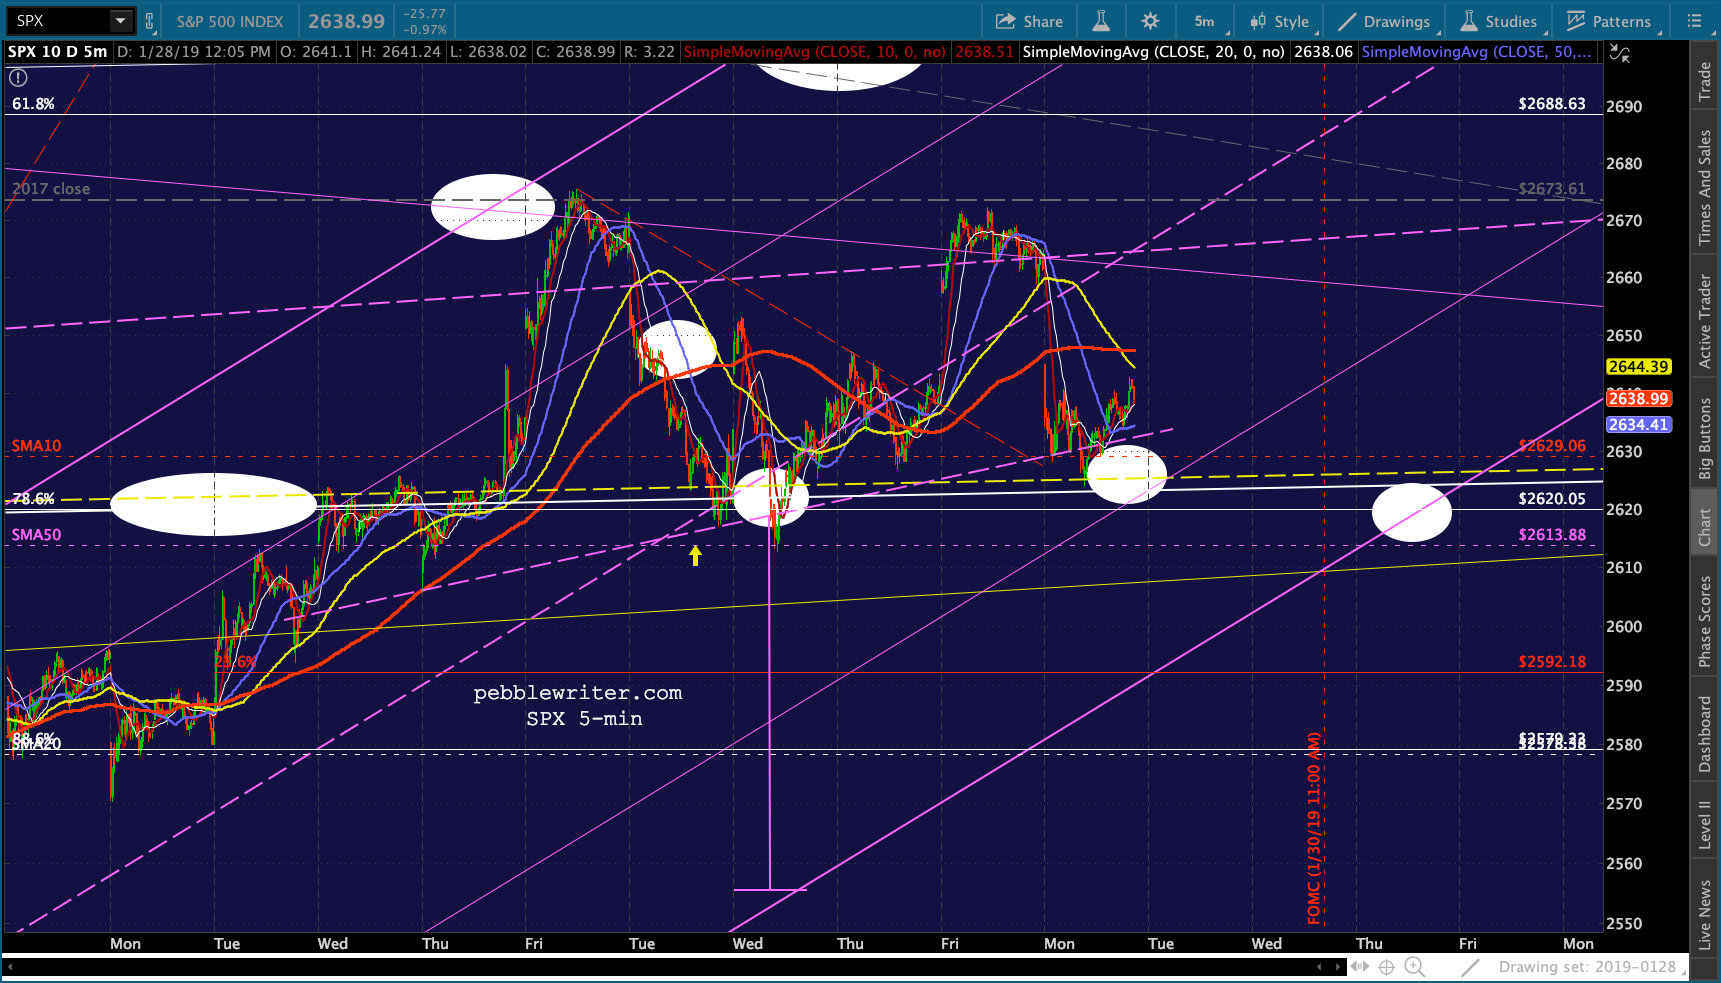 …and, VIX is vulnerable if it can’t top its SMA100.
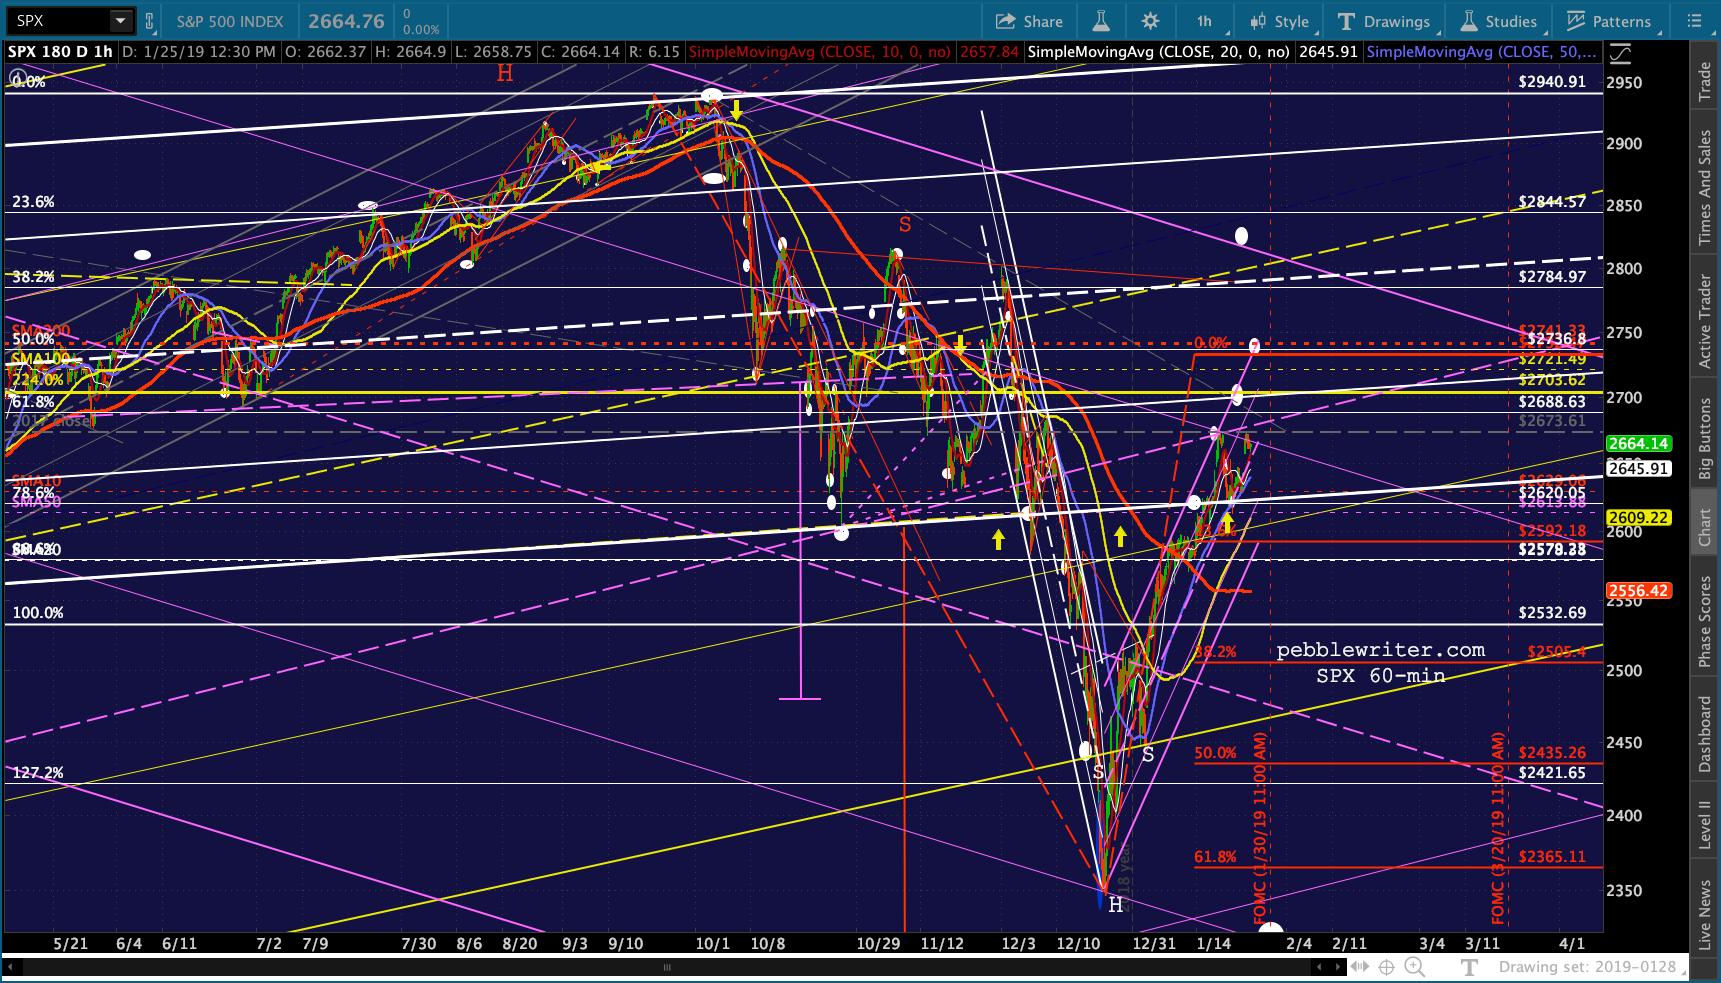
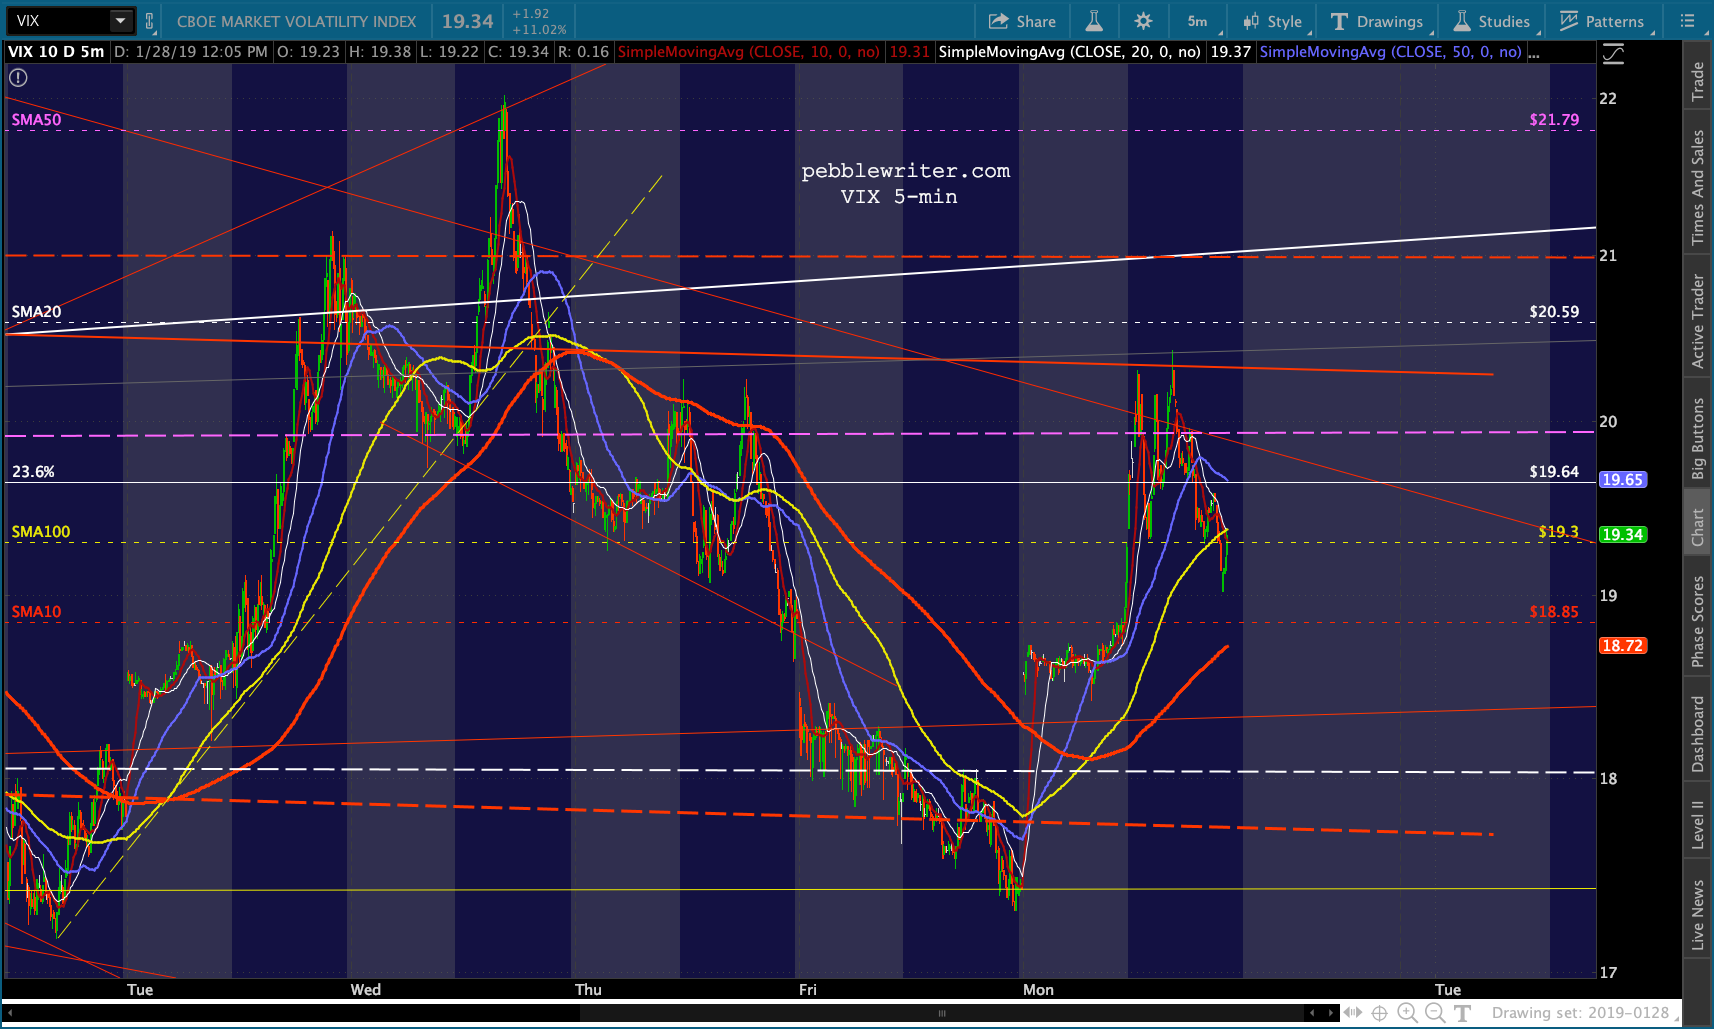 For new folks and those who haven’t seen it lately, here’s a shot of the big H&S pattern. The dashed yellow line is the neckline I keep referring to.
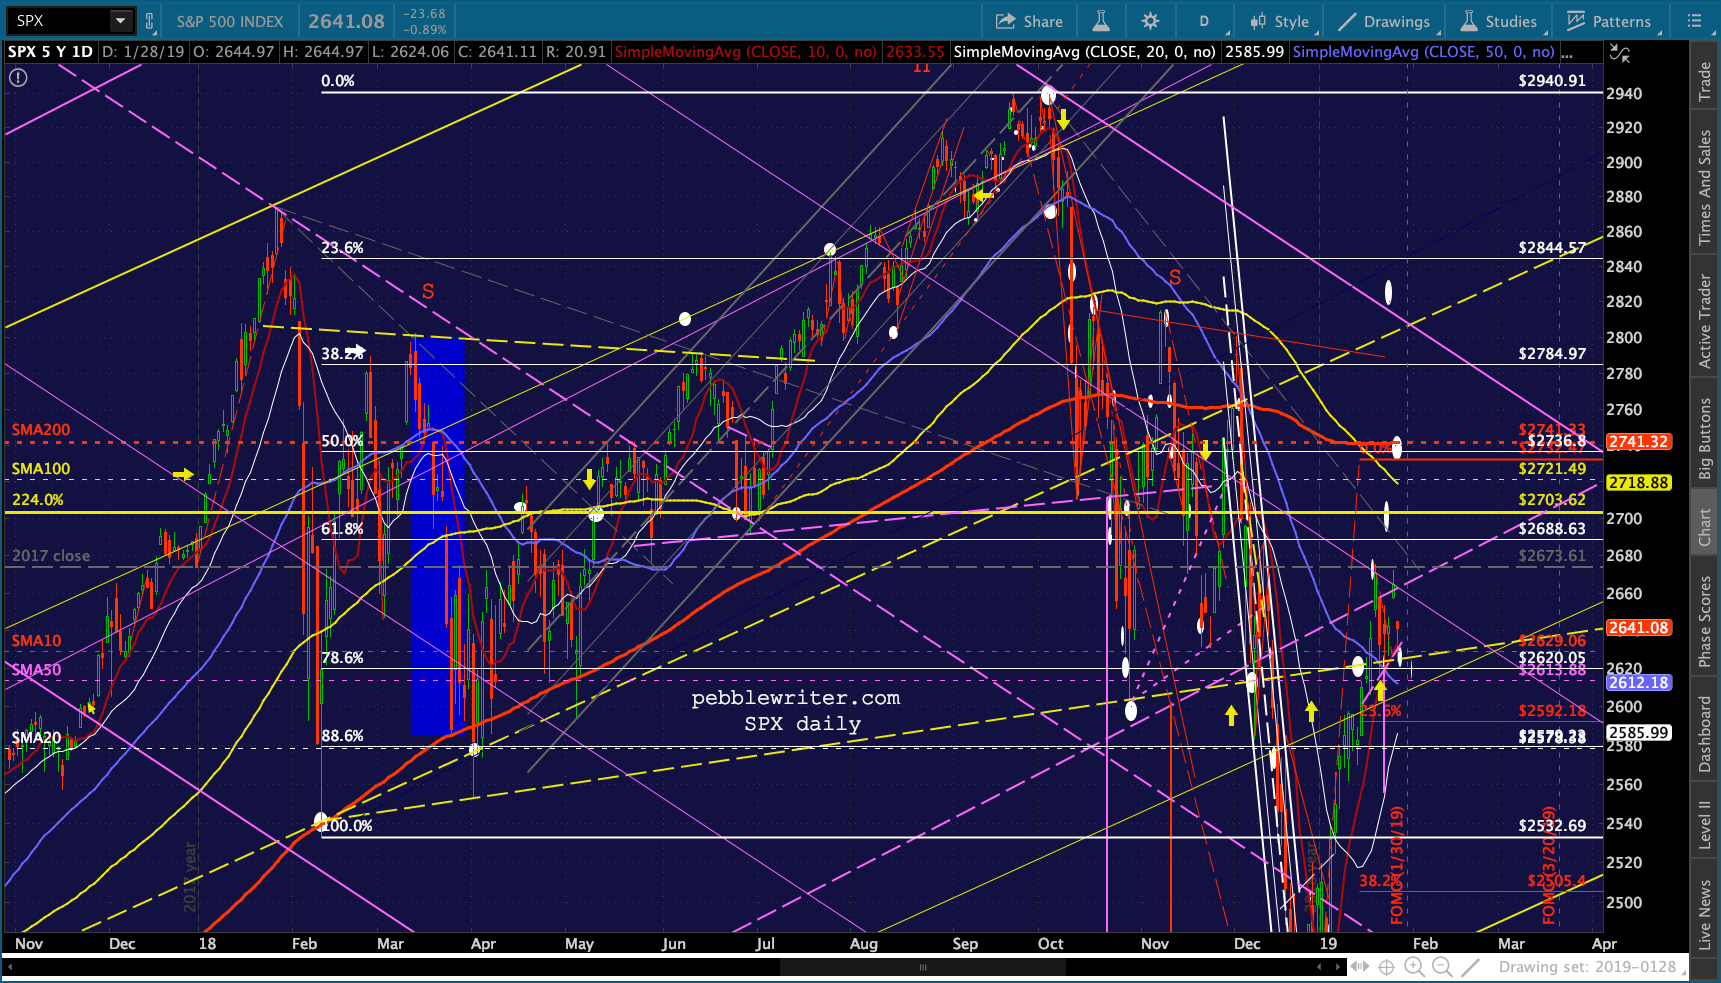 H&S Patterns, when they complete (a drop through the neckline) are supposed to produce drops equal to the distance between the head’s highs and the neckline directly beneath it. In this case, that works out to 2255.
The ways you can bust a H&S pattern are (1) to run the right shoulder up higher than the head or (2) force prices back above the neckline which marked the pattern completion in the first place — which is what’s happening here.
Remember that ES reached its H&S target back on Dec 26, but SPX came up short.
UPDATE: 3:42 PM
Putting Humpty back together again…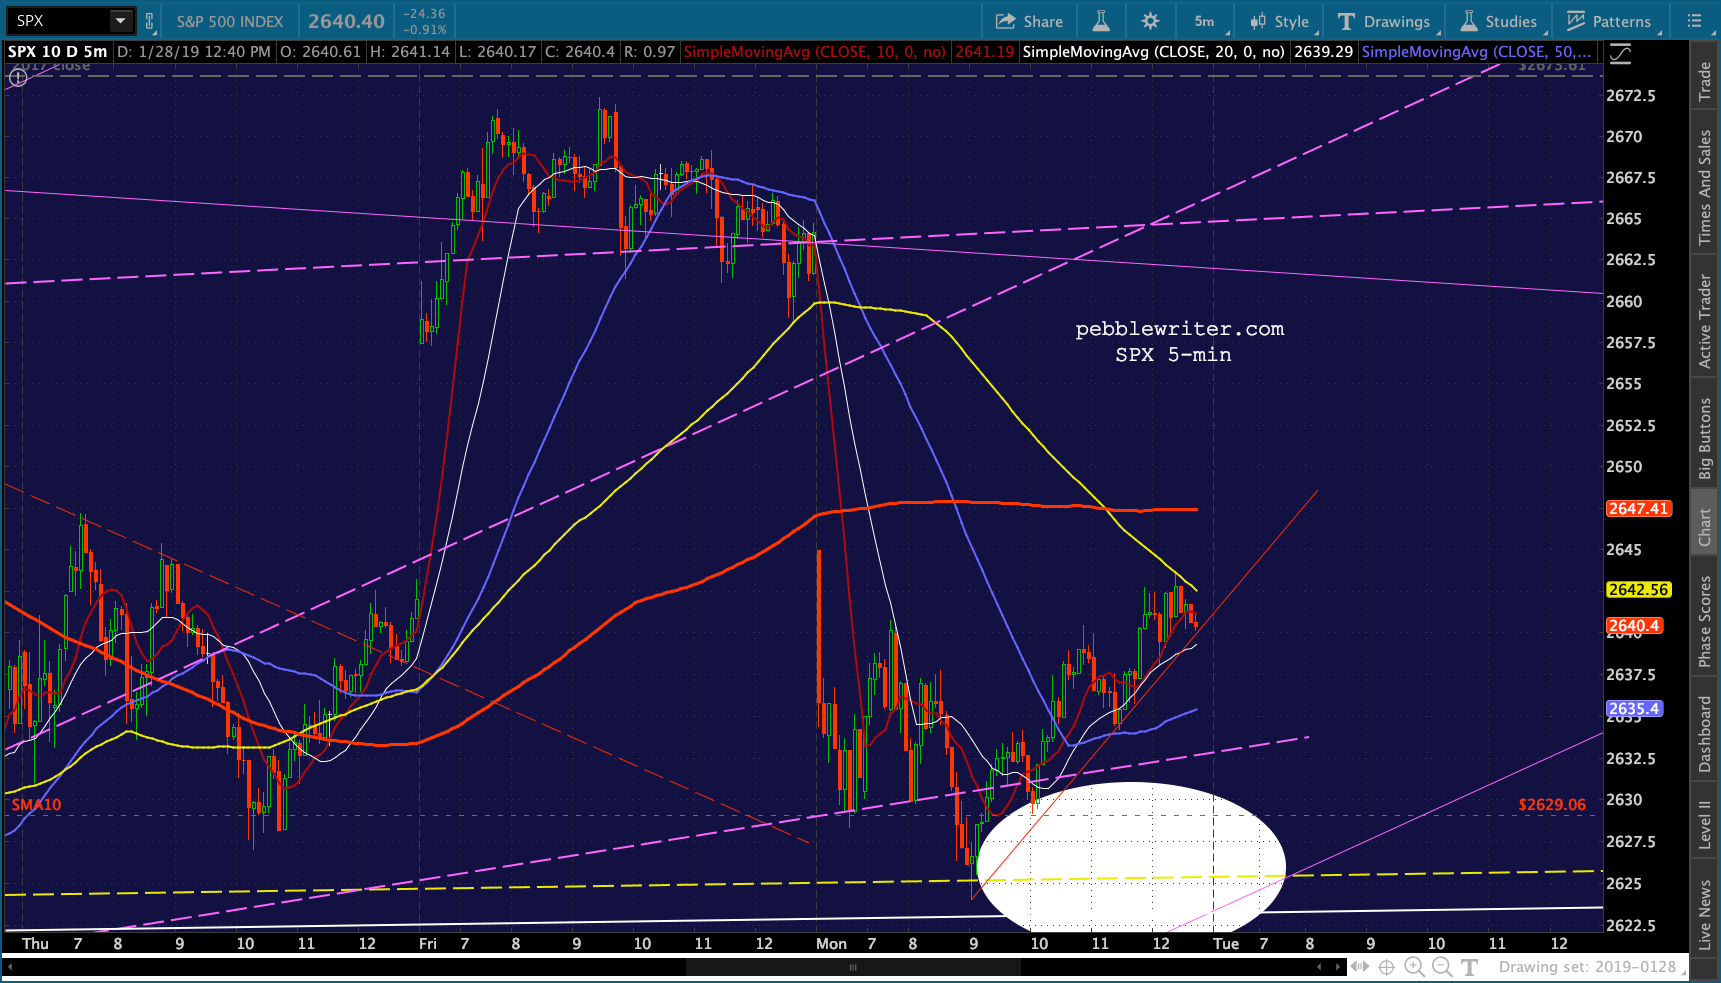
Comments
2 responses to “Are Earnings Suddenly Mattering?”
hold ES/SPX above the necklines… is that referring to the recent HS dashed purple neckline pointed out in your 1pm update?
Then looking at bigger picture. we are sitting near 50% retracement from Oct3-Dec24 drop, probability from time and fibonacci perspective this is significant high, or more likely more time to run?
Re the necklines, yes. Take a look at the daily charts posted late yesterday. Re the bigger picture, much will depend on how deftly the FOMC threads the needle tomorrow. As long as SPX/ES are above the neckline, one should be long. If they drop through, time to short.