

If you liked Tuesday, you’ll probably like today. We have an apparent overnight ramp in RB and CL (to the same overhead resistance)… …a dip in VIX (to the same support)…
 …and, another close by DJI below its SMA200.
 This time, S&P futures are up 17.5 points (previously 12) and still haven’t broken out of the falling channel from Jun 13 nor above the IH&S neckline.
 It’s not hard to imagine the instructions arriving from the Hamptons: “just don’t let it crash!”
And, speaking of crashes…I saw a few very interesting charts this morning. The first depicted a pace of corporate buybacks that was shocking. 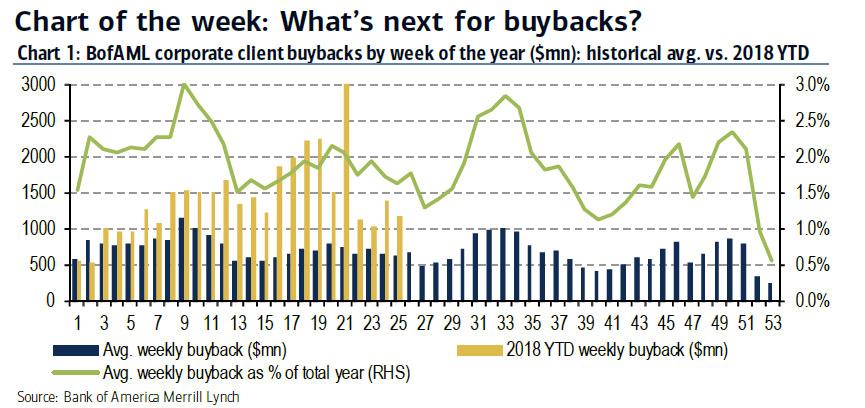 According to BAML, corporate buybacks are practically the only net purchasers so far this year. Imagine that.
The other put the rise in gas prices into perspective. Most Americans are spending incrementally more on gas than they received in cuts from the recent tax bill.  Take the lowest 20% earners and multiple the 8% of their income spent on gas in 2016 by the 30% YoY increase we’ve seen. The 2%+ increase in expenses easily outpaces the zero-point-whatever benefit they received from the tax bill. No wonder Trump is getting a little nervous.
 Or is he? If you’re the leader of the free world and have a direct line to the leader of every friendly OPEC member, is a tweet really the most effective way to get your message across? Or, is it just possible the tweets are window dressing, intended for his supporters? Just a thought.
continued for members… (more…)


