Month: June 2017

  • Flirting With Danger

    The Trump Rally never made sense to me [see: Why the “Trump Rally” is a Fraud.]  Yet, breakouts are breakouts, even if they’re driven by algo trickery and trend followers.

    SPX’s breakout in November was driven by exuberant spikes in USDJPY, DX and WTI and a historic suppression in VIX, which is at a crossroads.  If it’s to continue driving stocks higher — or even offset economic news that would see them correct, it must plumb new all-time lows.

    Our recent bottom call on oil [see: June 20 Update on Oil] was offered with the understanding that it has a natural upper bound — particularly over the next month.  And, the US dollar…well, it is flirting with danger.  It dropped below very strong support yesterday.

    continued for members(more…)

  • All About the Dollar

    Today, it’s all about the USD.  EURUSD continues toward our upside target, while USDJPY is pedaling as fast as it can to compensate.  As we’ve discussed all week, this leaves DXY at long-term critical support.Thanks to VIX and USDJPY, equities were able to put on quite a show yesterday, rallying back above support as expected.

    continued for members(more…)

  • Is it Safe?

    Two weeks ago I floated the idea that the USD, which had broken down below a long-term trend line and bounced, wasn’t done [see: The Rally That VIX Built.]  While the effects on equities would likely be muted by drops in VIX and a rise in oil prices, currencies were in for some significant moves.

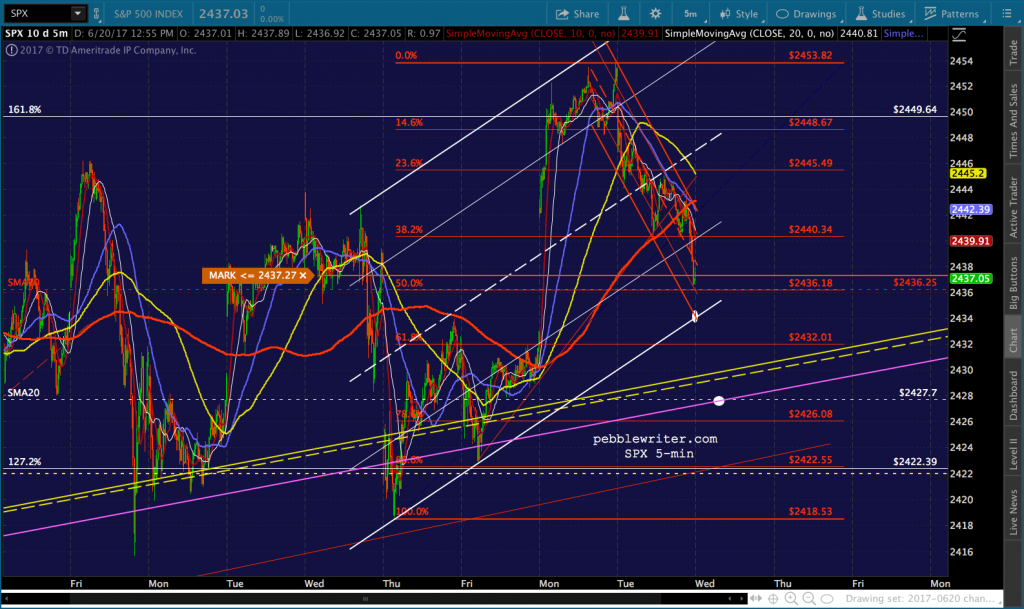
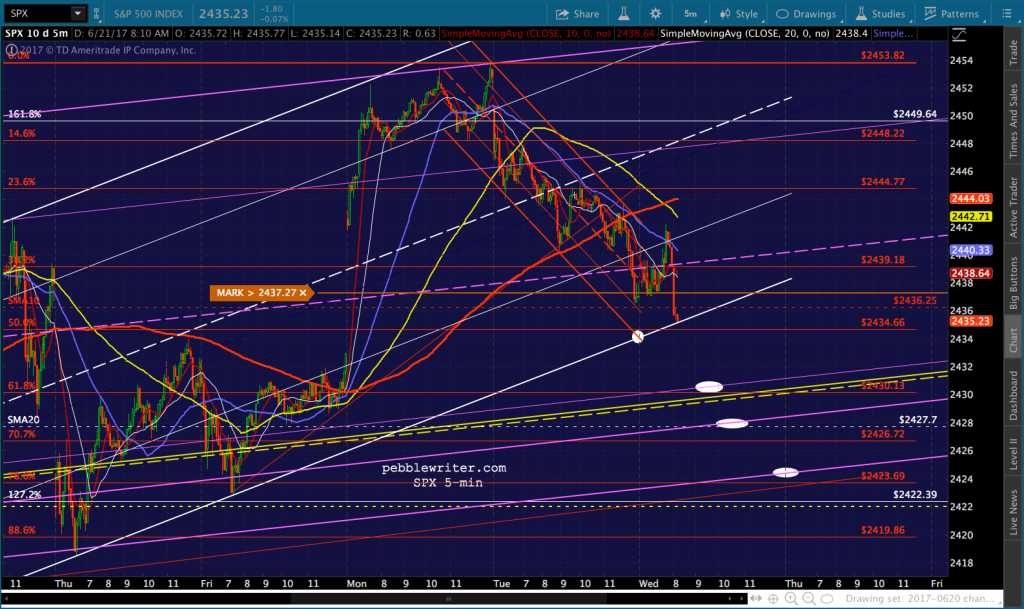
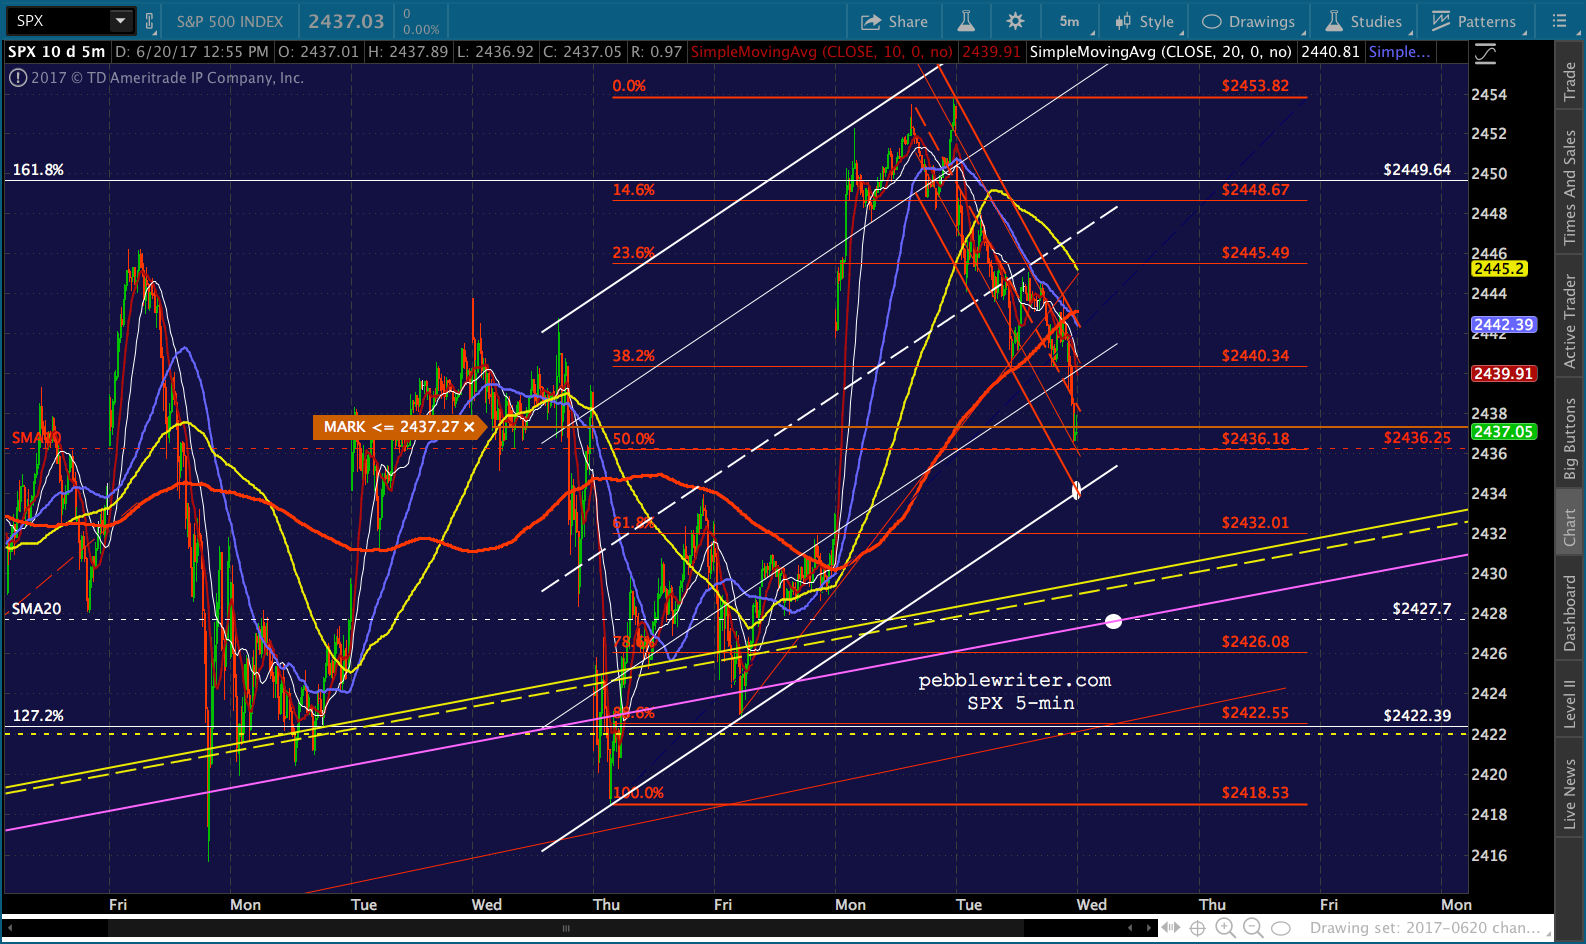
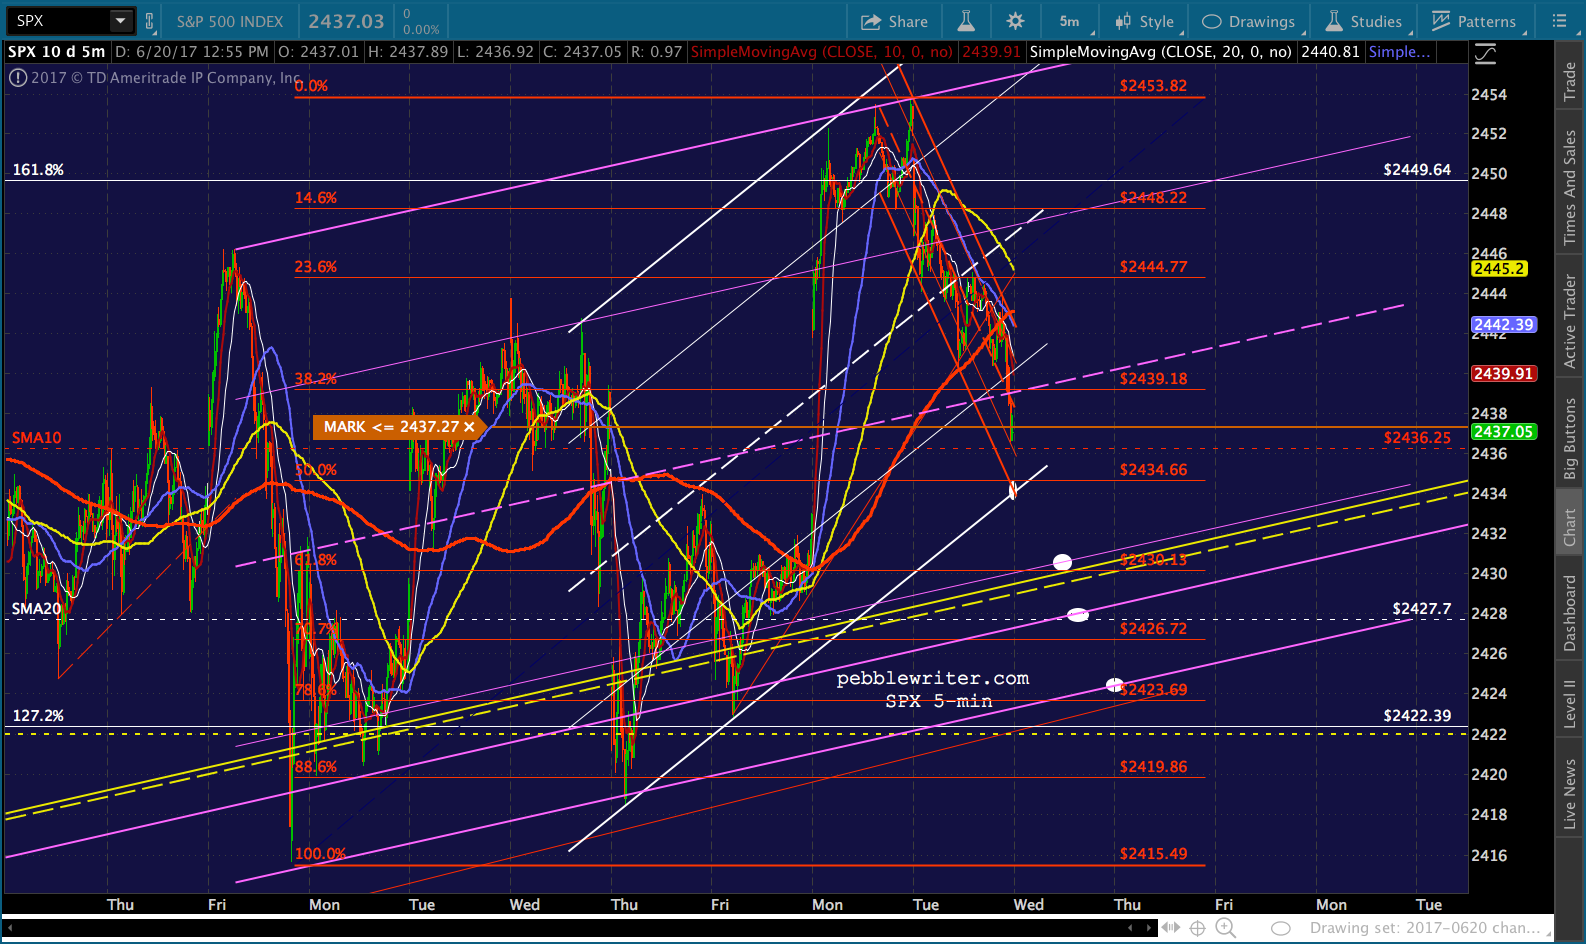
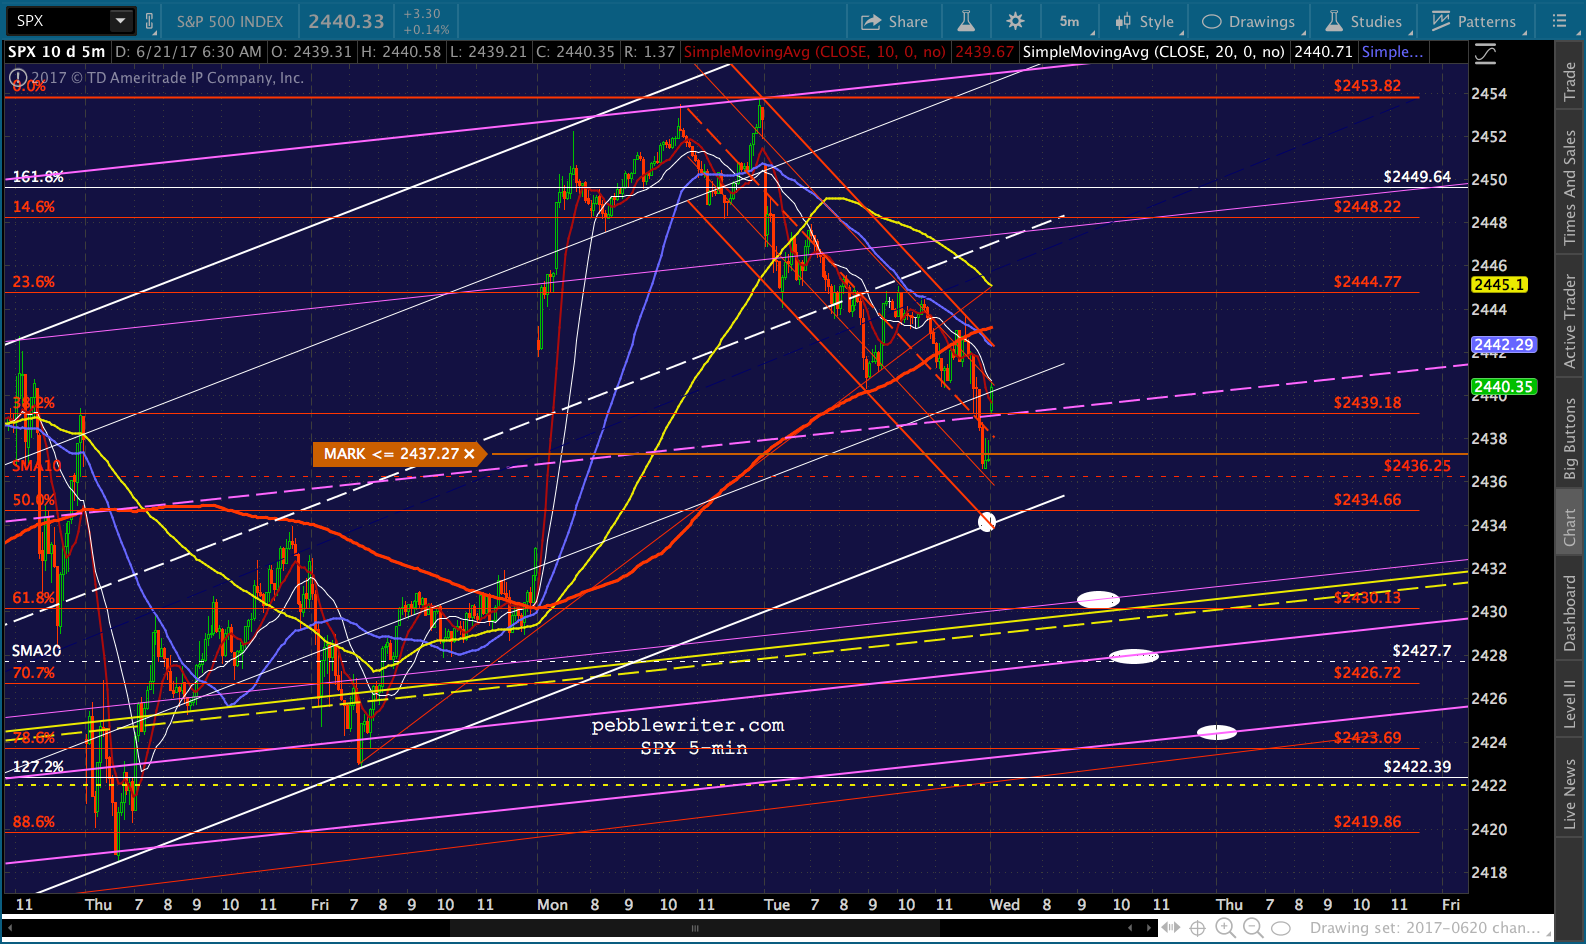
    Our thesis was that US economic data would continue to come in weak, and the USD would finally be able to tag critical support — the midline of a channel dating back to 2009 and the .786 line of another dating back to 2003.Yesterday, that move finally played out, resulting in a healthy sell-off in equities.  SPX, which reversed at our upside target on Monday, dropped to slightly below our downside target — a backtest of the large Inverted Head & Shoulders Pattern we’ve been tracking and a nice 30-pt short.With futures up over 7 points this morning, is the worst over?

    continued for members... (more…)

  • Euro Breaks Out

    Our short USD position is paying off in spades this morning, as EURUSD has broken out……and, DXY is plunging.

    This should complete the move we forecast two weeks ago [see: The Rally That VIX Built.]

    continued for members(more…)

  • Fundamentally Speaking…

    SPX was locked in a nice, neat falling channel last week until Friday morning when, after backtesting the top of our yellow channel for the eleventy billionth time, two fairly common things happened:  a rising channel for VIX suddenly broke down… …and, USDJPY “broke out” of the falling channel it’s been in since Dec 8. The result: SPX broke out of its falling channel (the yellow arrow):It doesn’t matter that VIX might not establish new all-time lows, or that USDJPY’s breakout might very well be another head fake.

    The only thing that matters is that SPX will have broken out of a falling channel and successfully backtested a rising channel — in other words, its “breakout” is intact.

    Thus, the divergence between real economic activity and stock prices will widen just a little bit more this morning. Bottom line: fundamentals continue to take a back seat to algos which — together with passive investing and other machine trading approaches — now account for 90% of all trading volume.

    As long as central banks control the primary inputs to the most powerful algos, fundamentals will matter less and less.

    continued for members(more…)

  • Charts I’m Watching: Jun 23, 2017

    After a drop to our downside target Wednesday, we were rewarded with a rise to our bounce target on Thursday.  It was an ugly close, but one which left SPX right at tentative support.

    It’s a good thing we have VIX to tell us whether or not stocks will be actively supported, today.  Is the rising white channel breaking down? continued for members(more…)

  • What, Me Nervous?

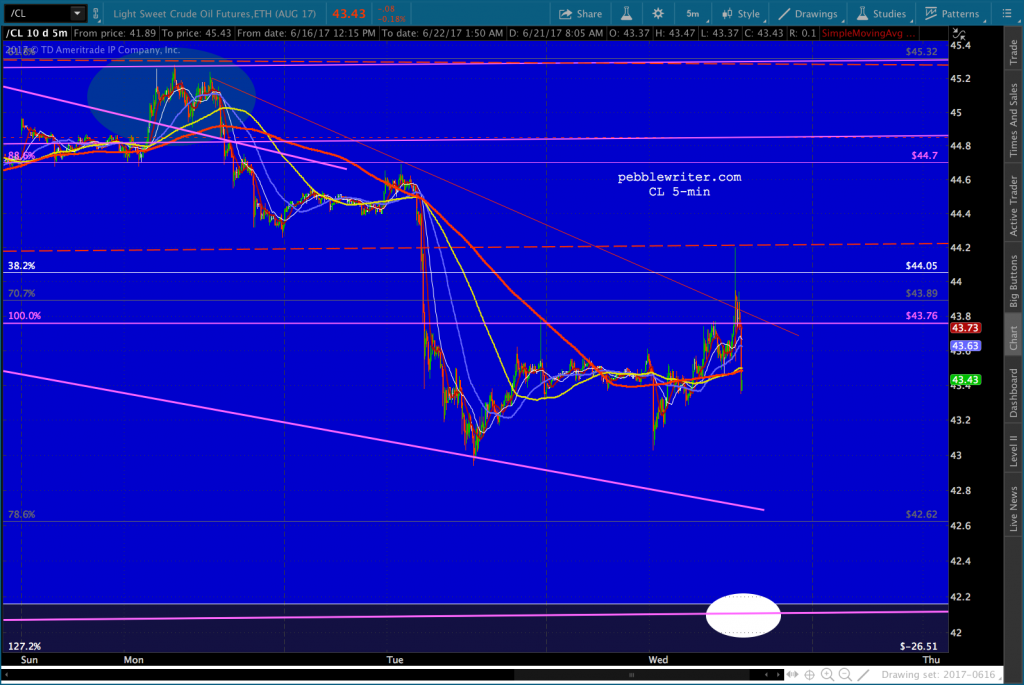
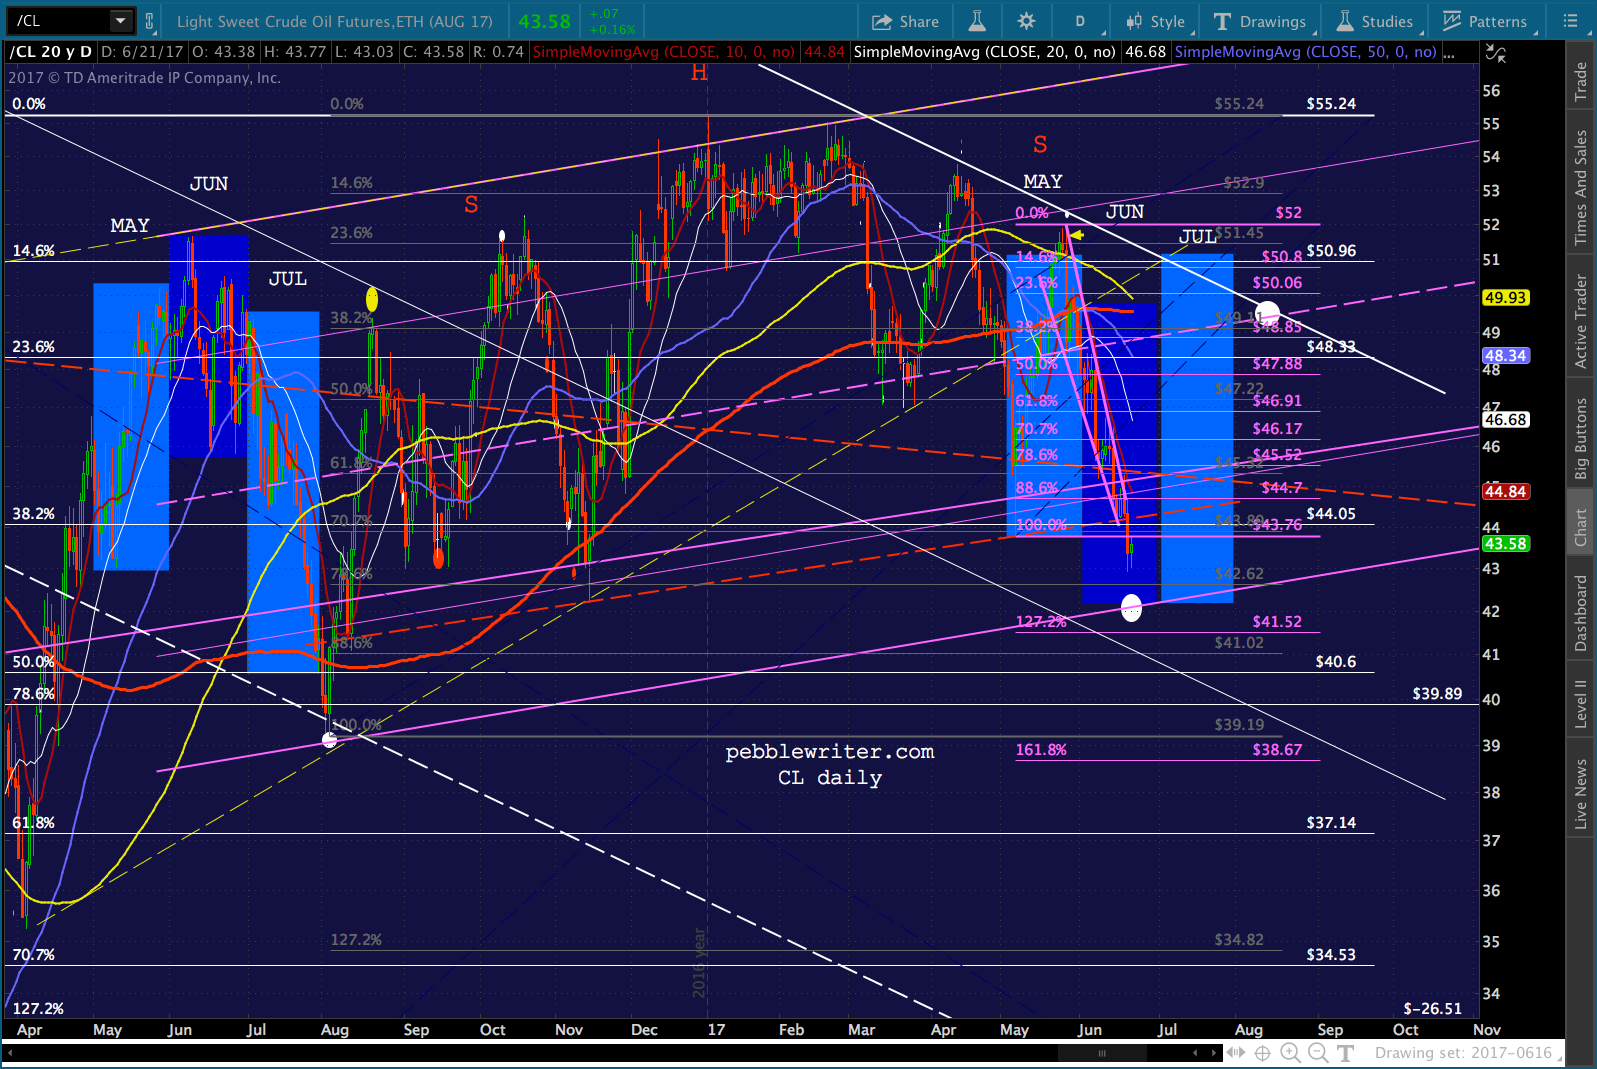
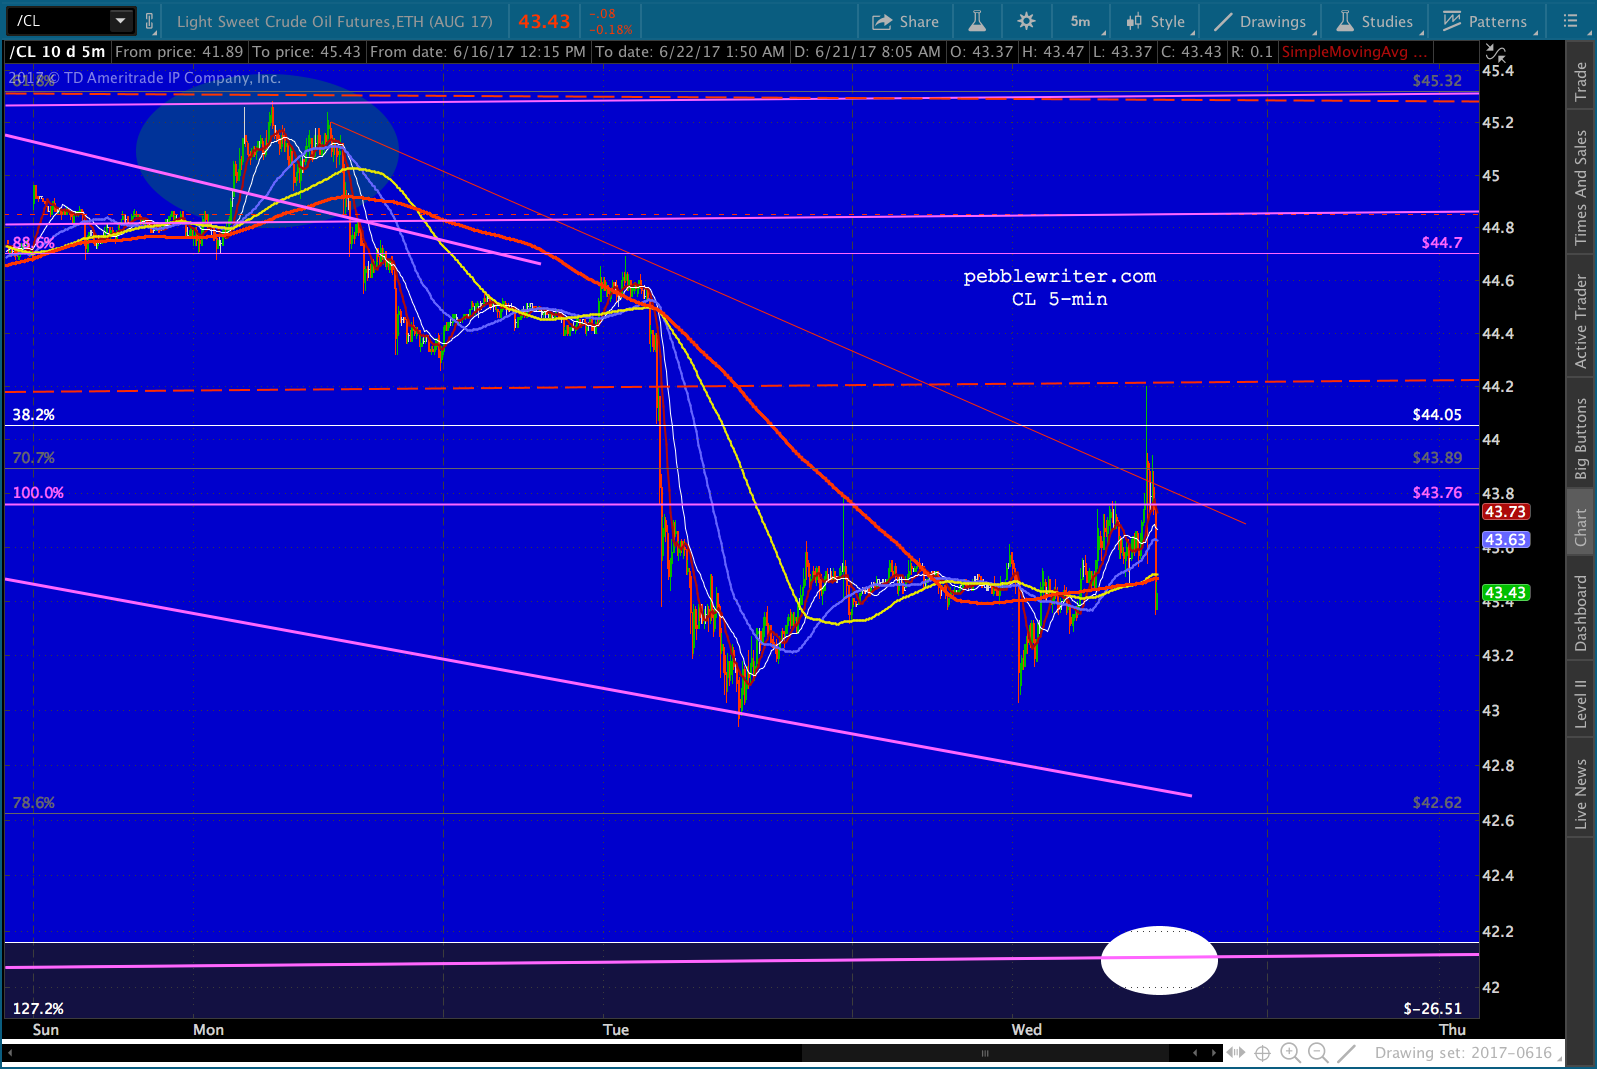
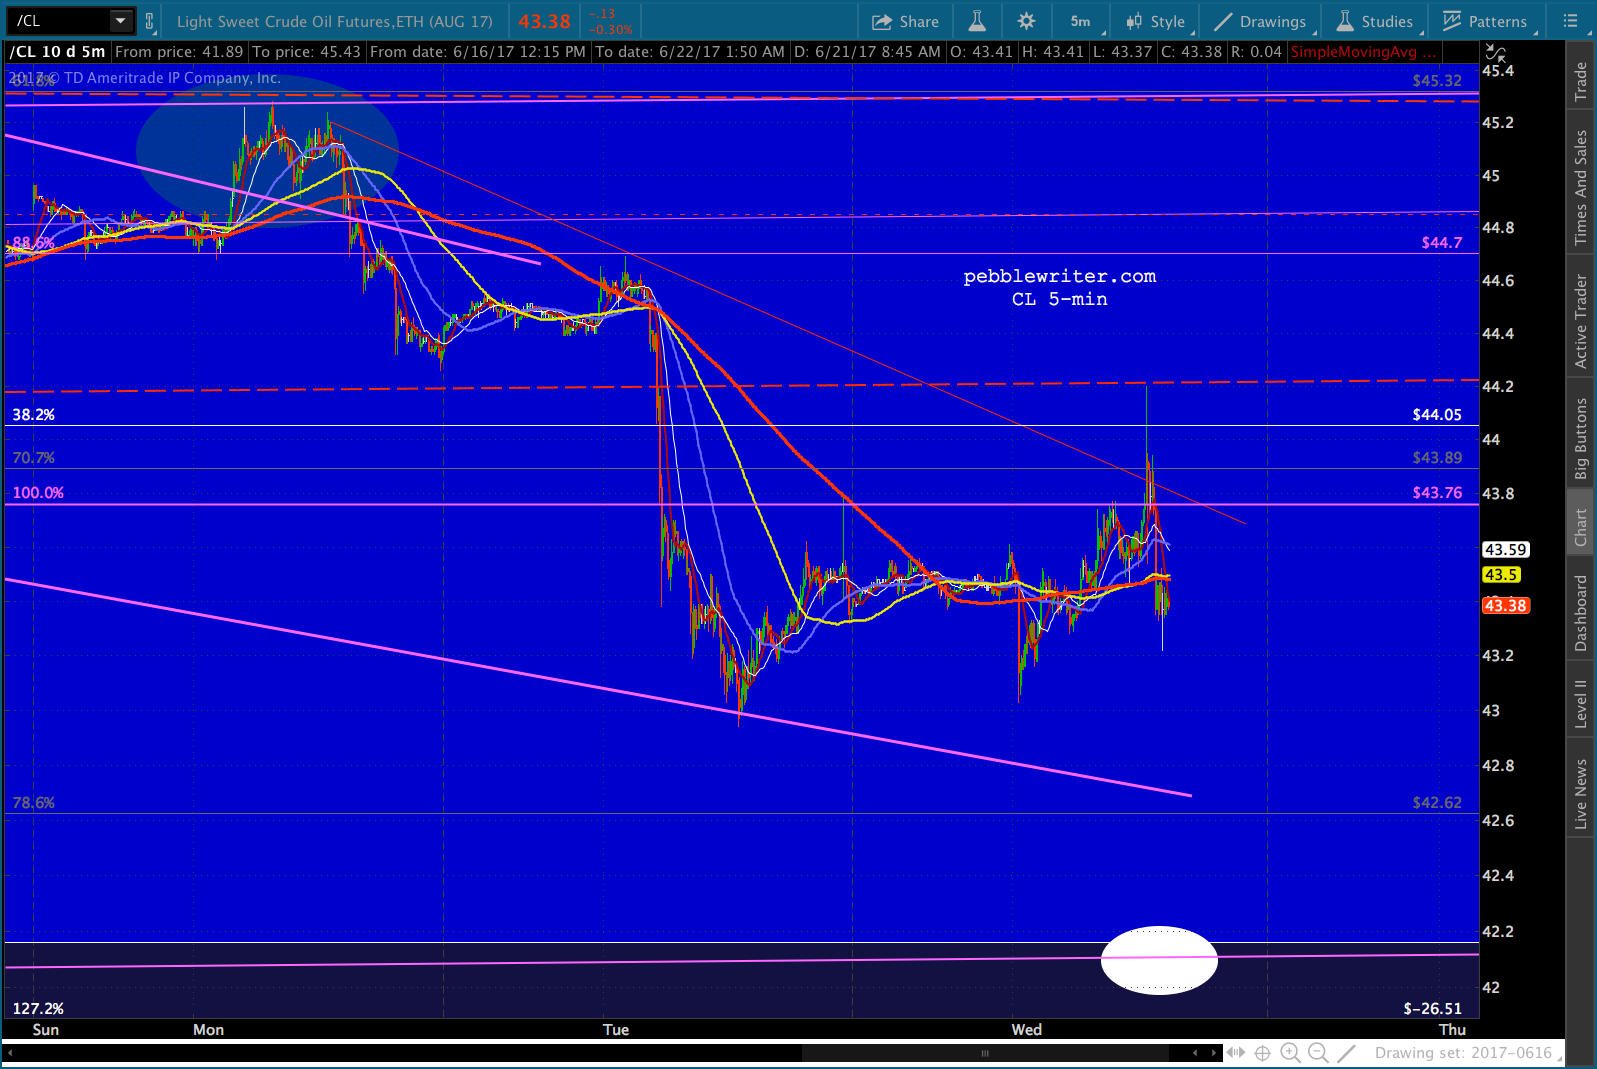
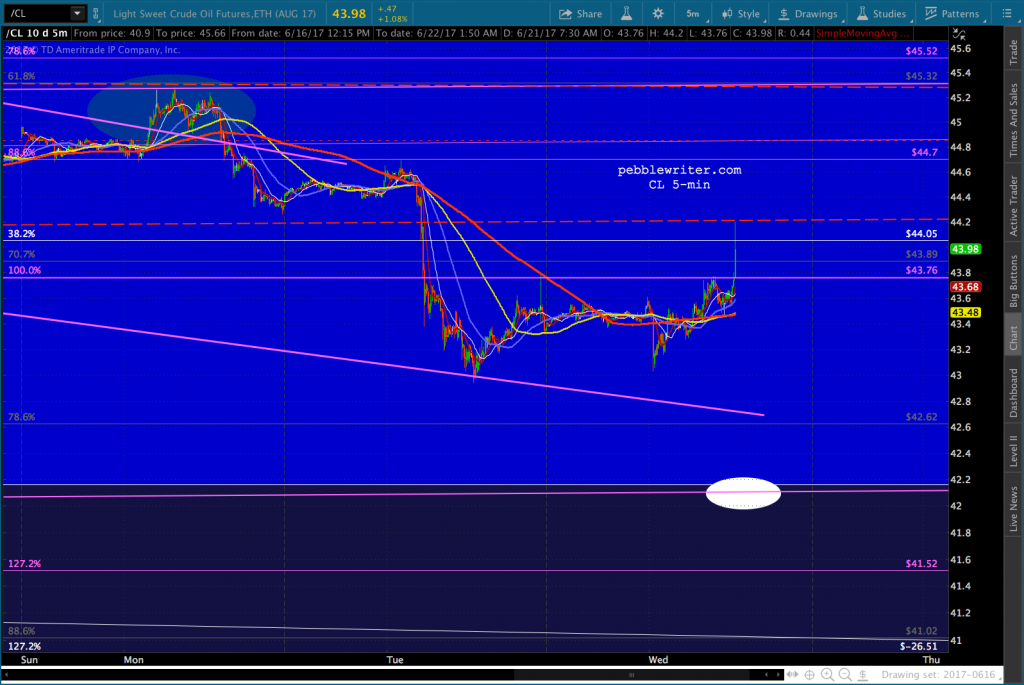
    After EIA’s modestly bullish inventory report came out, yesterday, WTI dithered for a moment before heading higher.  I was prepared to throw in the towel on our 42.11 downside target when its rally reversed at the exact price it needed to in order for me to quickly regain my confidence.

    The yellow arrow marks the Head & Shoulder Pattern‘s neckline that we laid out last week [see: Oil’s Dangerous Game.]   Three hours later, we bagged 42.11 and saw CL reverse as expected.  The bonus: it led SPX right to our downside target for it, as well.

    This completes a pretty nice short that tested us over and over again with three separate head fakes, an aborted bounce on a channel line, and another on the neckline.Do the fundamentals support a big rebound here?  Nope, not even close.  But, fundamentals have paled in significance to technicals and chart patterns for over a year.  And, if I’m right and central bankers get their way, they will continue to do so.

    continued for members(more…)

  • A Little Capitulation?

    All eyes remain on oil, this morning.  With the EIA inventory report coming out, we shouldn’t have to wait long for the final capitulation.

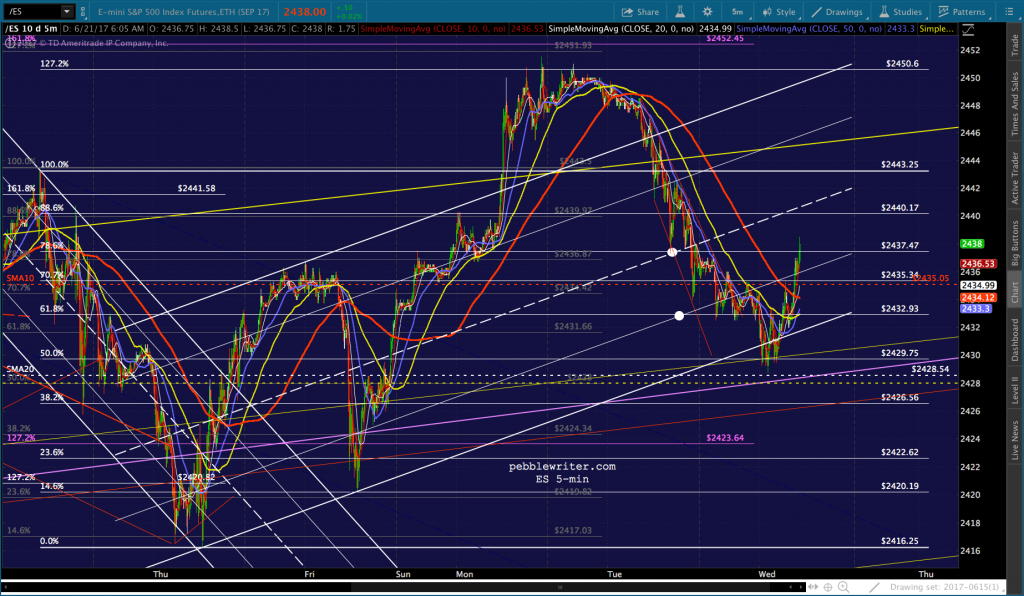
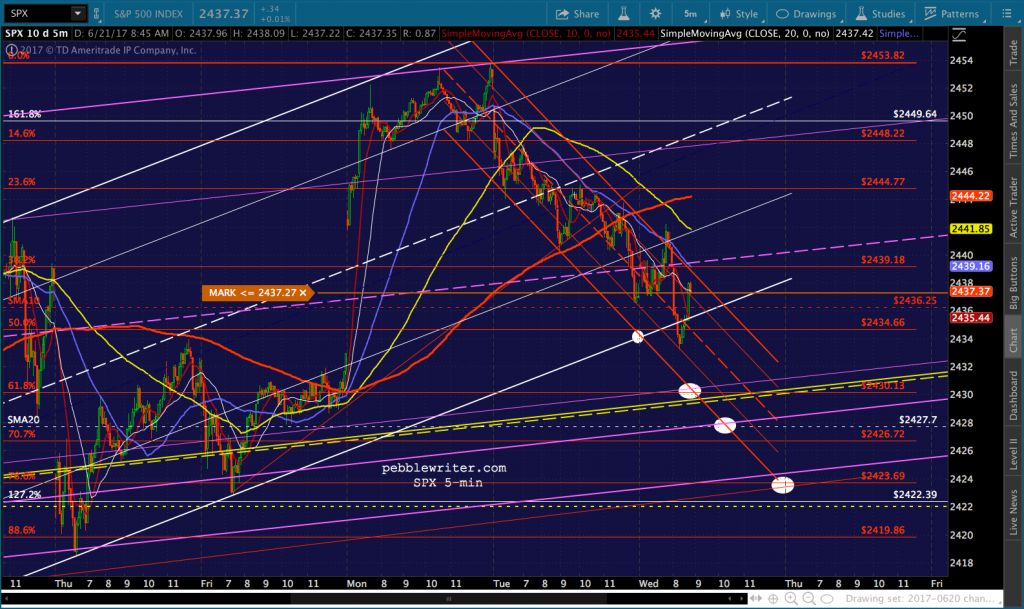
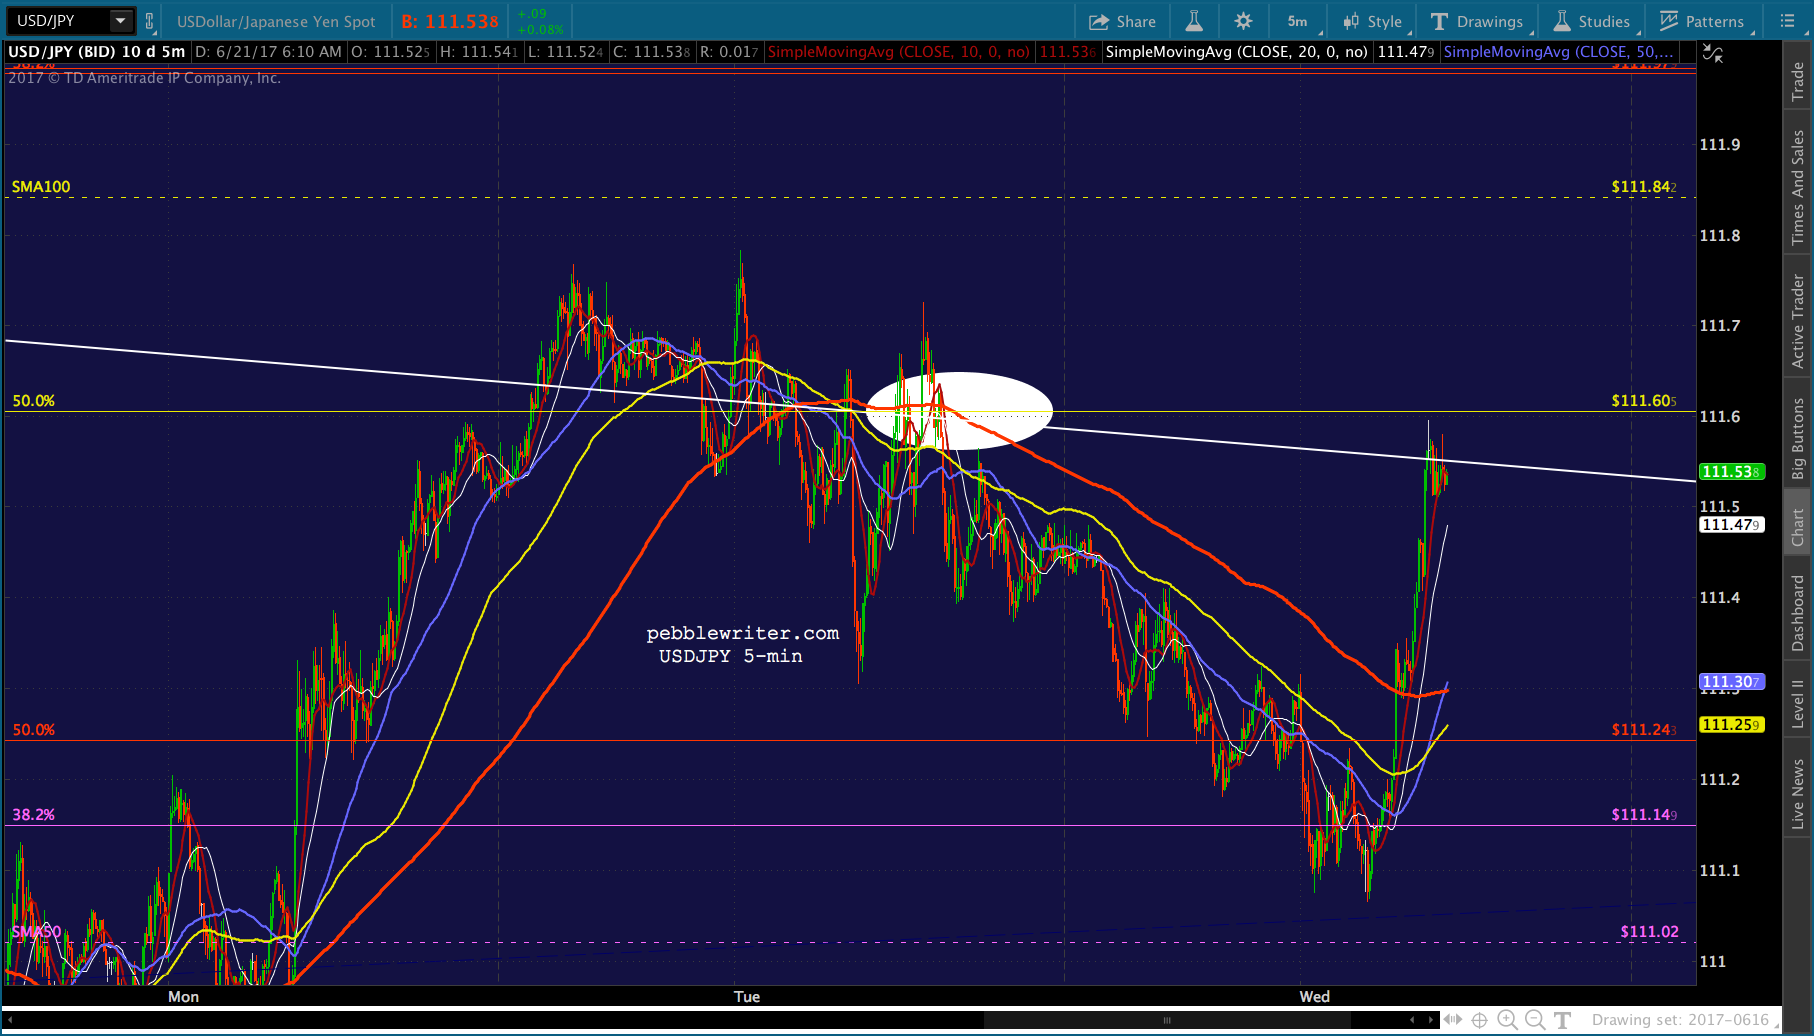
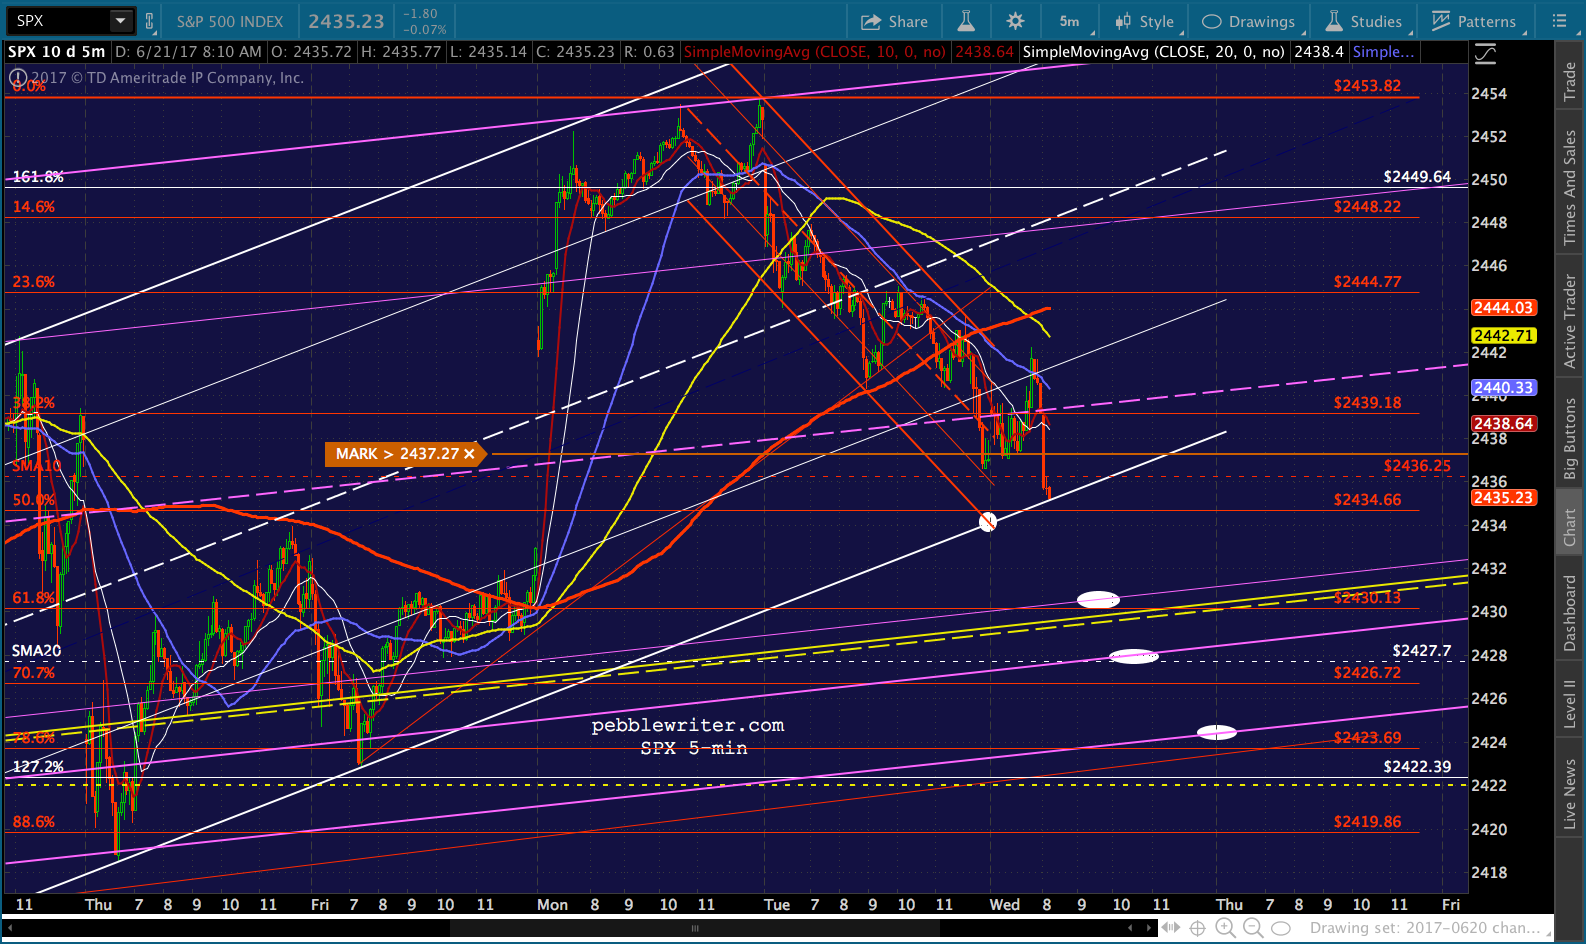
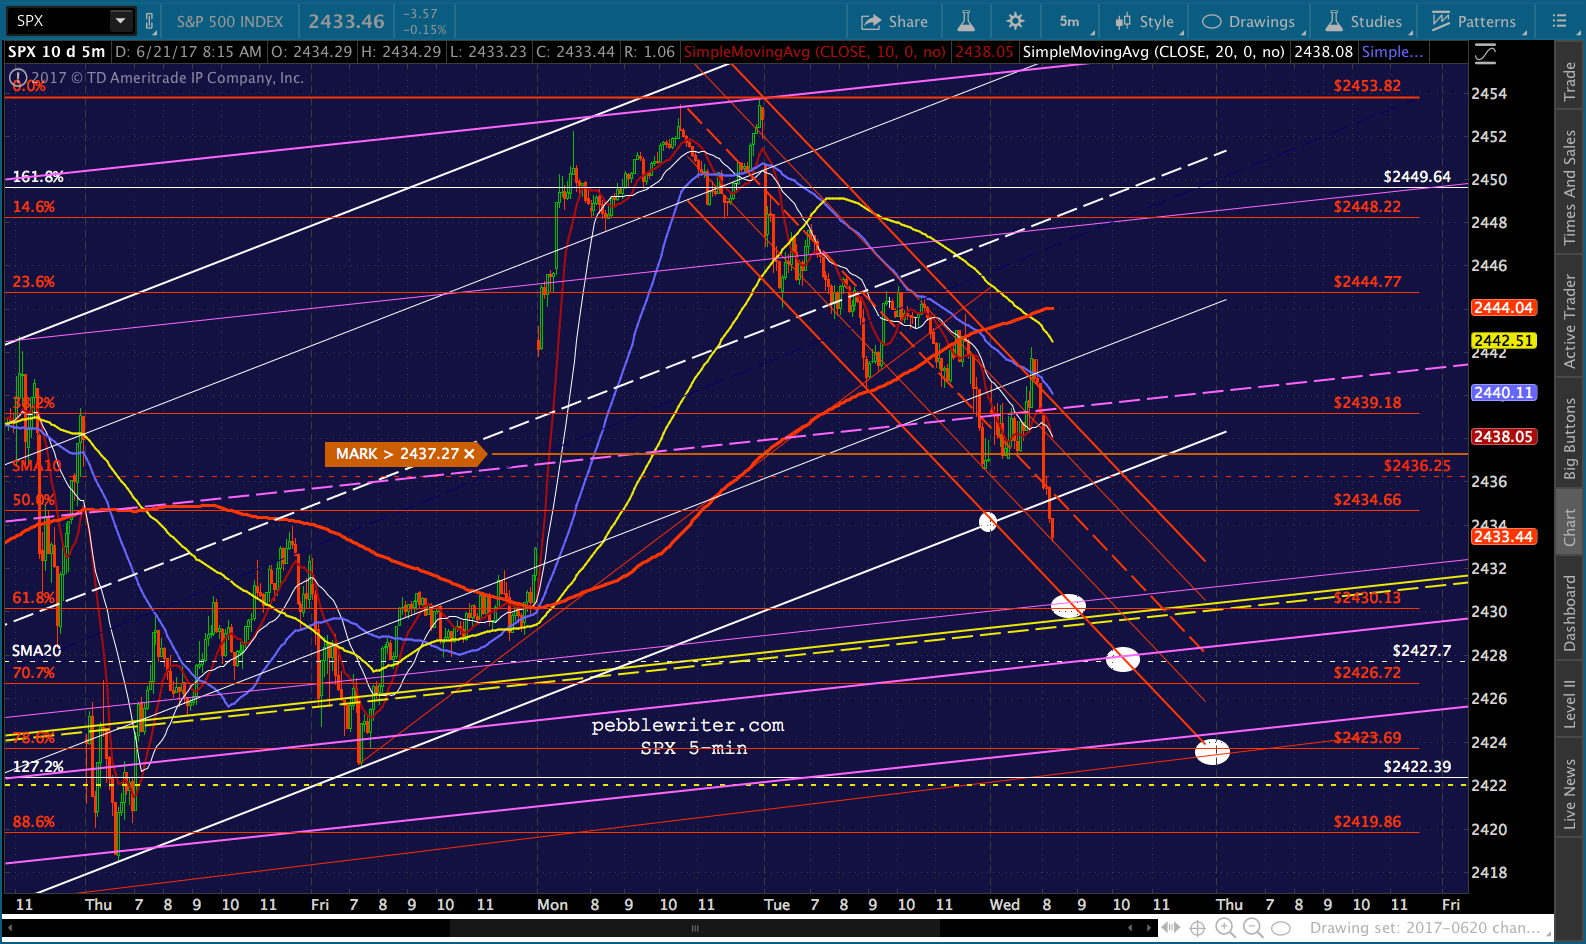
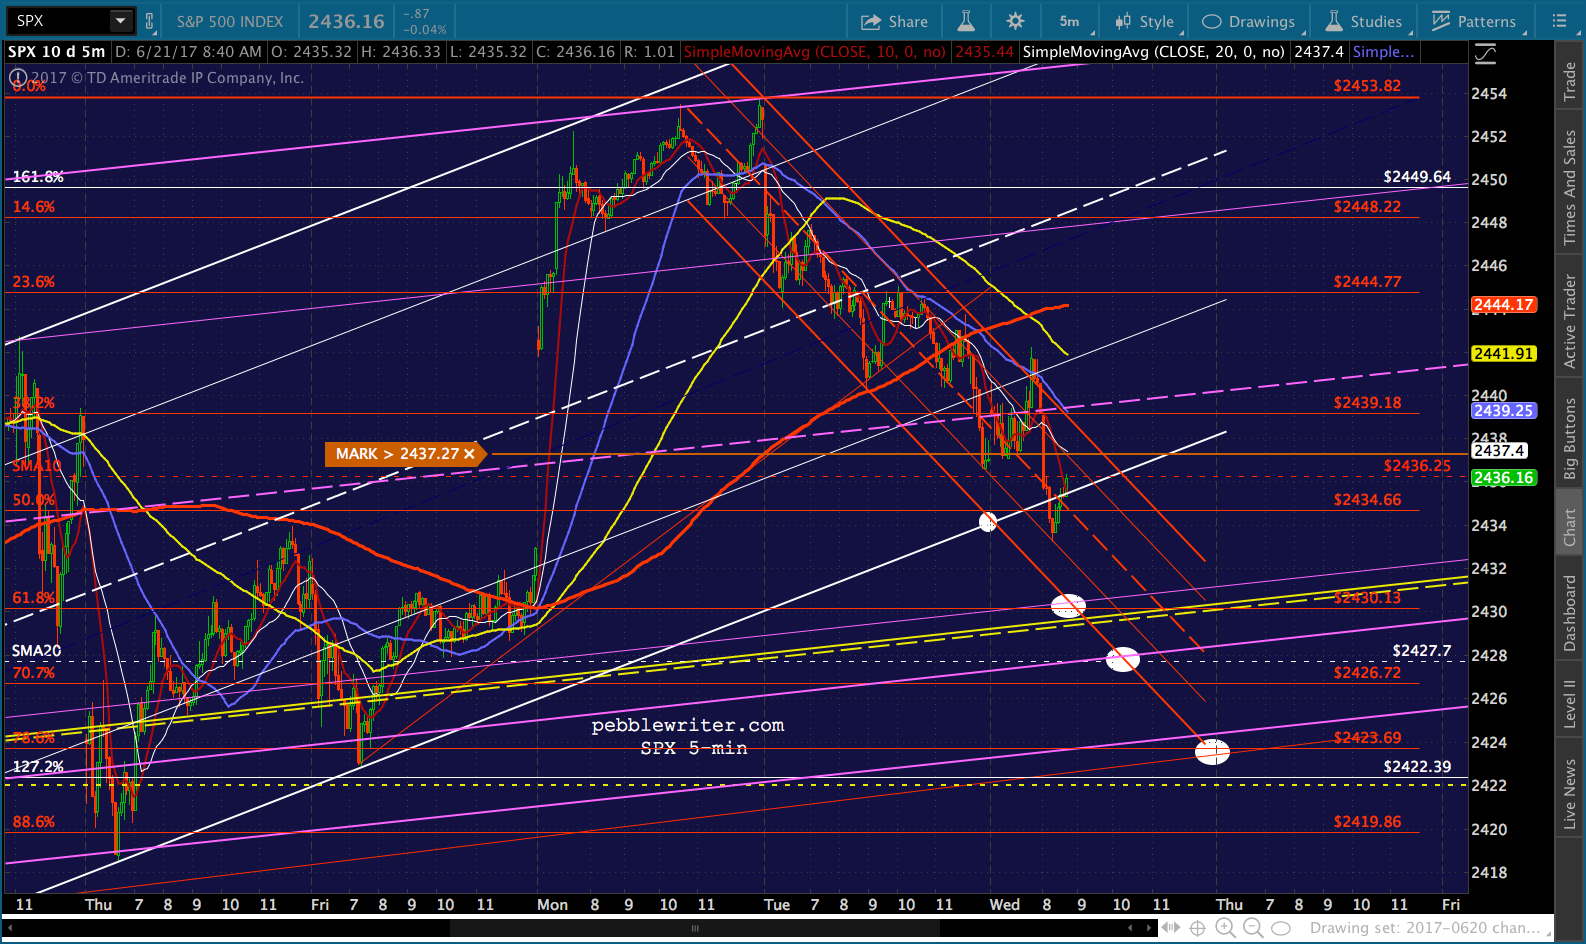
    Futures are getting a jump start, as ES has rallied 10 points — back to even – on a sudden spike in USDJPY back to channel resistance.SPX got within 2 points of our downside target yesterday.  Will it be able to hold?

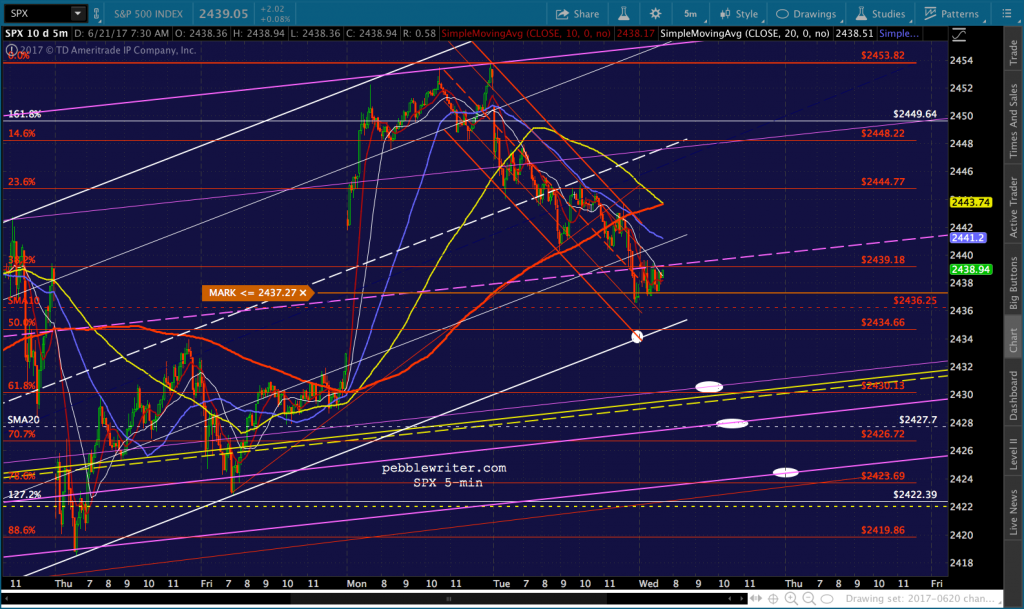
    As long as CL reverses at our next downside target — the purple channel bottom at 42ish — SPX should be able to hold 2430 for now.

    If not, look out below.

    continued for members

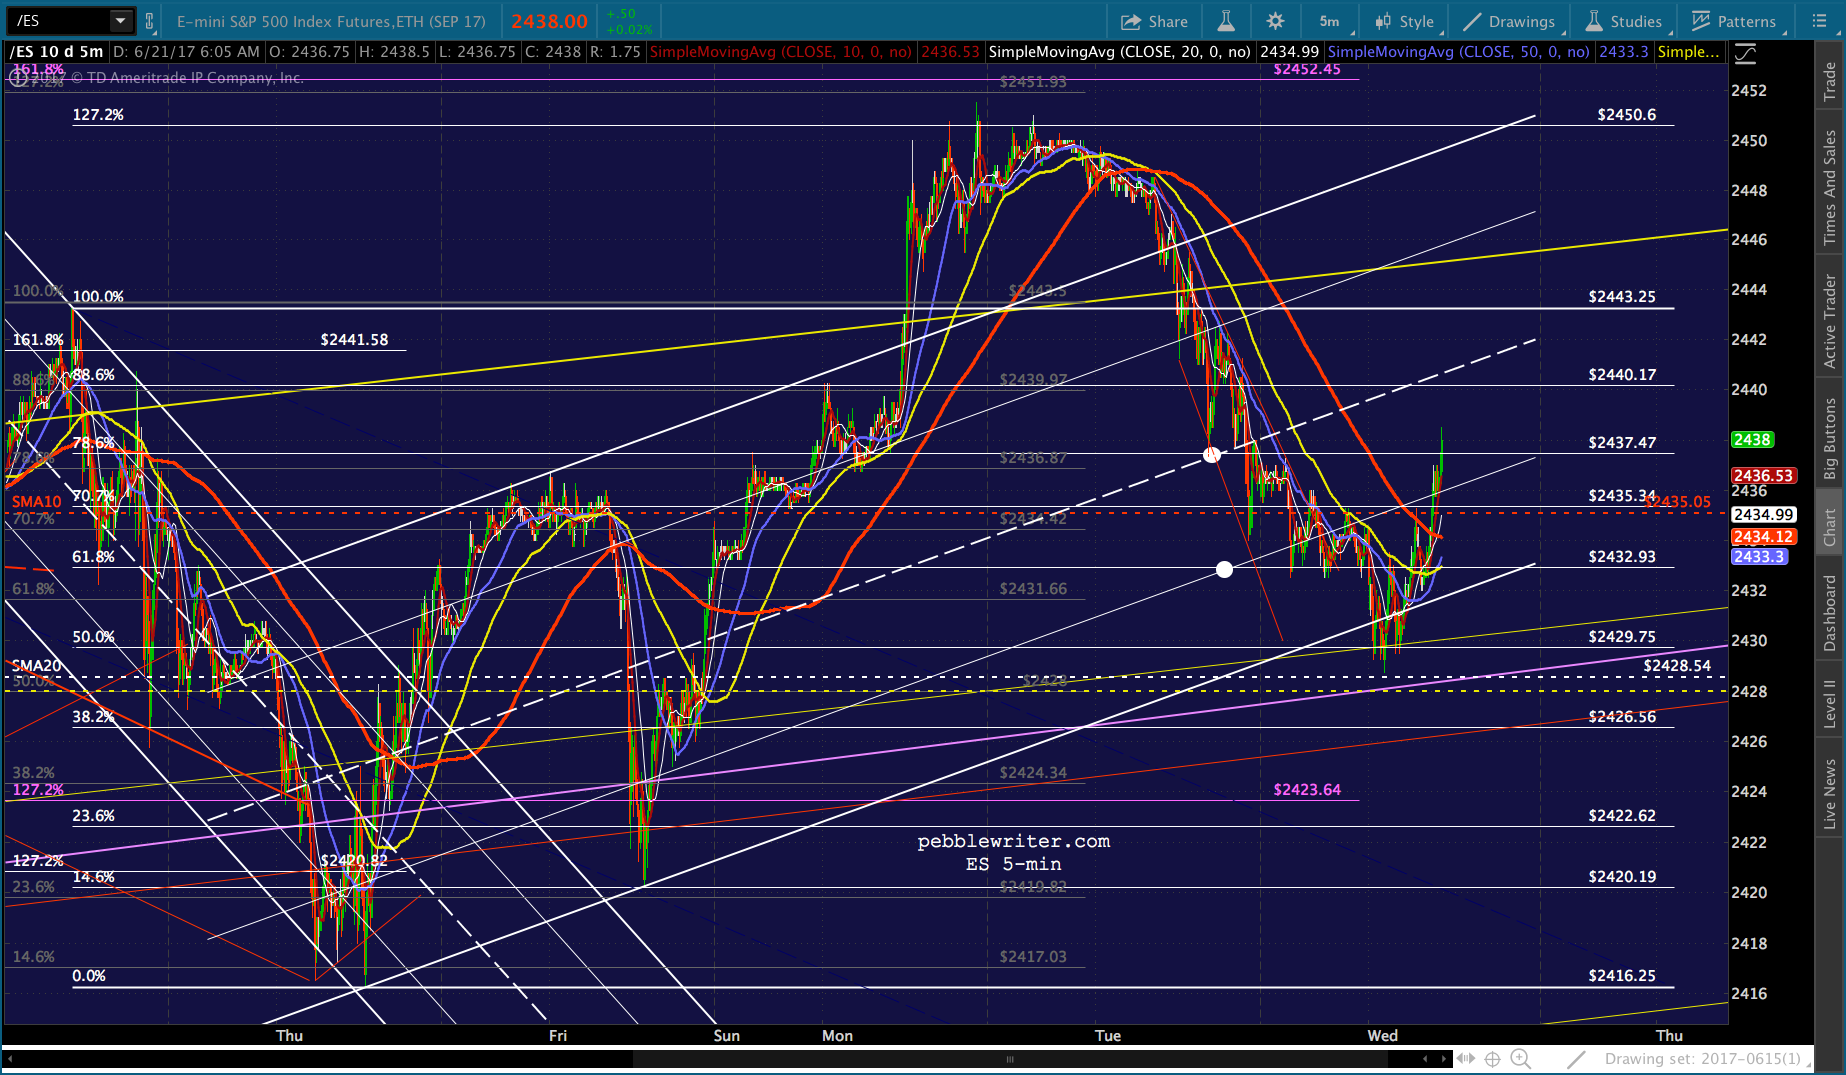
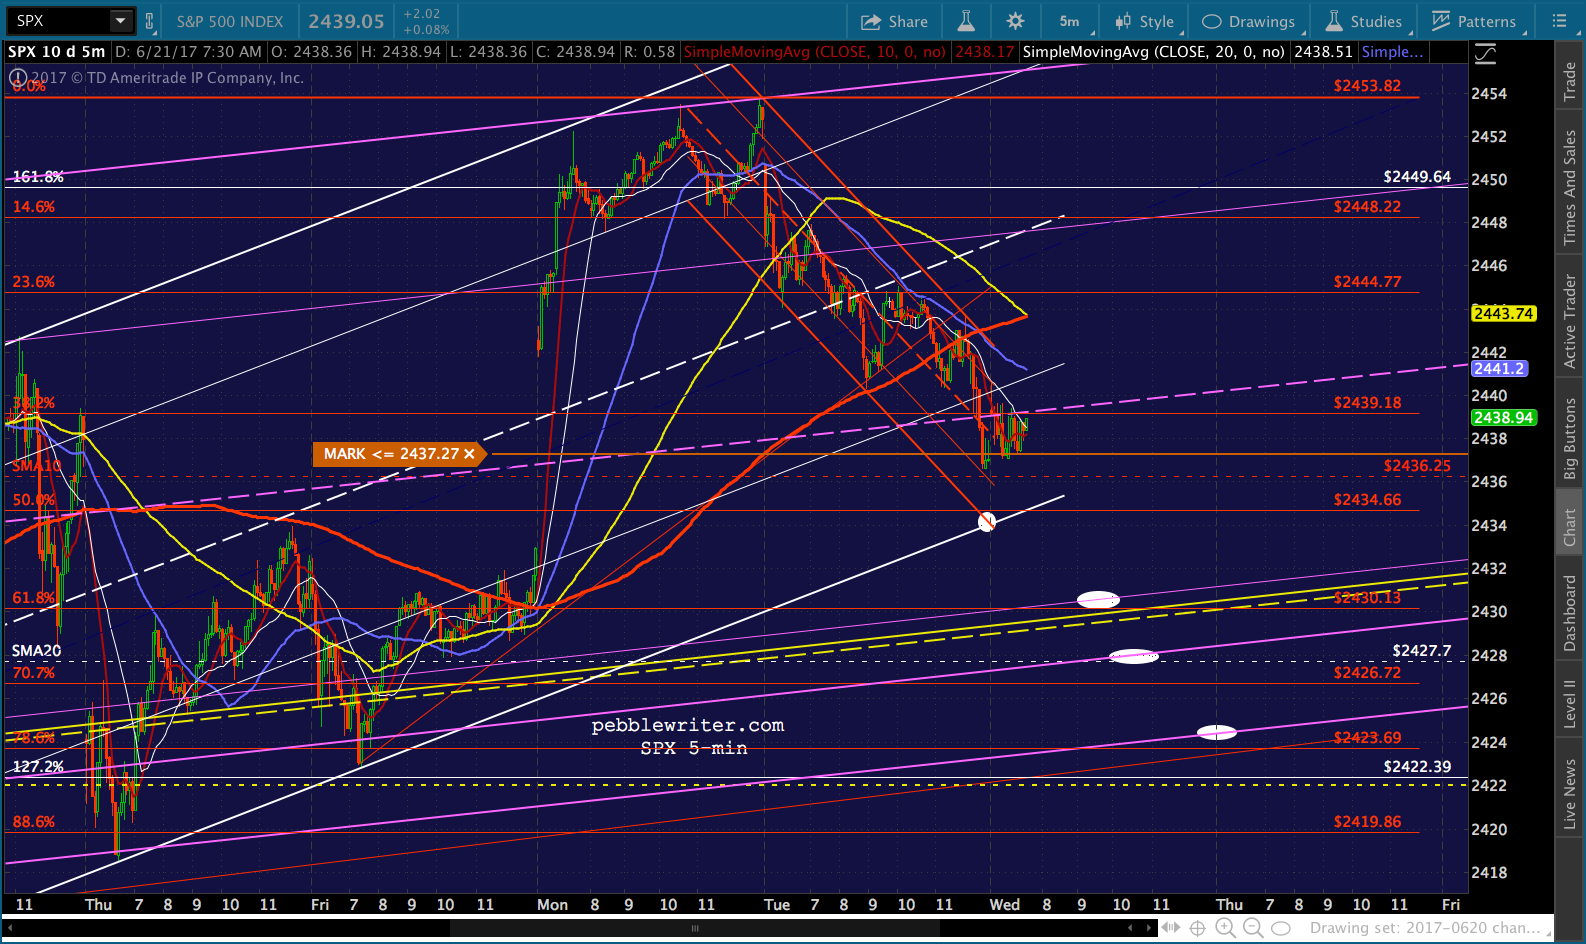
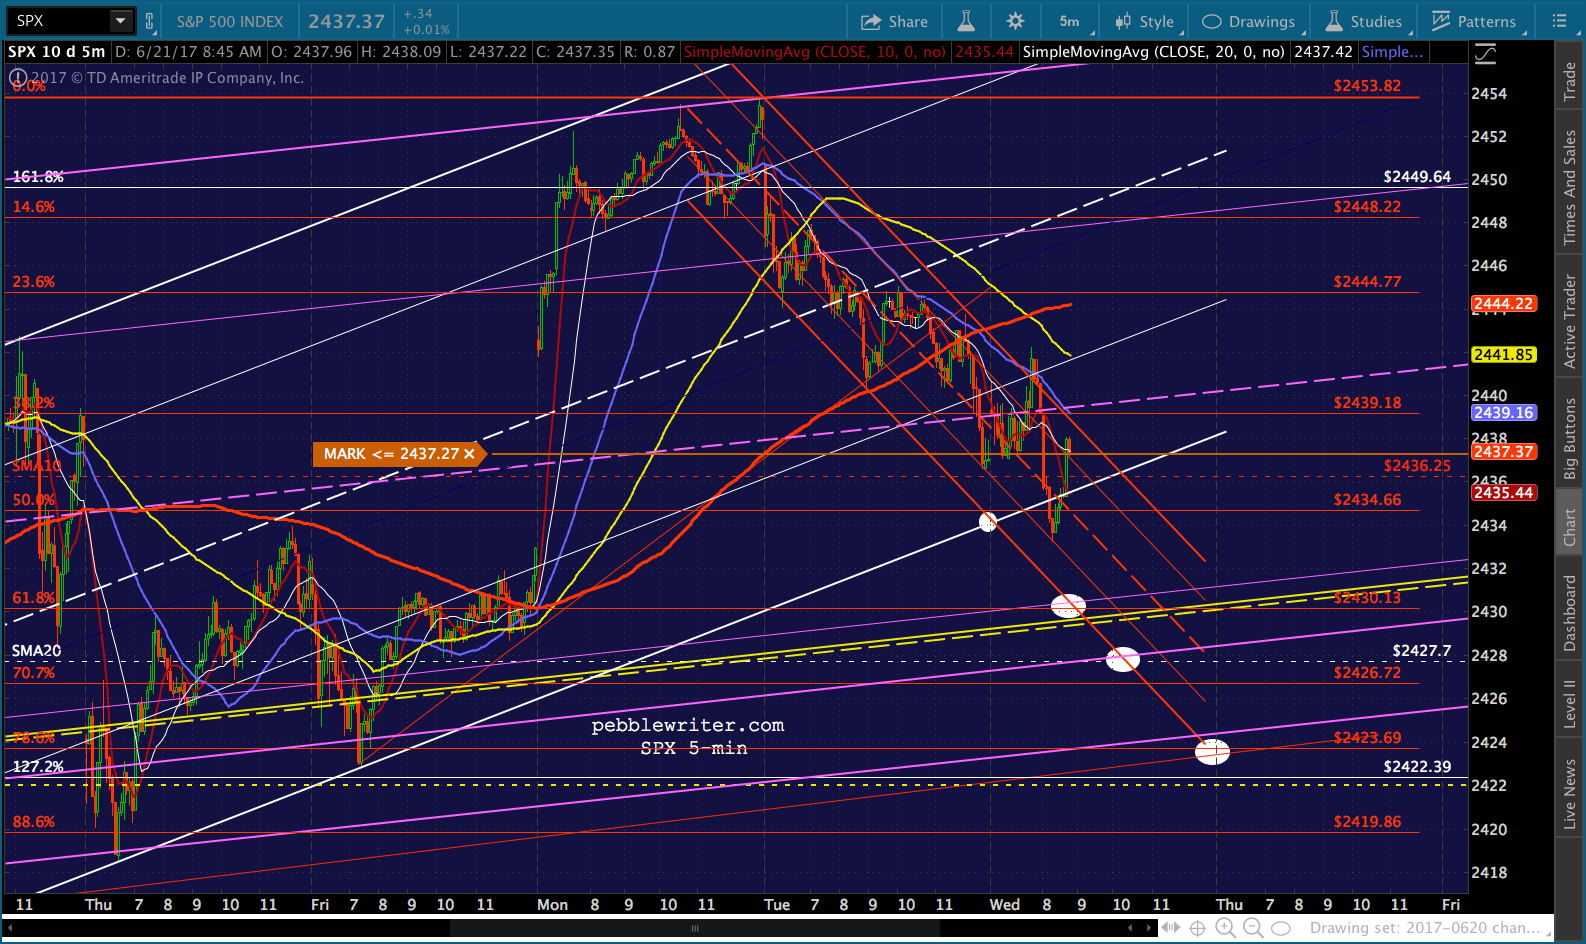
    Though, if the white channel doesn’t hold, there is another one (shown in purple below) that would work just as well.  The only problem is it offers multiple downside targets, so things could get messy.ES is back above its SMA10.
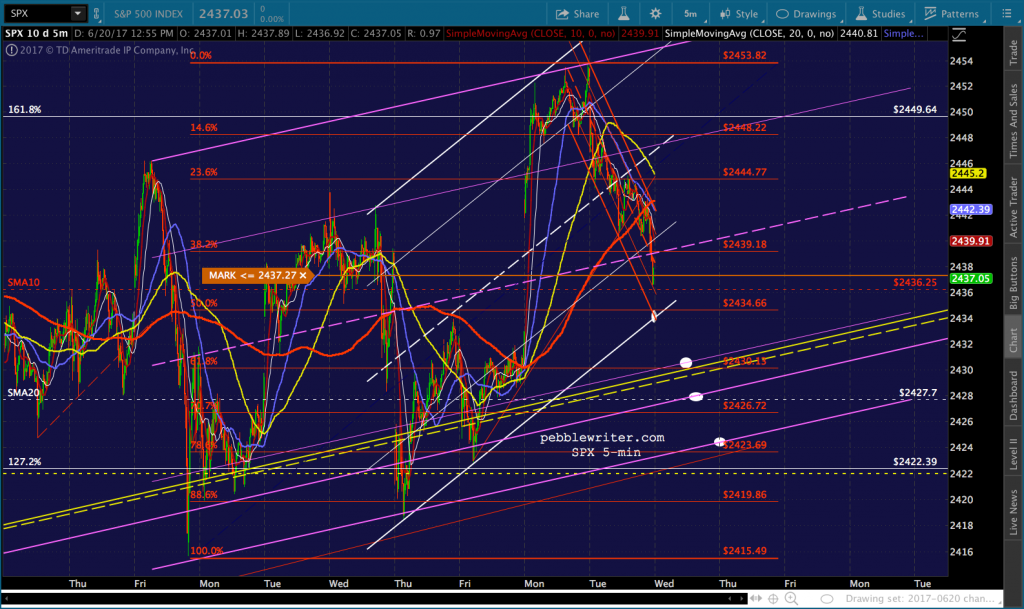
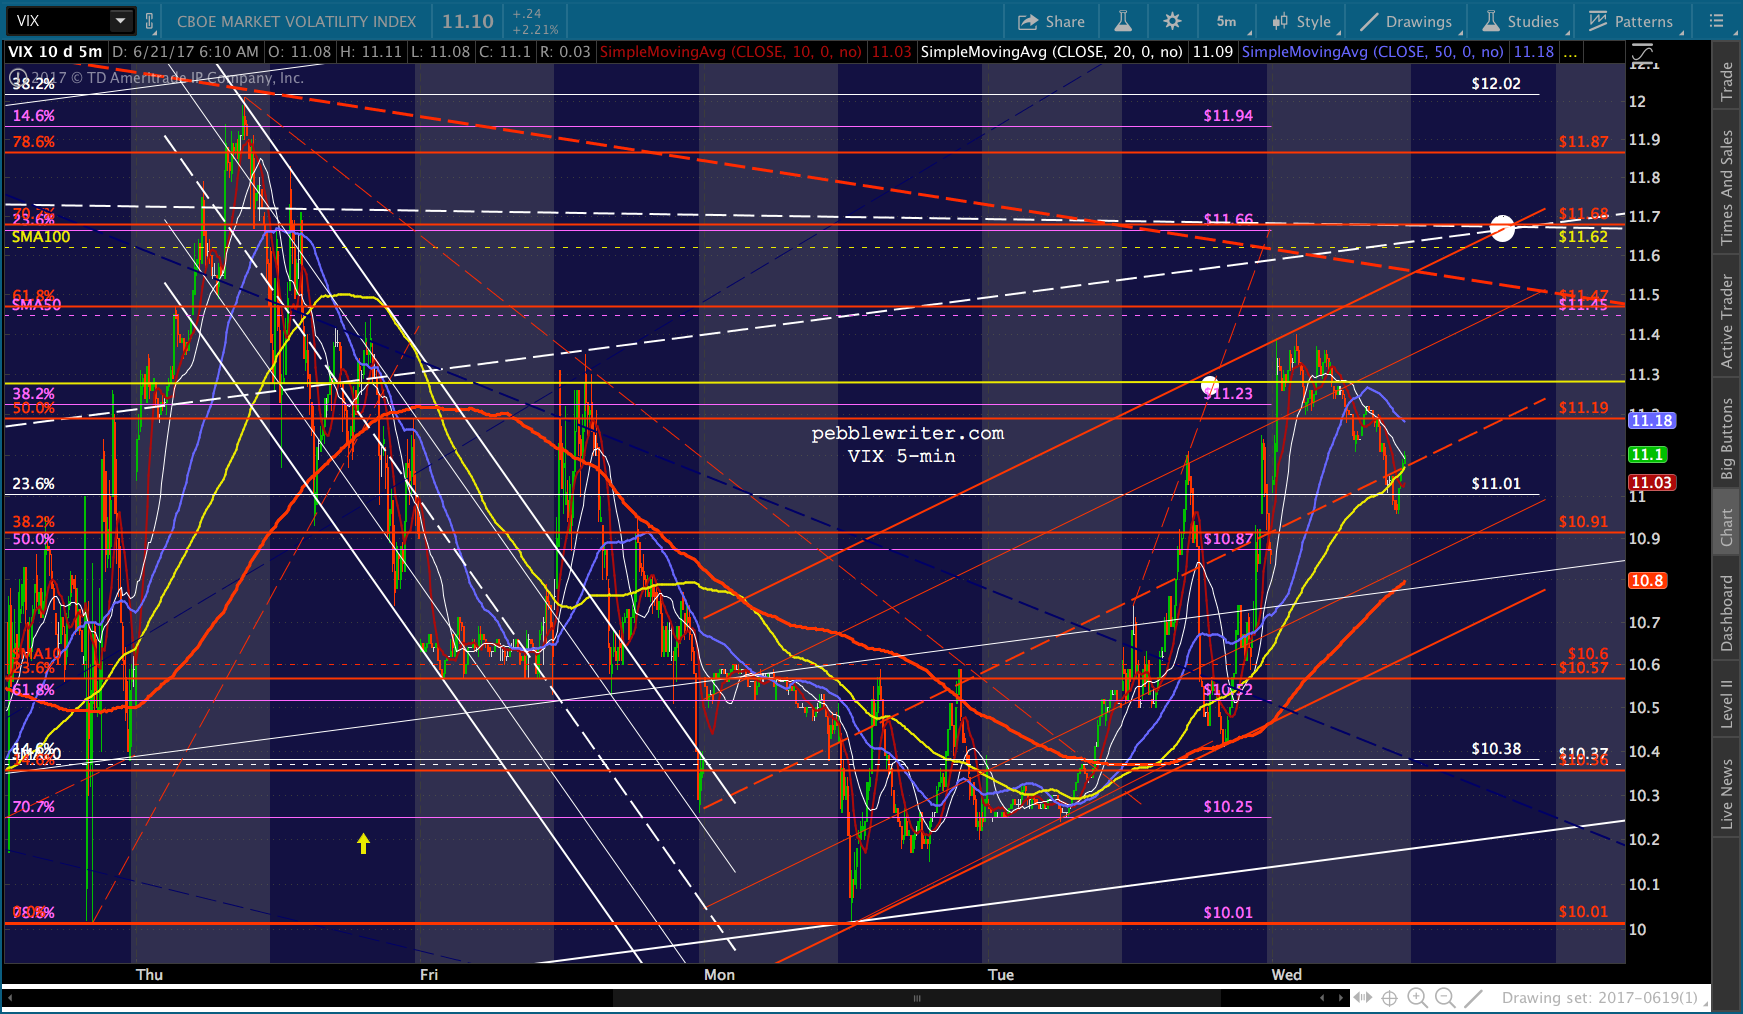
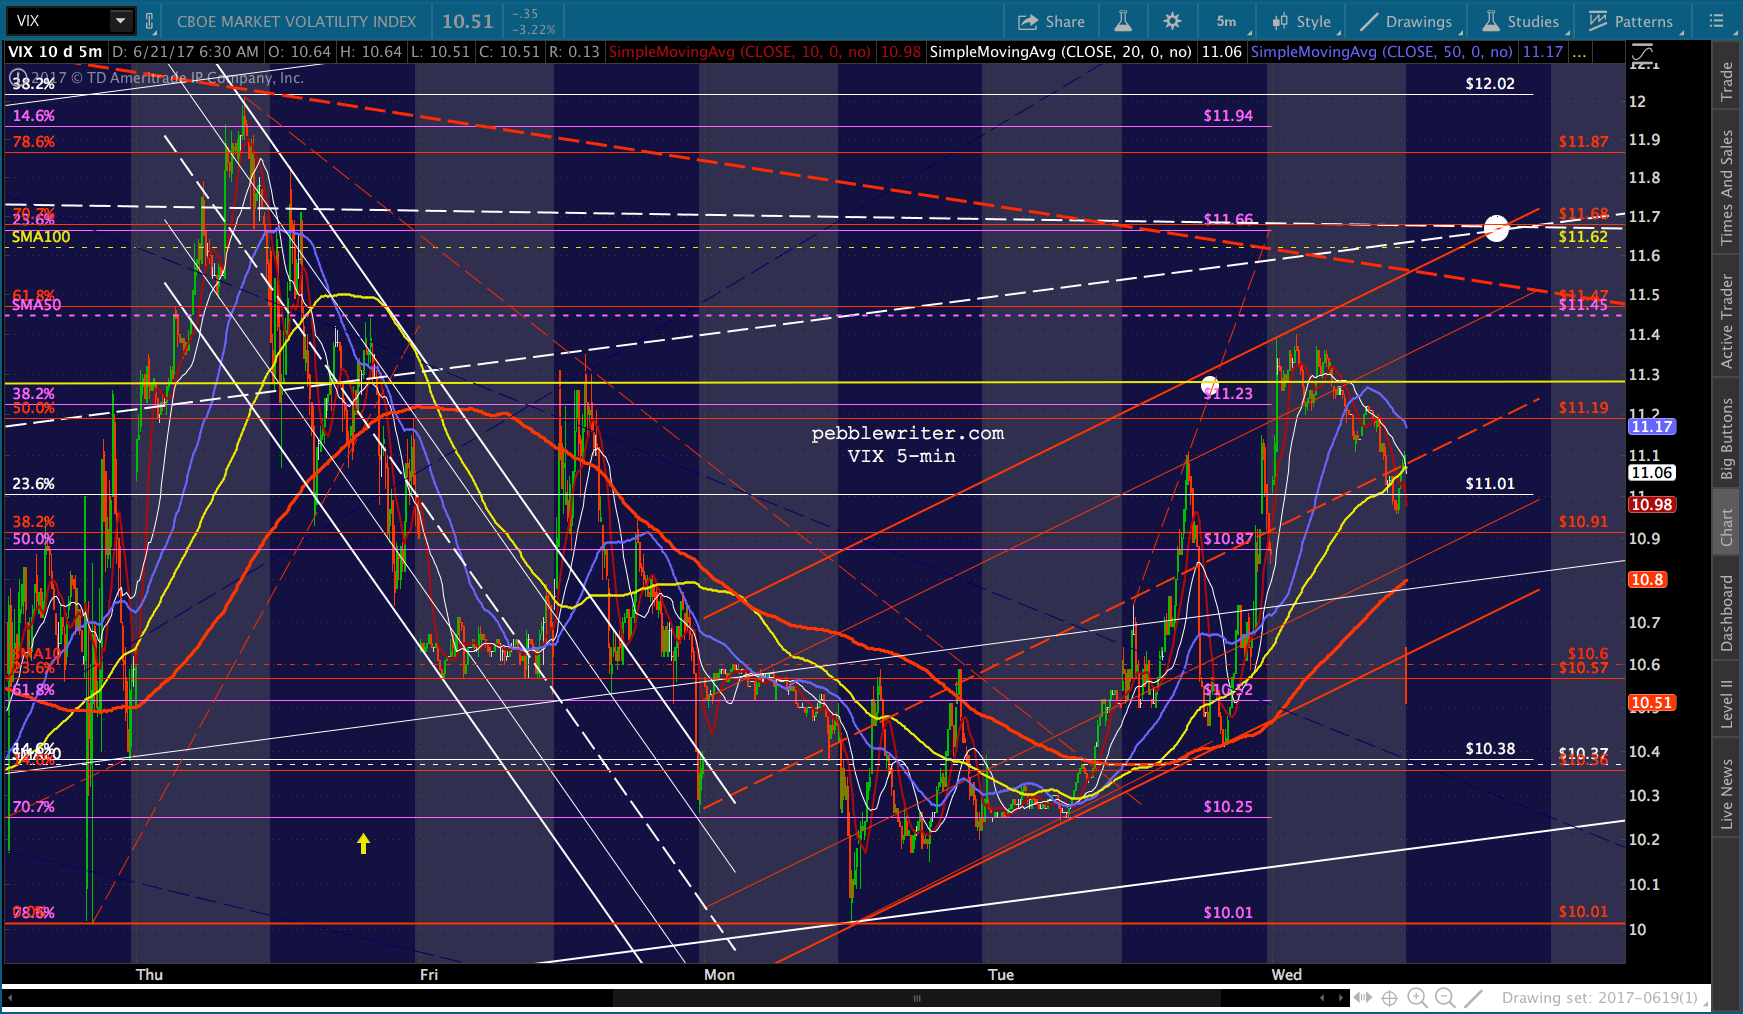
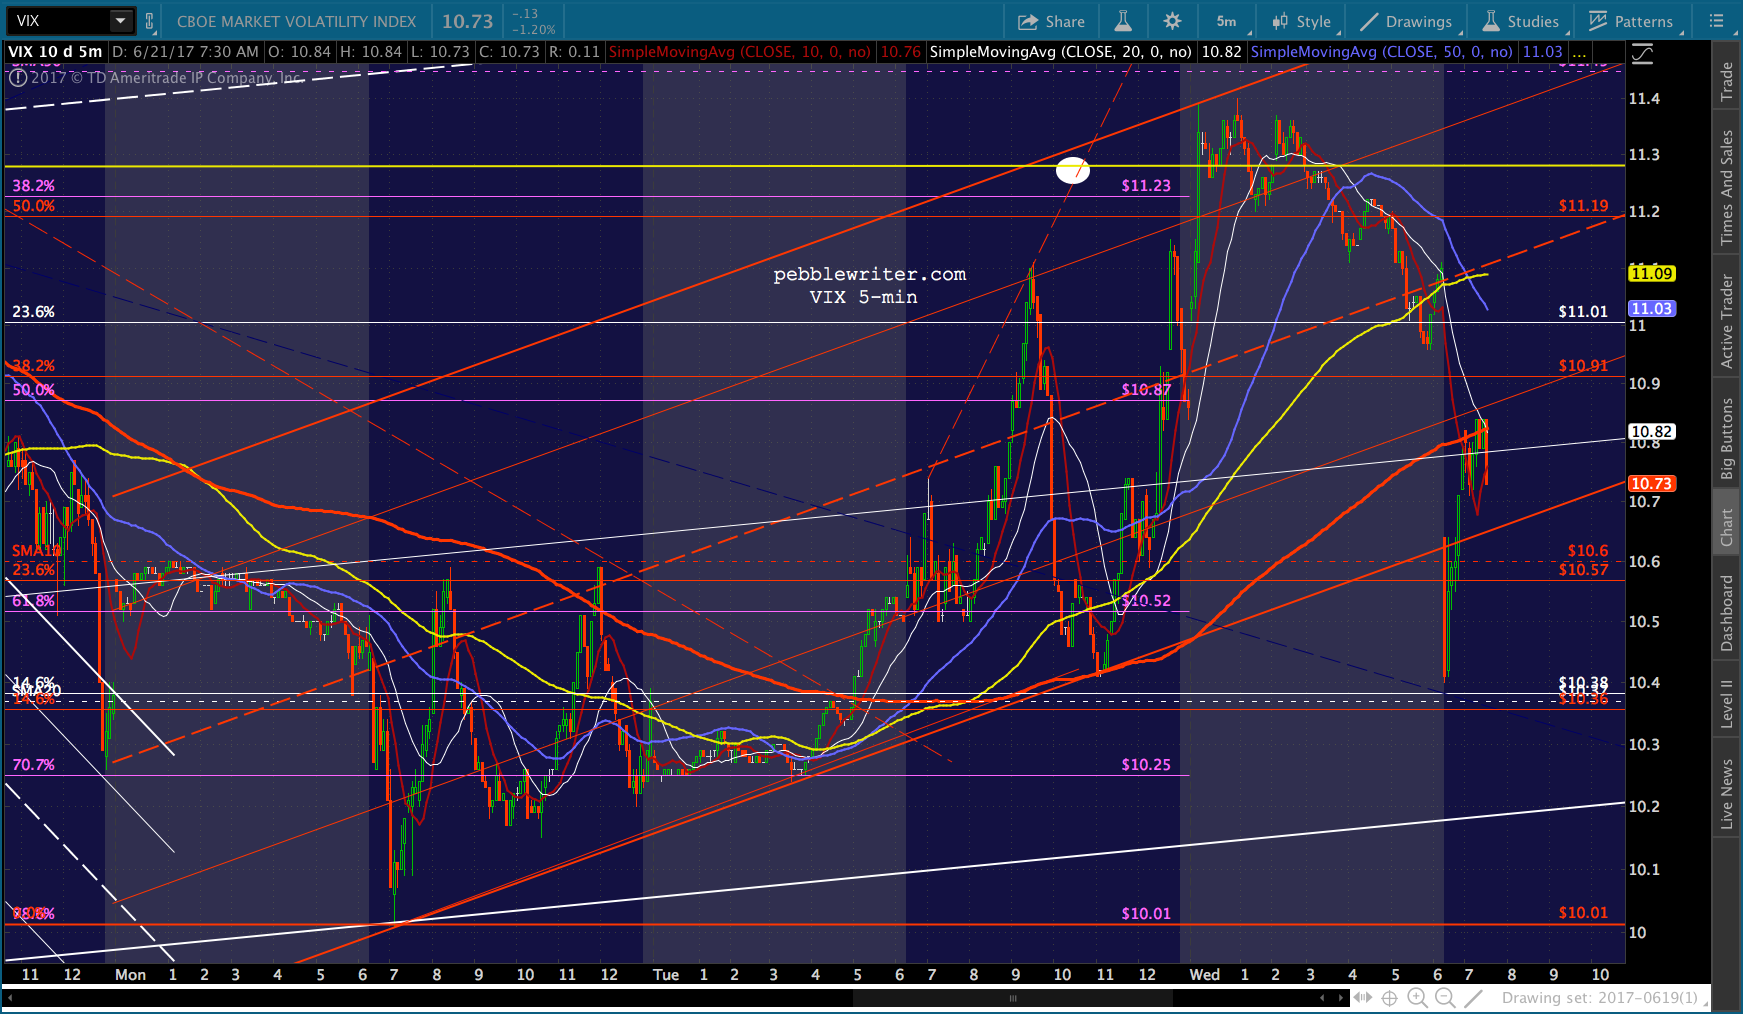
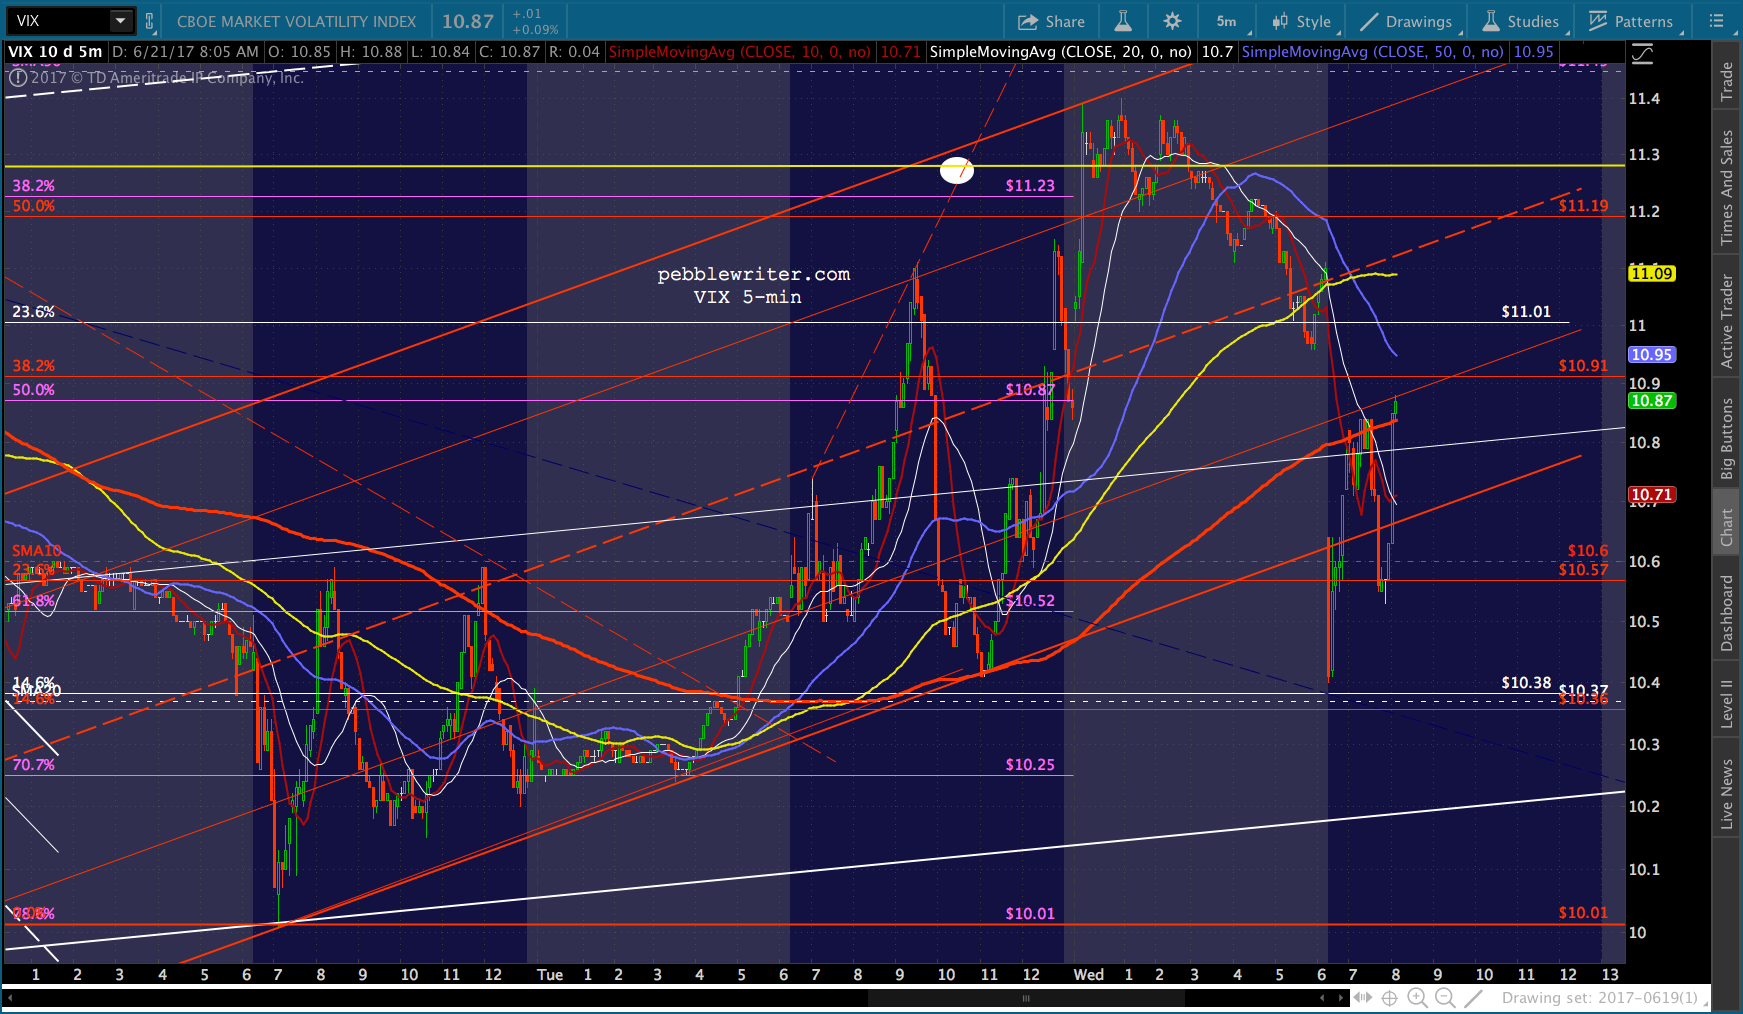
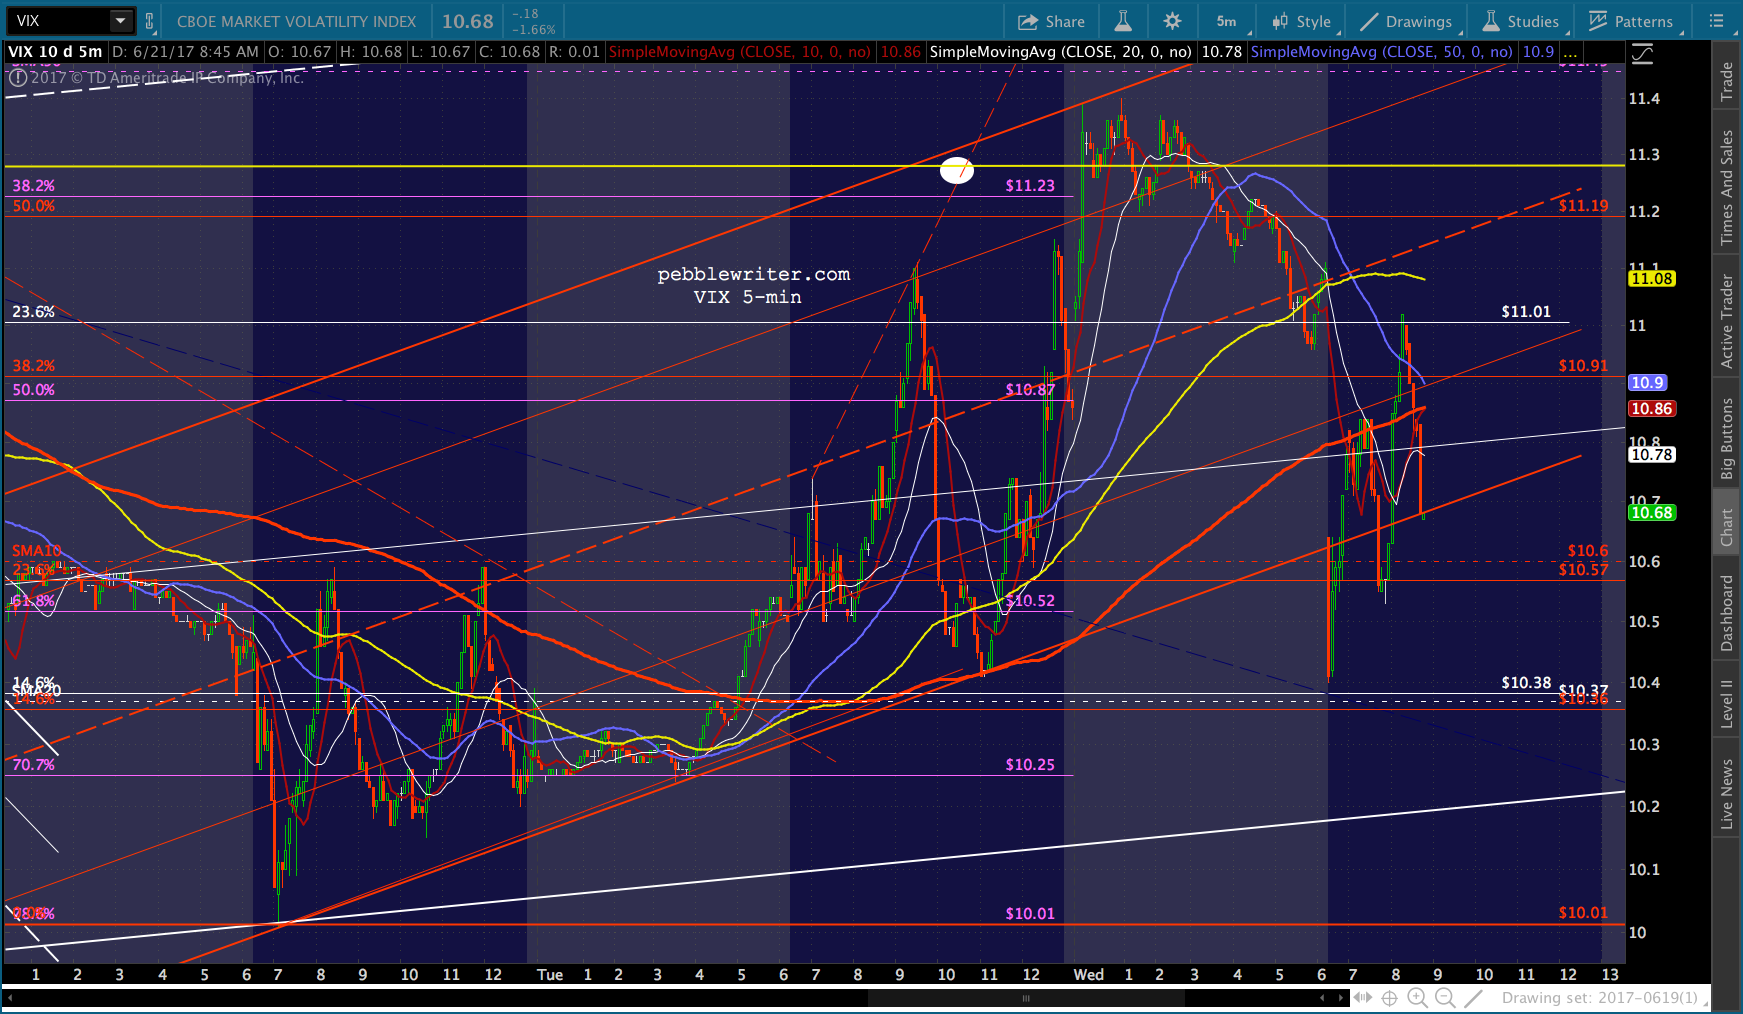
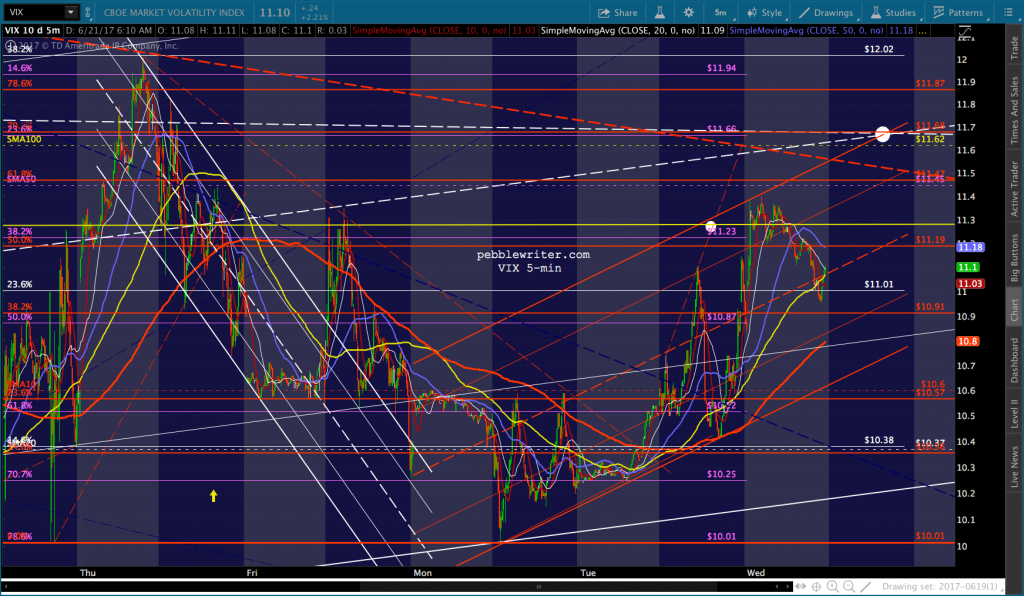
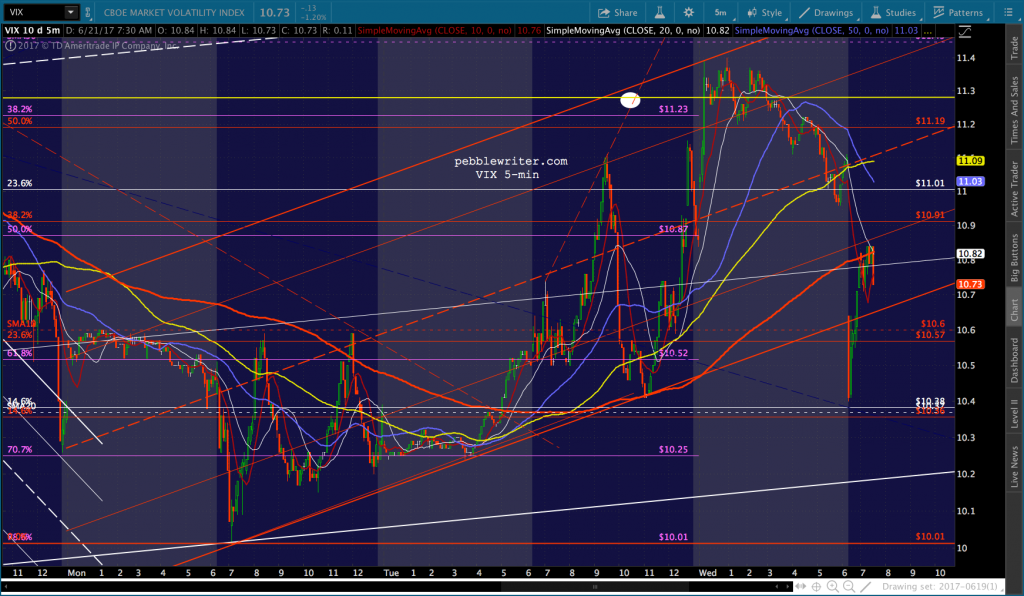
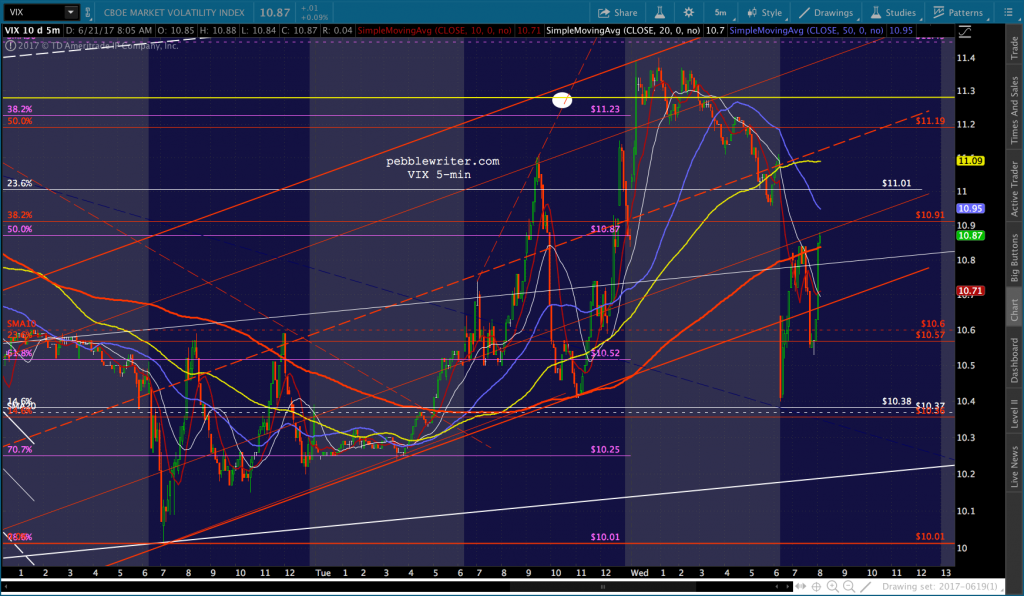
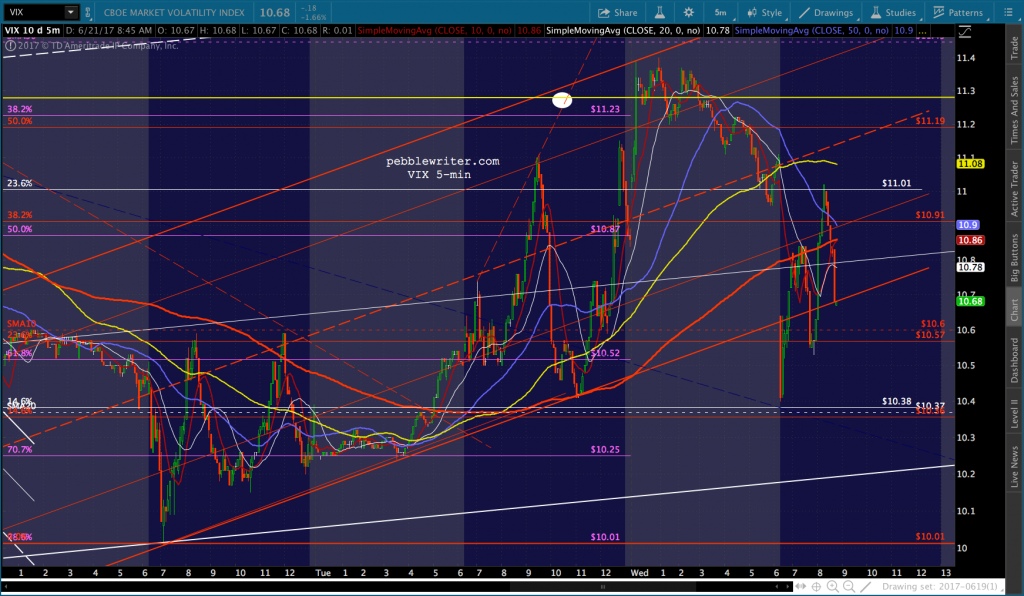
    VIX has enough space on the upside to effect at least a small drop before running into the yellow channel bottom.  If a larger backtest is desired, it would even run up to 11.7 without upsetting things too much.But, I would expect SPX’s yellow channel top to bend but not break.  It would be worth starting out short just in case 2434 doesn’t hold.  But, keep those stops tight just in case.
    UPDATE:  9:32 AM

    A good entry point…But, sheesh, look at VIX — pretty unbelievable.UPDATE:  10:32 AM
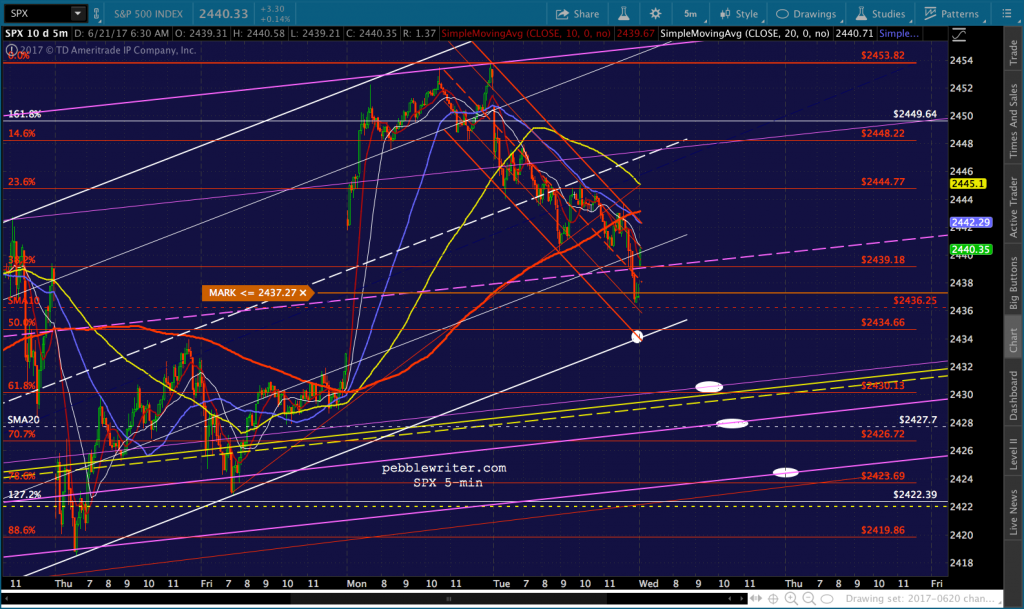
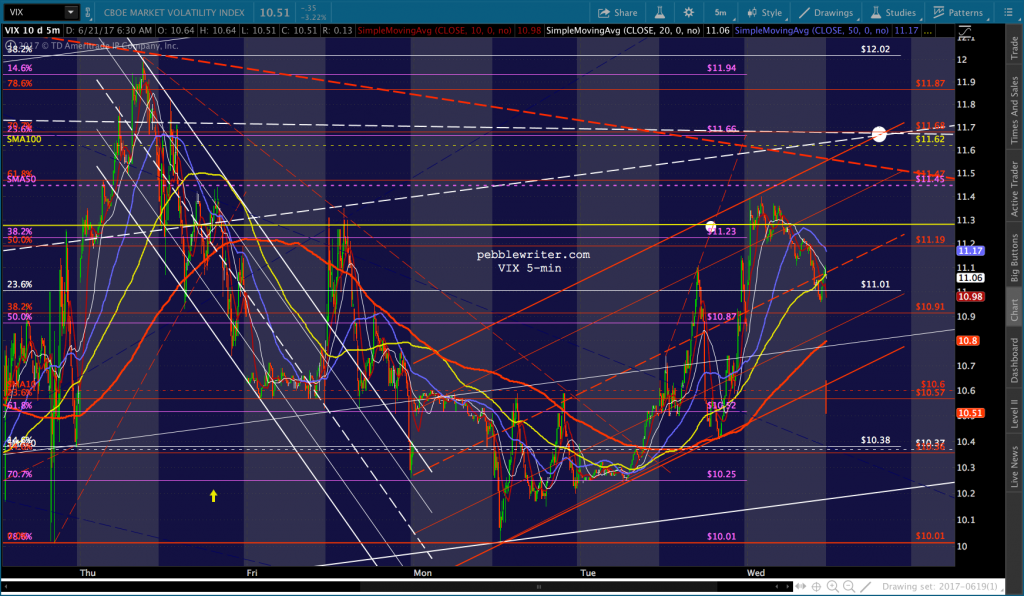
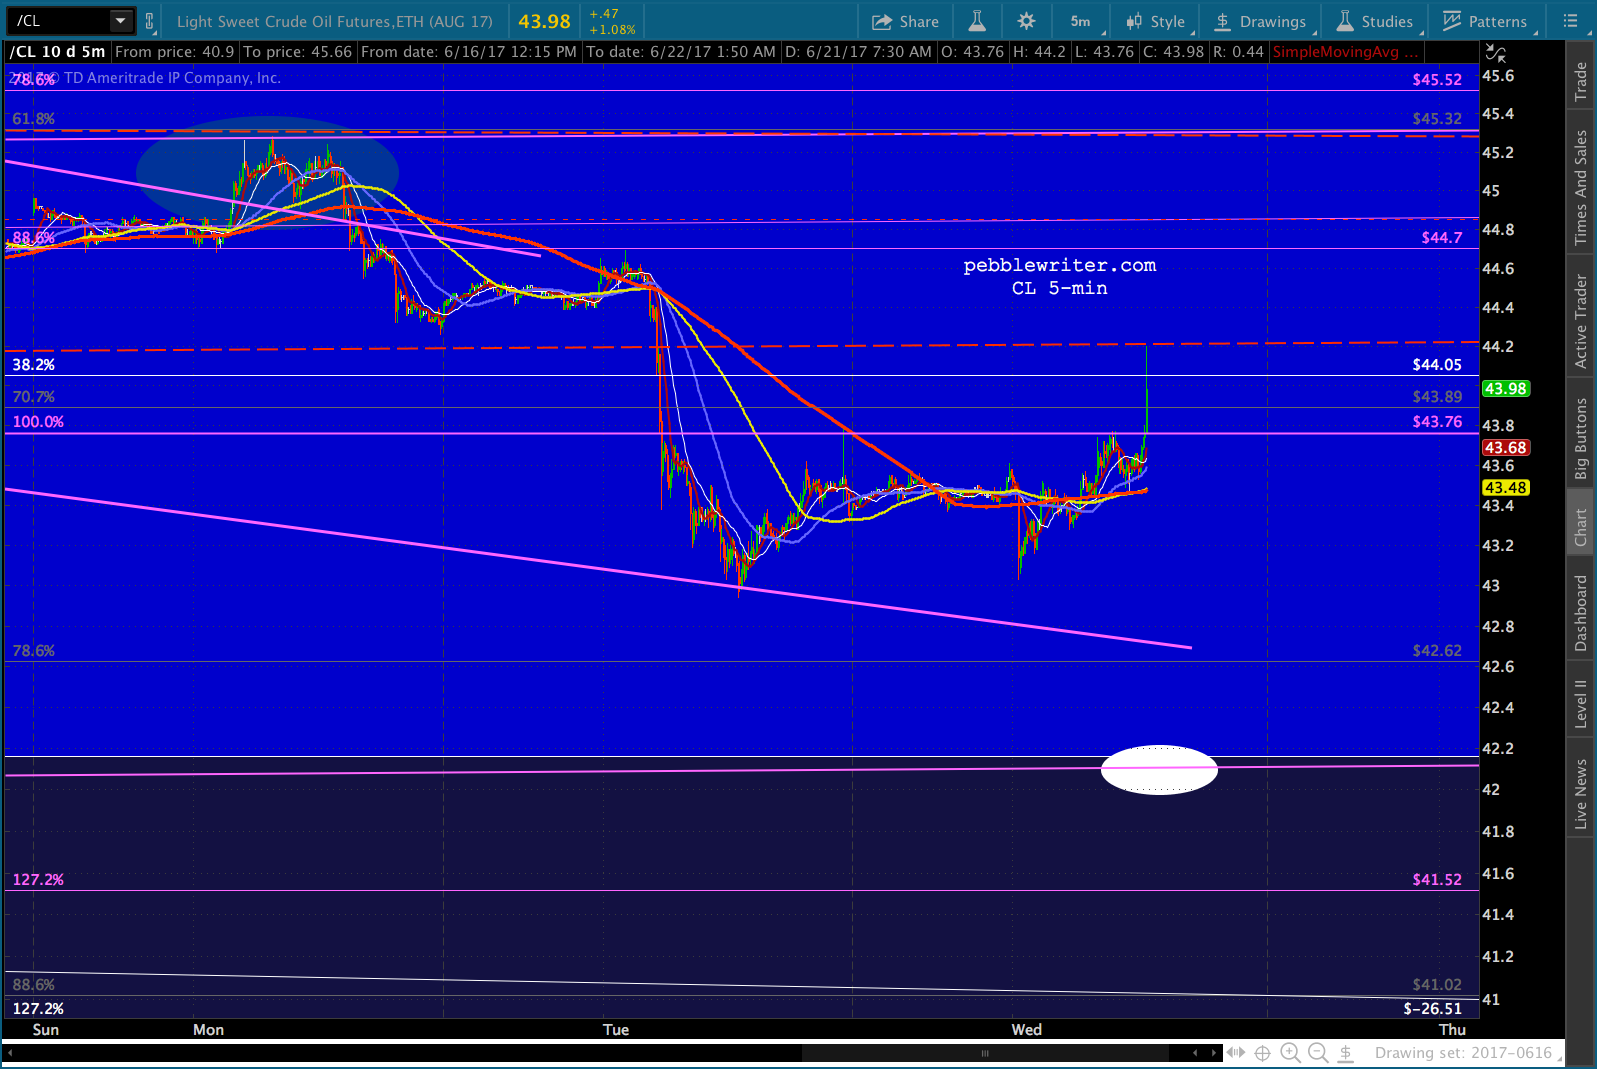
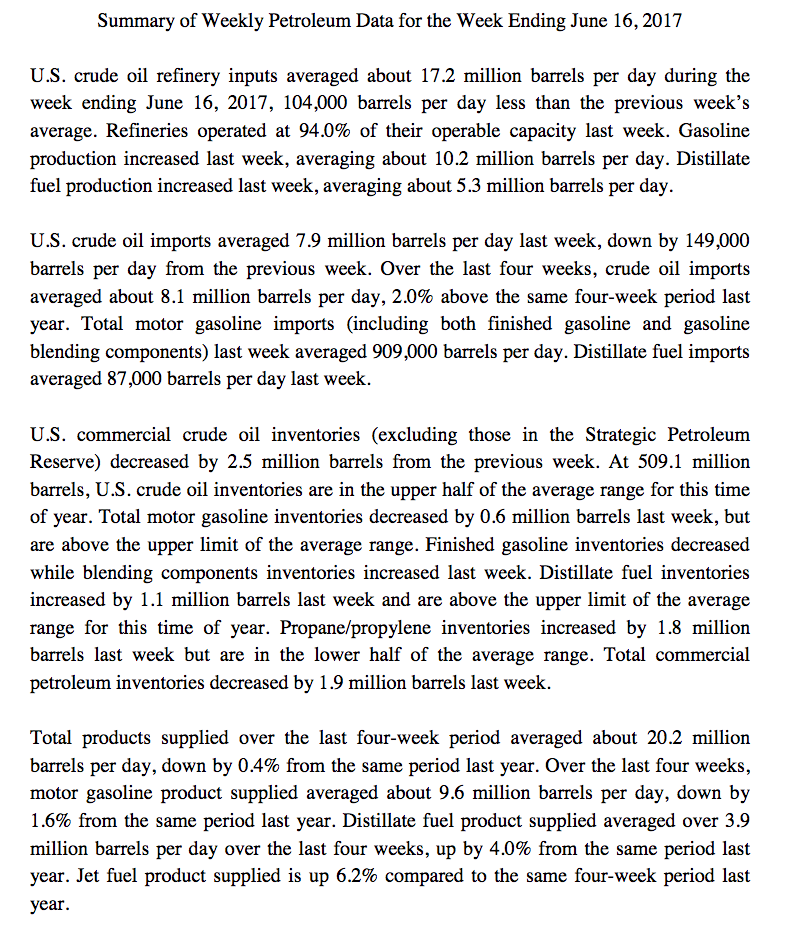
    The report was mildly positive, and CL got a little bounce up to the neckline, pushing SPX slightly higher.  We’ll see if it sticks.  This would be a whole lot cleaner if they would just let SPX tag at least the SMA10 and CL the channel bottom! VIX isn’t waiting around.  It’s sliding, which is helping to prop up SPX.  Watch for it to toggle around the SMA10, depending on what signal is desired.The EIA report…at -2.5MM barrels, not quite as positive as the API at -2.72.  Gasoline showed a 600K draw versus API’s 346K build.
    UPDATE:  11:12 AM

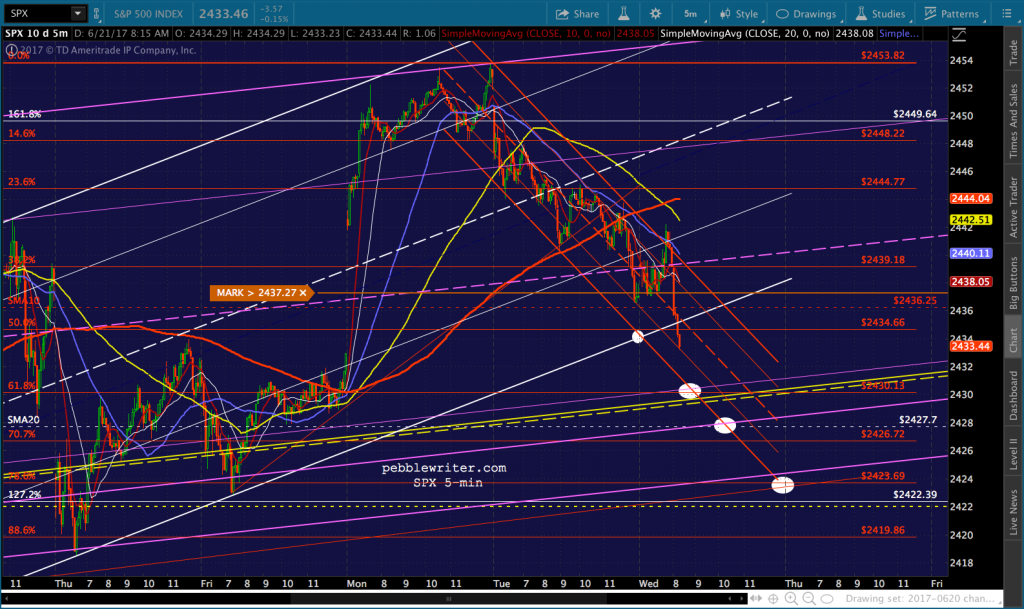
    Better late than never, I suppose.  We’ll call this the channel and SMA10 tag.  Decent possibility that SPX will bounce, though CL still has downside potential to 42.11 — meaning SPX isn’t done yet.  At the very least, tighten up stops here. My preferred target is 2430 at 11:40ish.  But, if CL takes its time, inching lower and lower until 42.11, it could spook SPX into a bigger drop.  The best bet would have been a 3-second spike lower and recovery like we see in VIX all the time.  Oh, well…I don’t know how SPX will be when CL turns, but that’s where I’d want to cover.  Ideally, it’ll be at CL 42.11.  My guess is that translates into SPX 2430 with some aggressive, offsetting VIX smashing, maybe even a USDJPY bounce.
    UPDATE:  11:42 AM

    SPX is pushing back above the white channel bottom and backtesting the SMA10.  I’d cover on any move back through the SMA10, but I’d want to be short below it. UPDATE:  11:49 AM
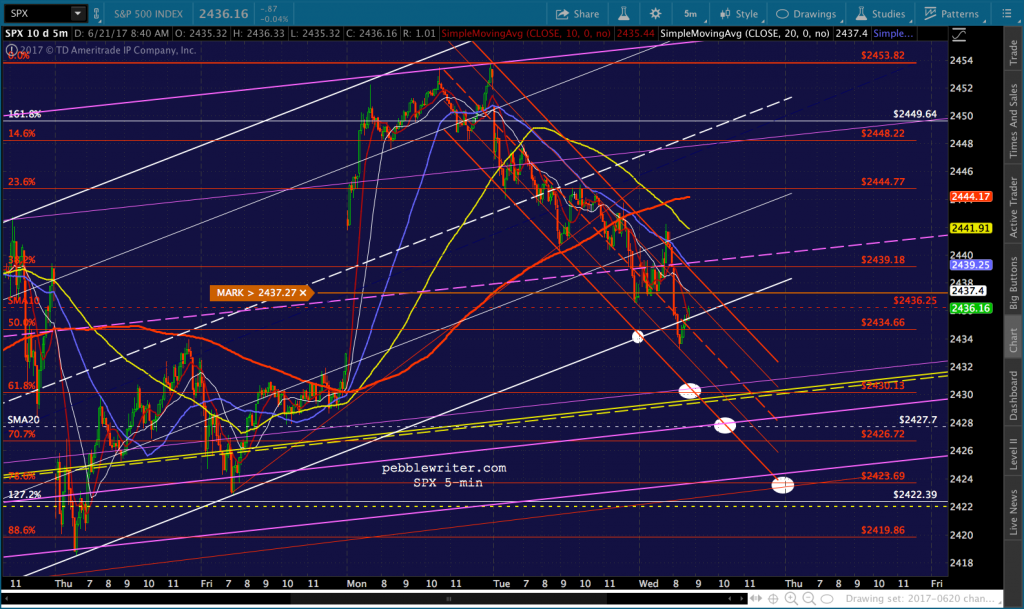
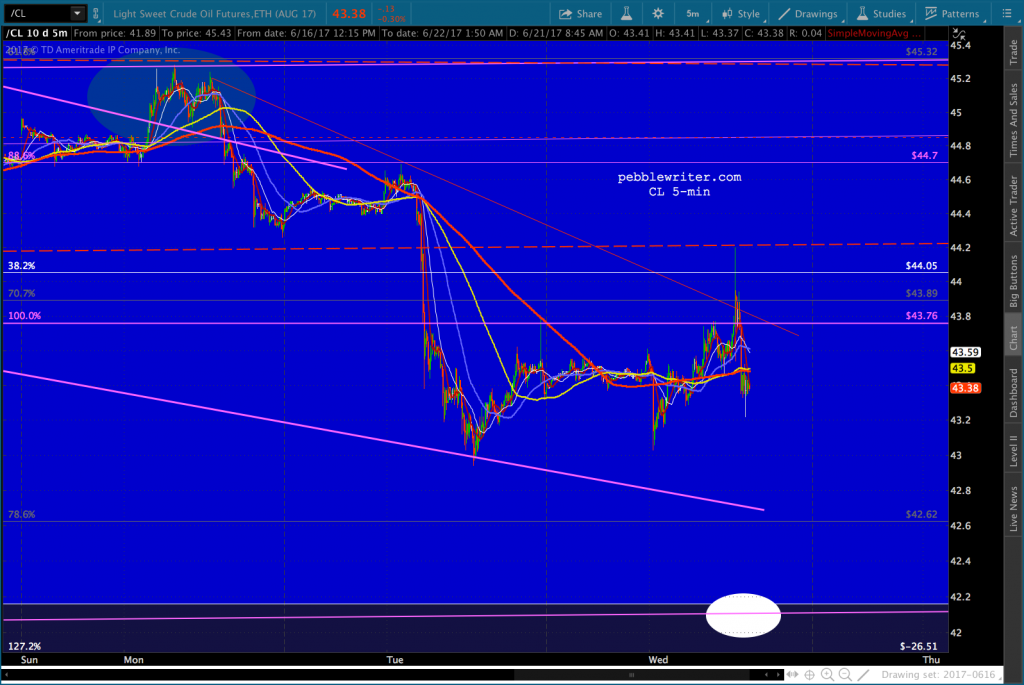
    VIX just tumbled to the red channel bottom, sending SPX back above its SMA10.  This should give CL plenty of room to drop to 42.11 if it’s going to without creating a problem for stocks — especially if VIX drops in the process.

    As I mentioned before, I’m going to take off now.  I think things are pretty well set up for the remainder of the day.  I’d look to go long on CL when it bottoms out, should be a nice trade.  Just know that it’s a funky place Fib-wise, so the turn might be messy.  Use stops and good common sense.  And, watch USDJPY and VIX for corroborating signals.
     *  *  *

    BTW, I’m going to post until about 11am this morning, then take off the rest of the day.  I’ve contracted whatever my daughter has, and am pretty under the weather.

  • Update on Oil: Jun 20, 2017

    Last Thursday we noted that WTI was approaching an important line in the sand, the neckline of a Head & Shoulders Pattern that could spell real trouble for oil prices.  From Oil’s Dangerous Game:

    So, it’s no surprise that equities are panicking just a little this morning, as CL is pennies away from completing a Head and Shoulders Pattern which targets 31.55.  I understand why it’s necessary.  But, equities are not happy – not one bit.

    Last night, CL dropped through that neckline in the midst of a 2.5% dip.  We’ll look at what this means for oil and for stocks.

    continued for members(more…)

  • The Big Picture: Jun 19, 2017

    With the FOMC, BoJ and ECB actions behind us, this seems like a good time to review the big picture.  This morning’s USDJPY, VIX and CL moves are, perhaps, the perfect reminder for how we got here, and where we’re going.

    Note the strong correlation between USDJPY and ES broke down on May 24 when the dollar ran into trouble.  It was a dicey time for stocks, as oil had reached our upside target (yellow arrow) and was heading south.What enabled stocks to break out then, and maintain a floor afterwards?  VIX, which had spiked from 10.50 to 16.30 between May 16-18 — a rare trip back above the long-term yellow channel bottom — was hammered back to single digits on the 24th.And, so, the cycle continues.  When one algo driver falters, another takes its place.  How long can this go on?  Will it always work?  We’ll look at the mechanism, and the repercussions for traders in today’s big picture.  We might even delve into some underlying economics.

    But, first a shout out to members J.H. and T.M. for posing some great questions this past week.  I’m convinced the pebblewriter readership is the smartest, most thoughtful group of investment professionals out there.  These two gentlemen are real students of the markets, and do a great job of keeping me on my toes.

    continued for members(more…)