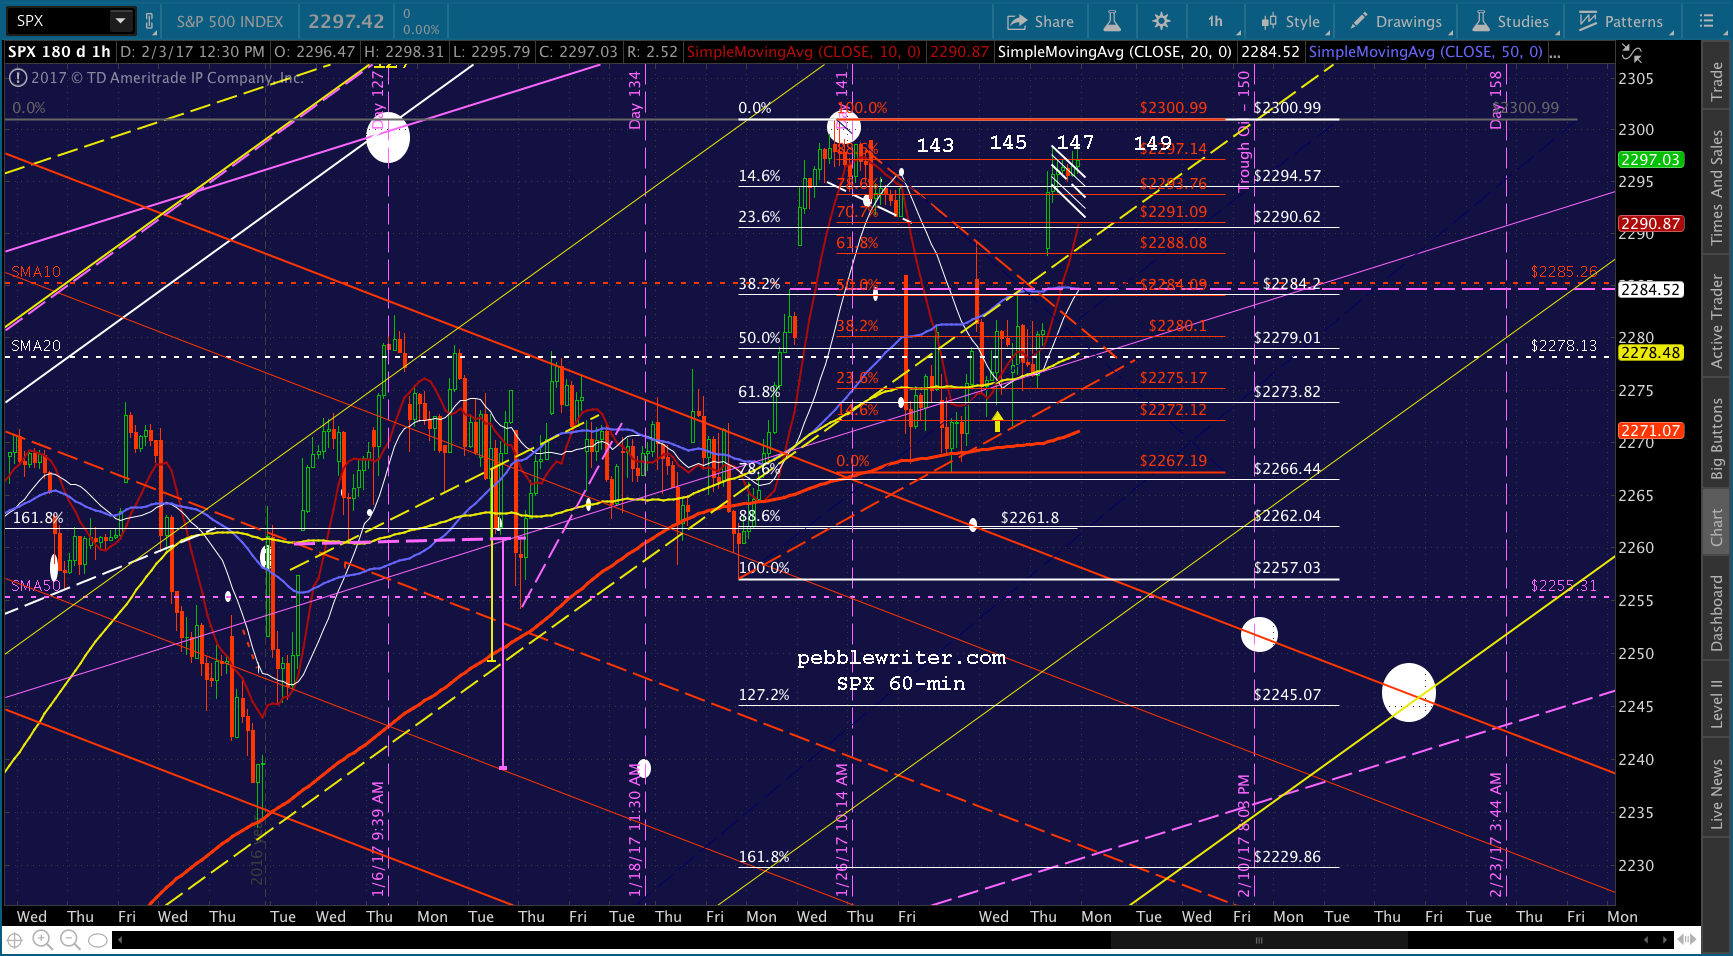
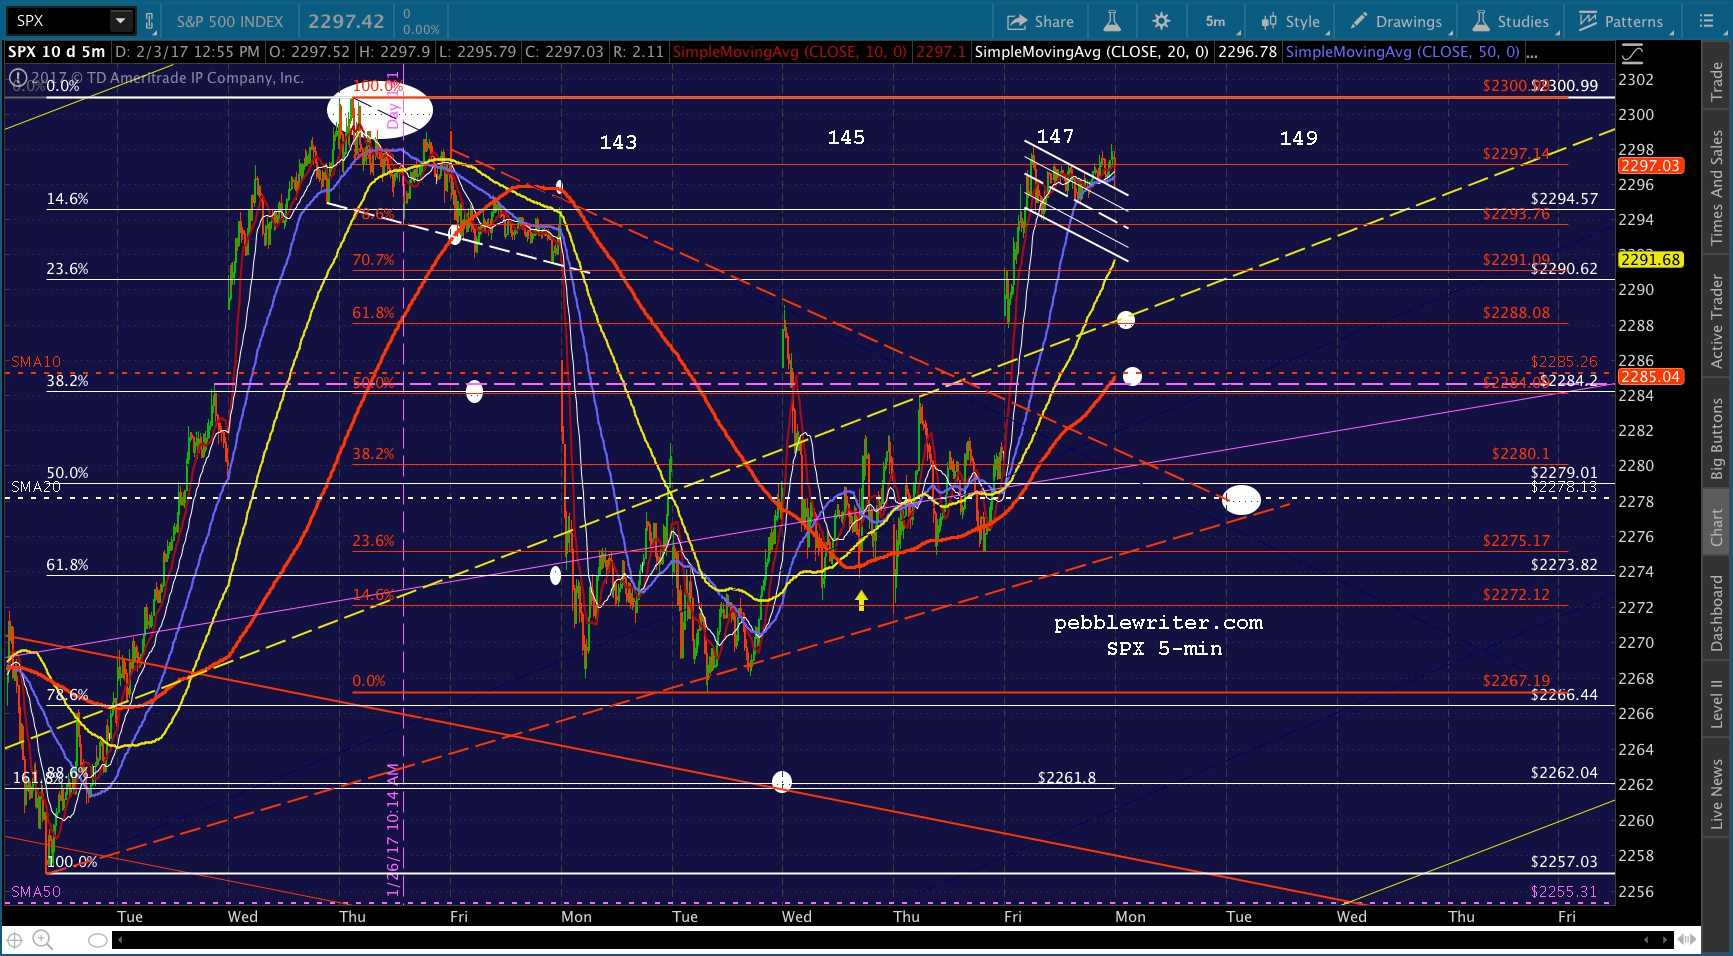
We’ve discussed the ultimate outcome of our analog countless times. It provided higher price targets all along, aeach of which was met or exceeded, even as normal retracements or backtests have been largely prevented.
Given the enormous manipulation going on in oil and VIX, in particular, it must be a little disconcerting to TPTB that they haven’t achieved more of a breakout. Is it a sign of the flagging effectiveness of the manipulation, or is it possible that a meaningful backtest will finally be allowed?
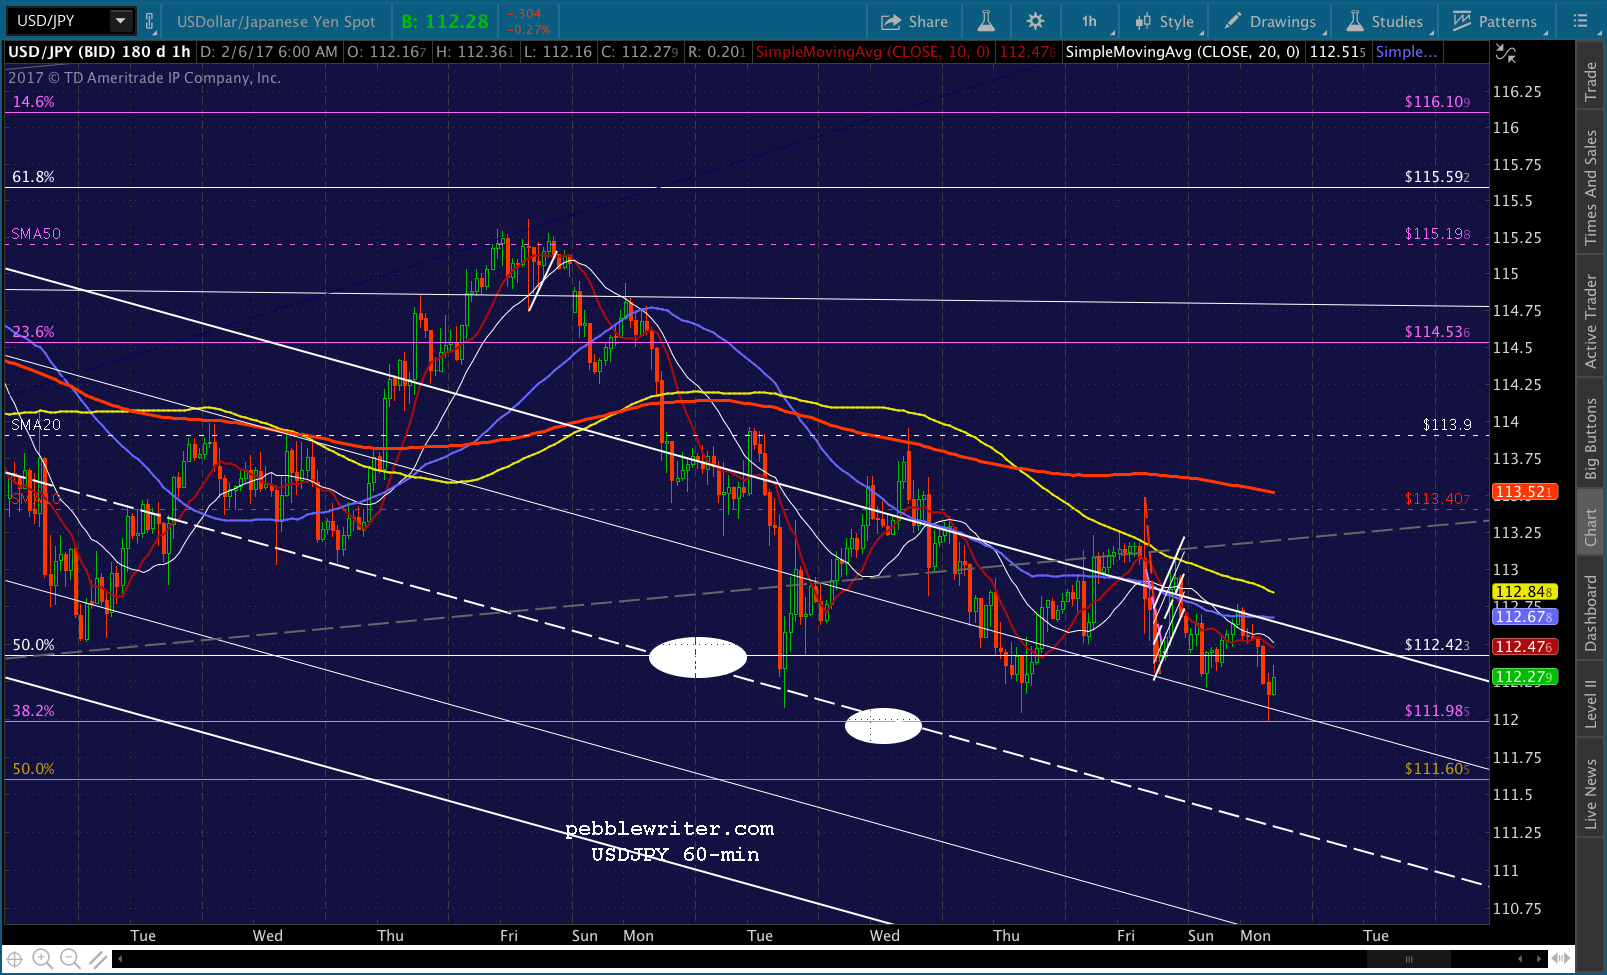
The key might lie with USDJPY, which just tagged our 111.98 target from last week. Better late than never! continued for members…
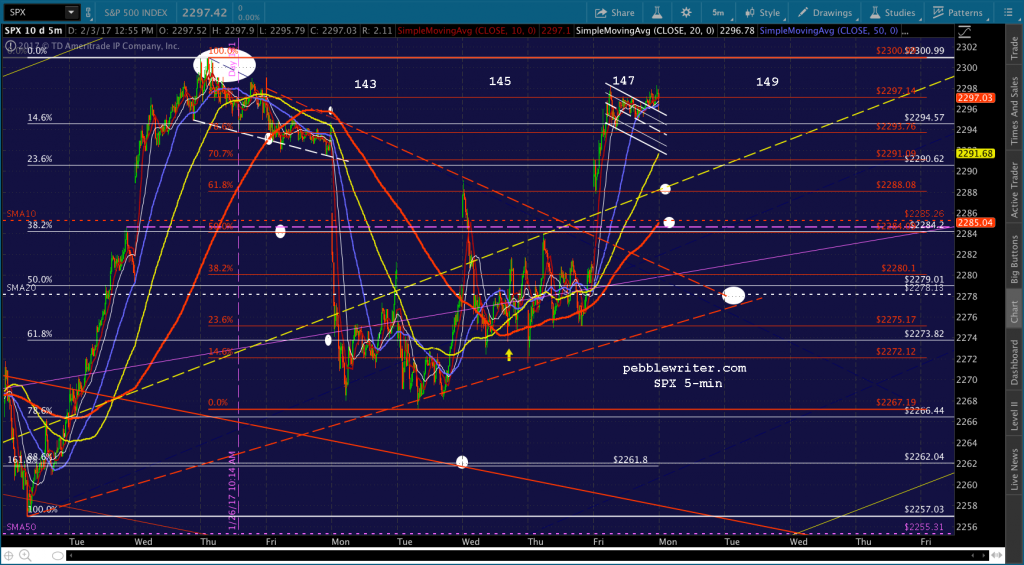
We’ve had breakout after breakout, but the net point gains have been modest.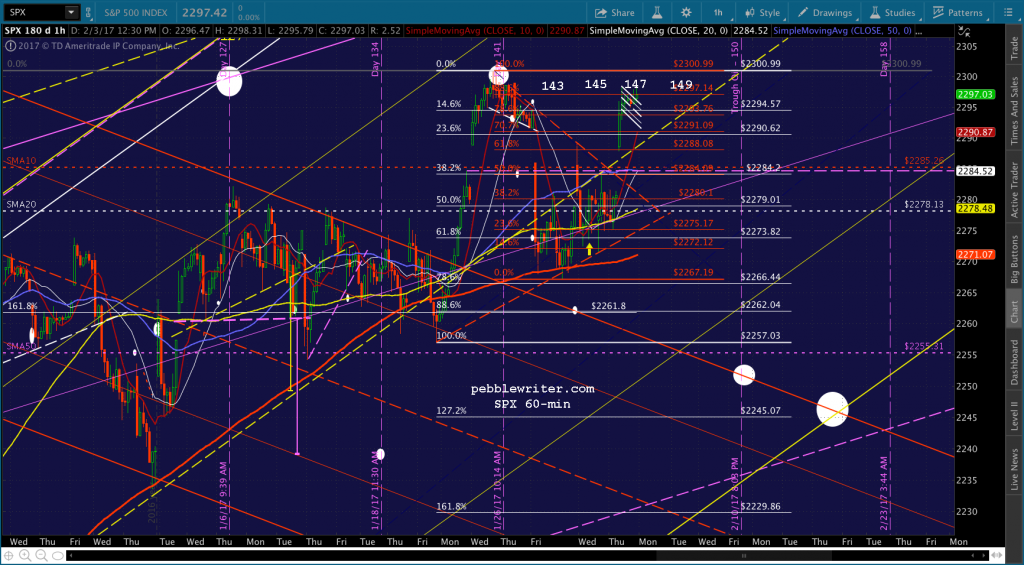
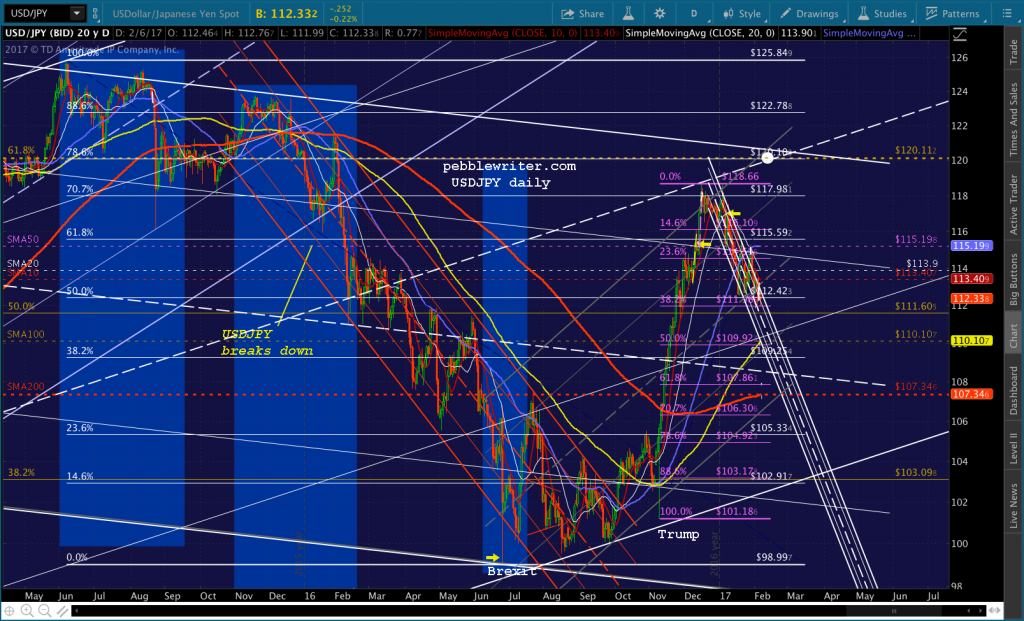
 Part of the reason for the modest returns has been USDJPY,which has been managed steadily lower since mid-December.
  There is certainly plenty of room for it to work lower. 111.985 is only a 38.2% retrace of the post-election rescue operation.
 But, remember, it never quite reached the obvious target of 120.11 — preferring to leave it available for another leg up. I can’t shake the feeling that a rally to 120.11 or slightly above is being held in reserve for either (1) the next time a rescue is needed, or (2) the next important breakout.
 And, that’s where CL comes in. We know that it’s still sitting at twice its Feb 11, 2016 price of 26.05. Unless it starts falling right away, gas prices will come in at around 30-35% YoY higher this month.
 The January CPI numbers coming out on Feb 15, even if massaged extensively, are likely to show a pickup in inflation – which had already tripled (from 0.7% to 2.1%) in the past two years in last month’s report. My guess is at least 2.5%.
 TPTB have a very narrow window within which to take oil prices back down if they wish to avoid a higher headline number for February than in January.
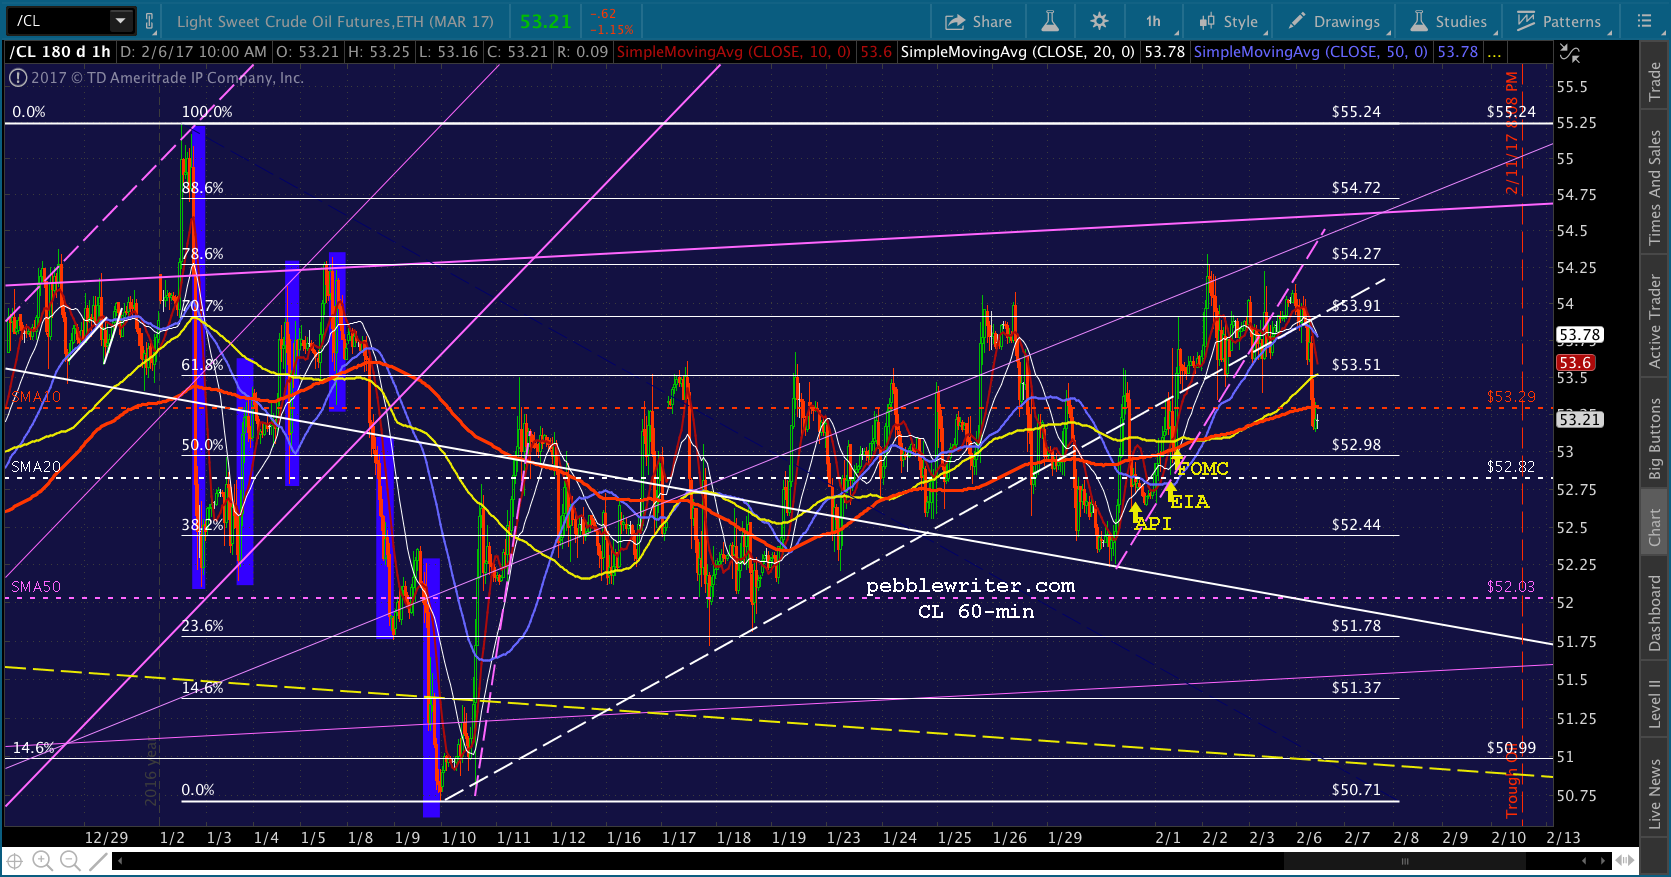
Frankly, I’m surprised it hasn’t happened already. I can only assume the forces working to keep oil elevated since it “broke down” from that rising purple channel on Jan 9 have very deep pockets and are very determined. Or, maybe they’re just amassing huge hedges.
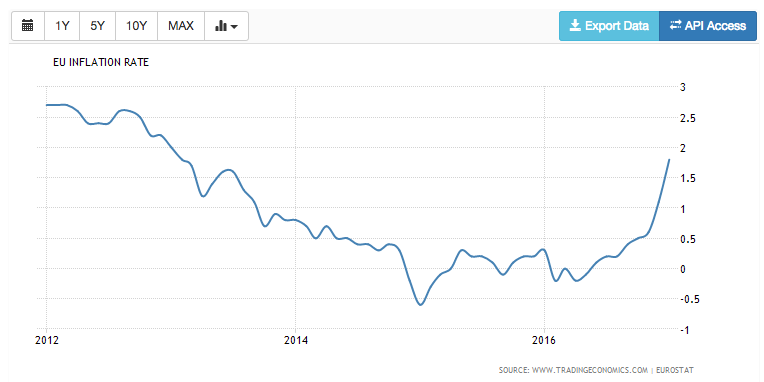
In his remarks this morning, Mario Draghi said that “underlying inflation pressures remain very subdued and are expected to pick up only gradually.” Looking at the charts below, the word “gradually” hardly seems to fit.
Likewise, in its statement last week, the FOMC downplayed the risks of inflation, stating that:
Inflation increased in recent quarters but is still below the Committee’s 2 percent longer-run objective. Market-based measures of inflation compensation remain low; most survey-based measures of longer-term inflation expectations are little changed, on balance.
Again, the CPI charts tell a different story.

Of course, the Fed looks at core inflation, ignoring the contributions of the “too volatile” food and energy categories. Unfortunately, the average Joe doesn’t have the luxury of ignoring these costs, and has to pay actual rent increases instead of owners’ equivalent rent — a phony definition of rent that vastly understates actual inflation.
 Last October, Janet Yellen talked about letting the economy “run hot,” wondering aloud whether a “high pressure economy” could reverse some of the damage done in the GFC. But, in her Jan 19 speech at Stanford, she stated that “allowing the economy to run markedly and persistently hot would be risky and unwise.”
She went on to say it “will not be easy to find a path of rate hikes that can foster strong jobs growth and 2-percent inflation, given the uncertainties of global growth, slow domestic productivity growth, and a change in fiscal policies, among others.”
She left out the part about rising interest rates being a headwind for stock prices, and how keeping inflation in check would require oil prices tanking in the near future — also a major impediment to the market’s ongoing melt-up.
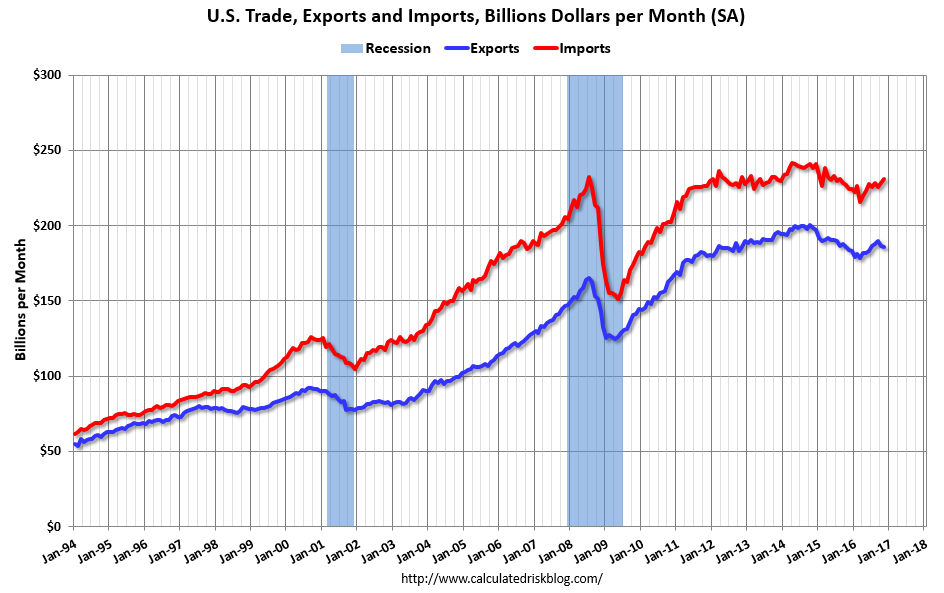
And, how will the impending trade war(s) and a persistently high US dollar impact the Fed’s plans to raise rates? Exports are off and imports are on the rise. Can the Fed engineer a lower US dollar, higher interest rates and higher stock prices all at the same time? Not unless the laws of mathematics are repealed and replaced.
I think the more likely scenario is to raise rates in March (I know, I’m very much in the minority here — what else is new?) and let the dollar — and, thus the USDJPY — continue to appreciate while forcing a mini-crash in oil and gas.
 It’s a tough bet to make, as USDJPY’s momentum has been just plain lousy. After becoming wildly overbought post-election, USDJPY maintained negative divergence for two months with RSI only recently breaking down.
 It should bounce here. But, if not, USDJPY’s SMA200 is approaching the purple .618 at 107.86. And, its SMA100 just crossed the purple .500, which is the next lower level of support.
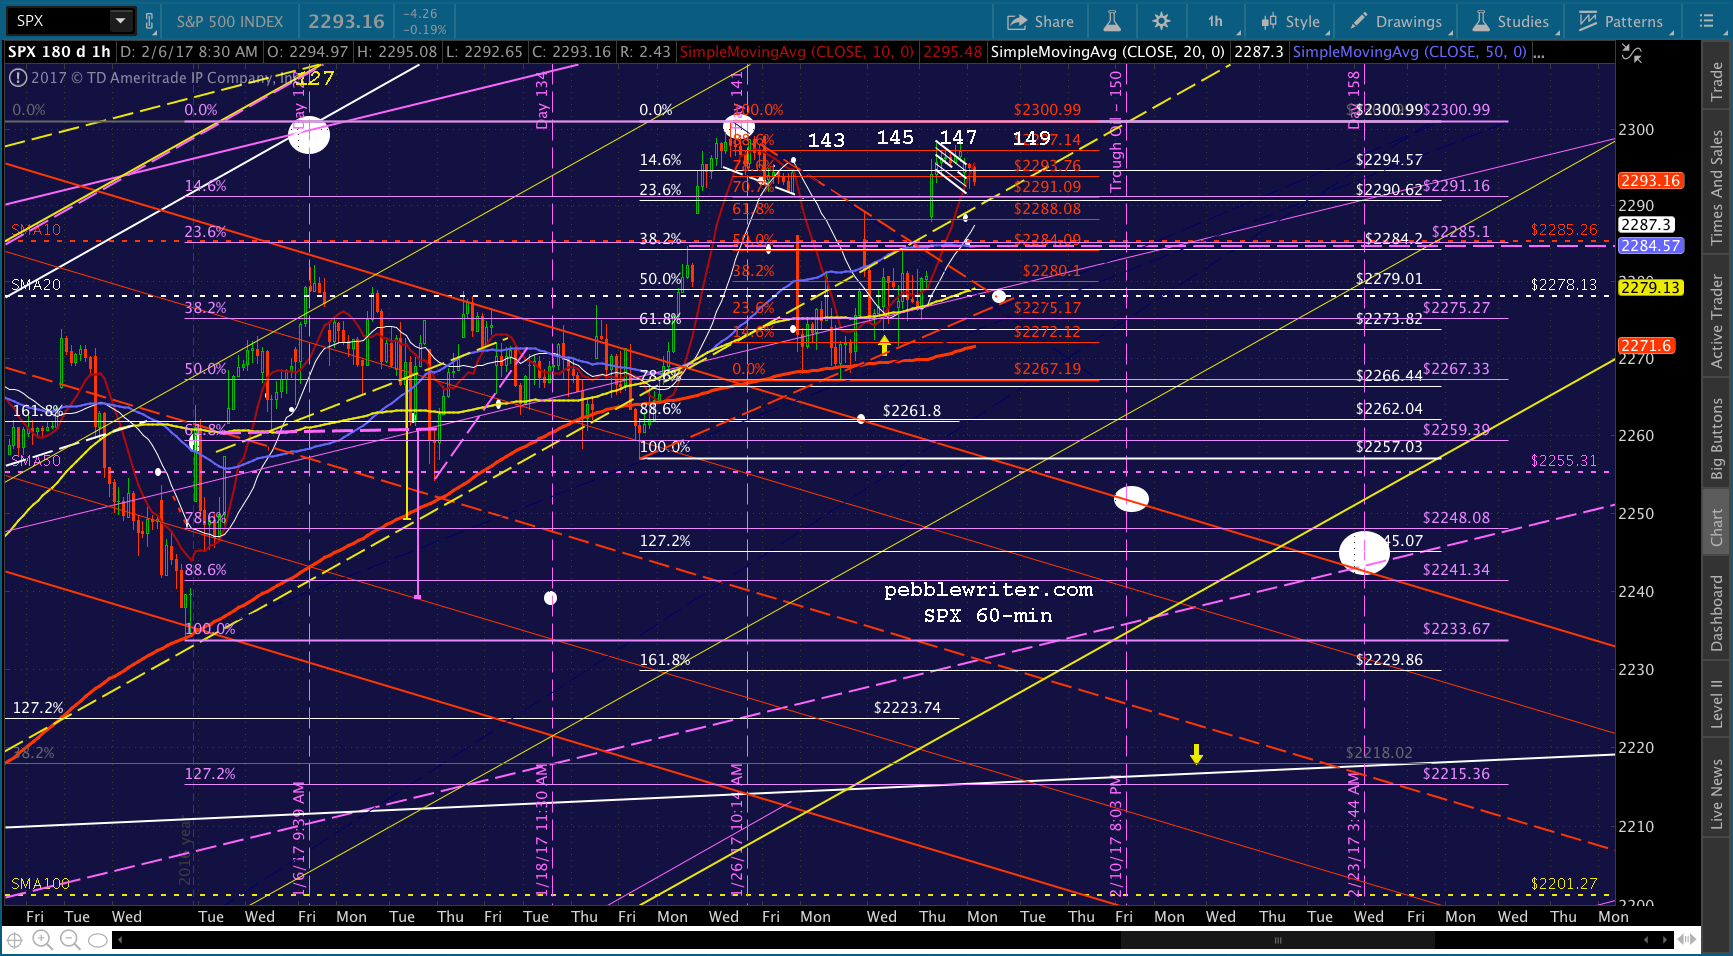
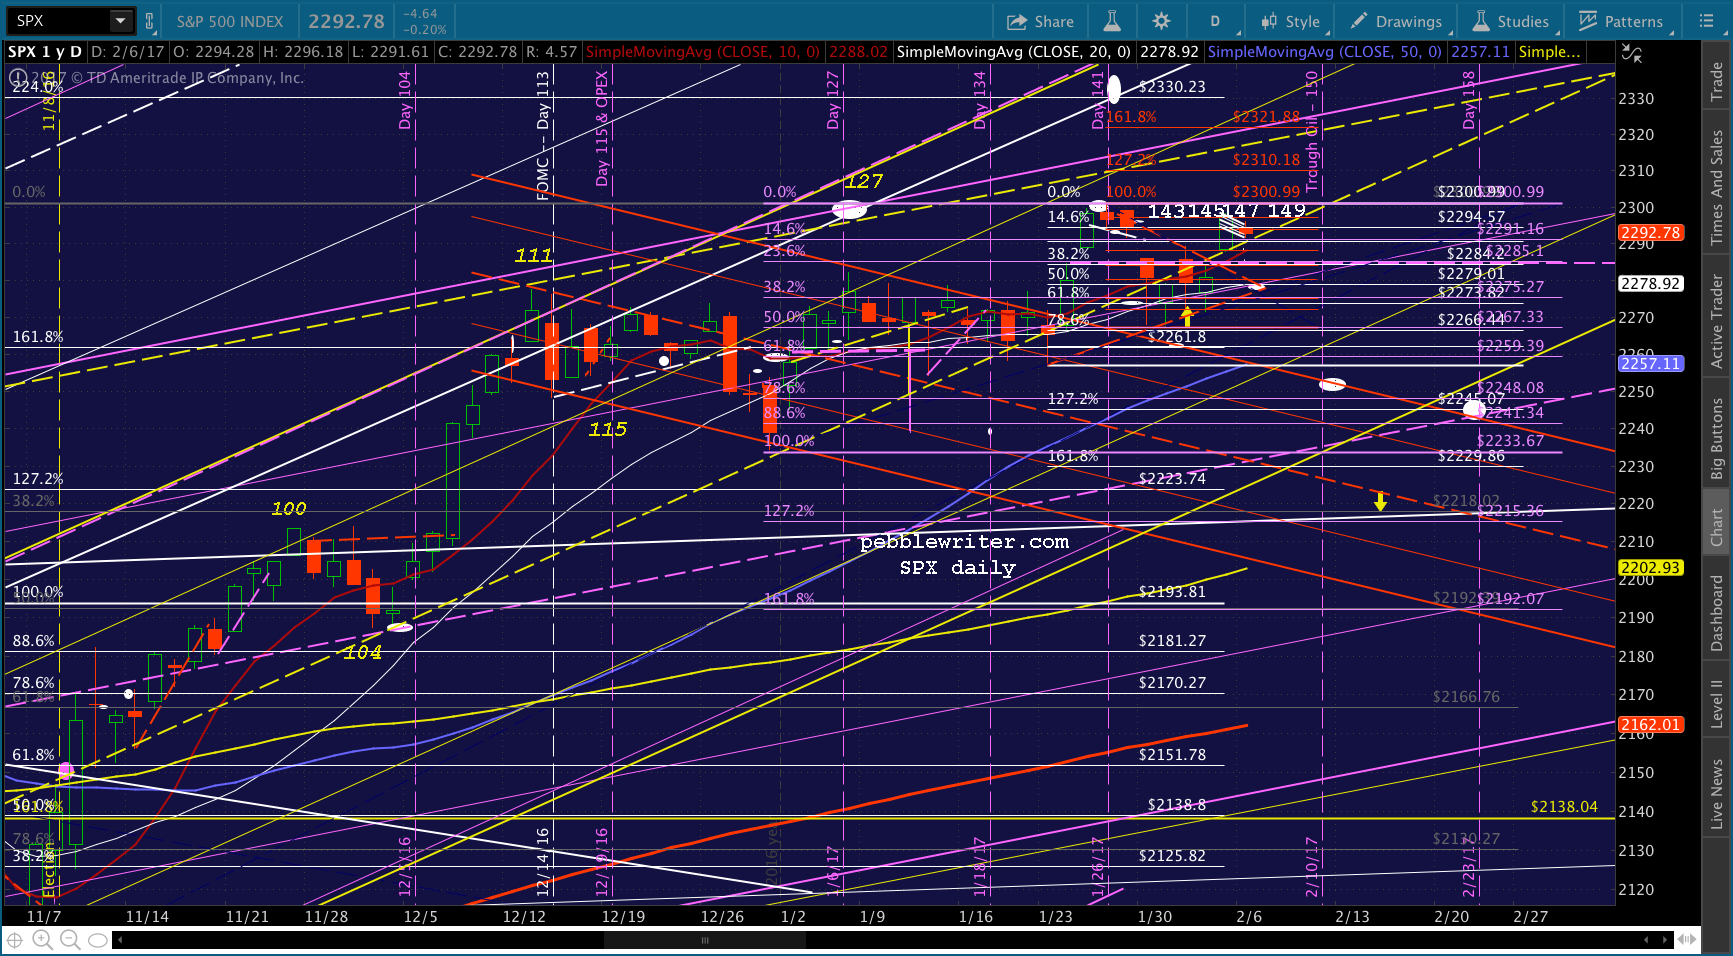
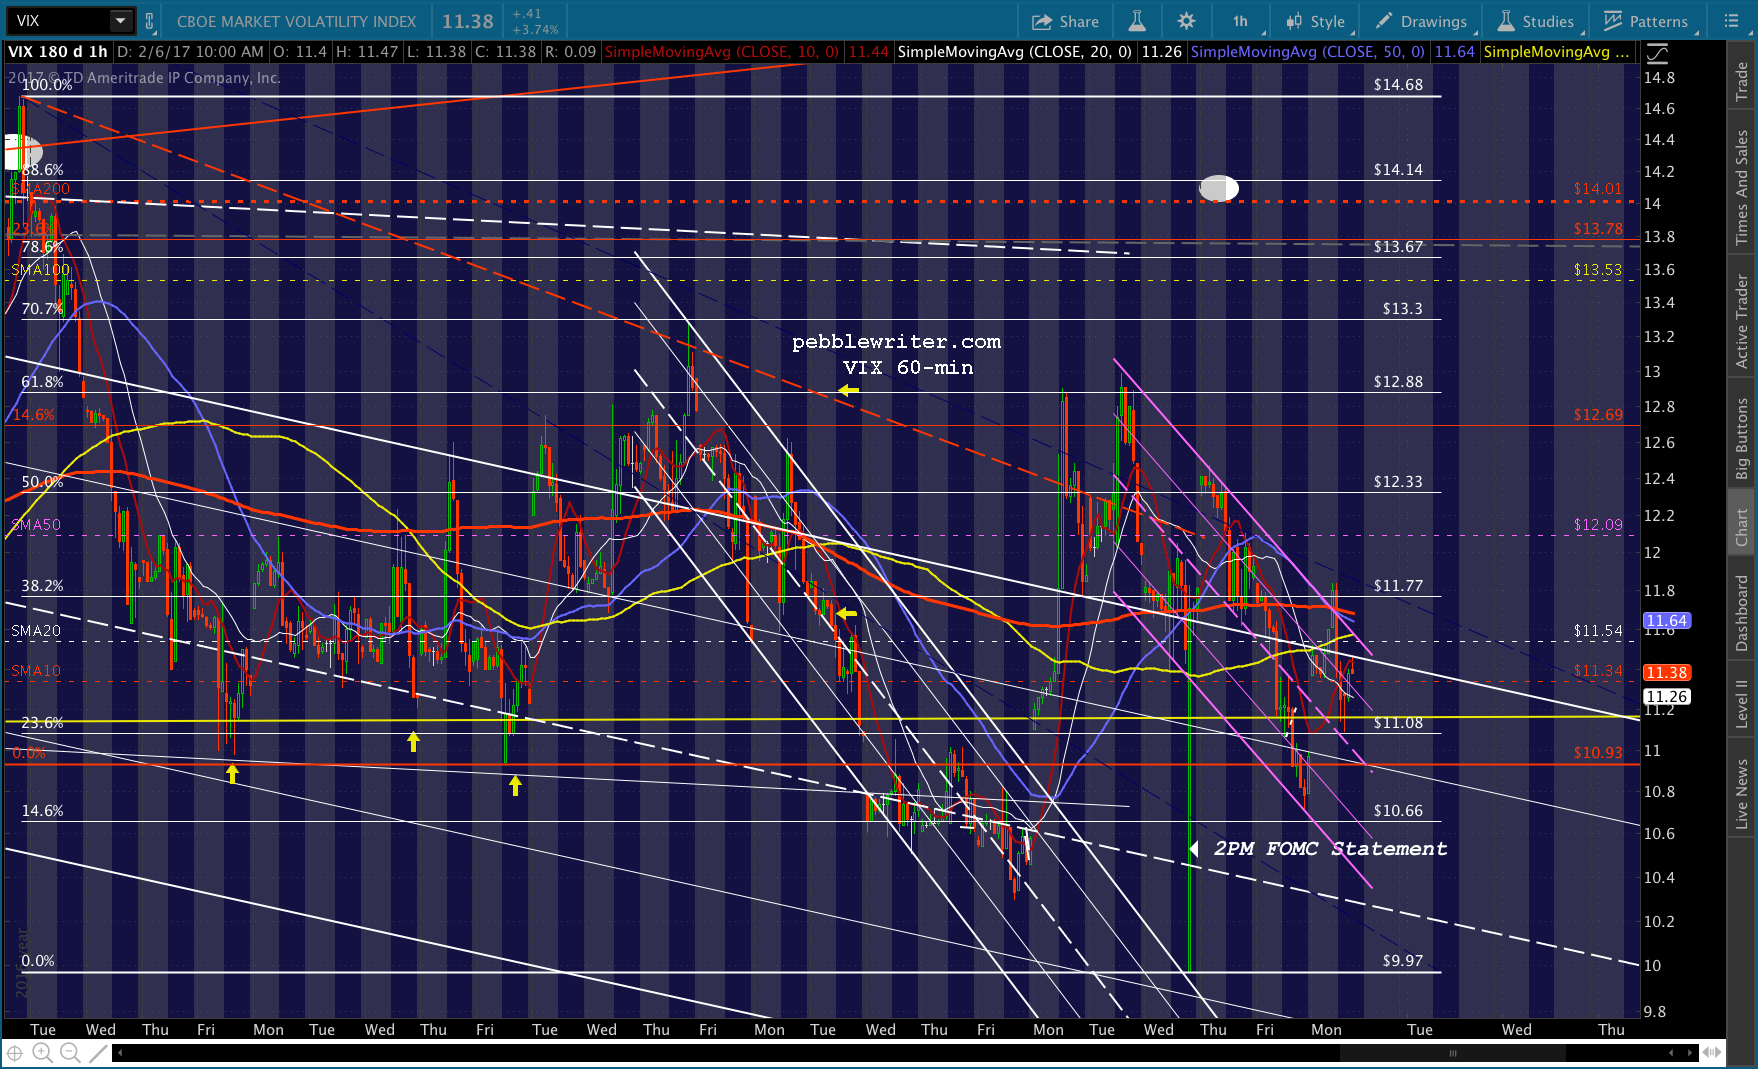
 All this leads me to the following theory. If CL breaks right away, and if USDJPY doesn’t bounce, and if VIX doesn’t plunge back below 11, we could get a sell-off to 2250-2255 this week, and another decline to, say, 2245 by Feb 23.
It works from a channel standpoint, allowing SPX to remain in the sharply rising yellow channel that dates back to Nov 4. It also works from a harmonic standpoint — with 2245.07 representing the white 1.272 extension that was set up by the decline to the white .786 on Jan 31.
But, that’s a lot of if’s. And, thus far, declines of any size have been very hard to come by. Much more common are break outs motivated by sudden swoons in VIX and sudden spikes in CL and USDJPY.

 If it were to happen, such a decline wouldn’t even make a dent in the post-election spike (a 23.6% retrace would be 2249.) In fact, the daily chart argues for a deeper retracement to, say, 2220ish — the top of the rising white channel that SPX broke out of in November, the purple 1.272, and the gray .382.
  It would also facilitate a tag on the midline of the rising purple channel which dates back to the Brexit lows. It can be seen nestled in between the large yellow channels .236 and midline in the chart below.
 Bottom line, there are countless lower targets that would each make perfect sense in one way or another. But, our analog, which has worked so well in identifying turning points so far, recently erred regarding Day 141.
It should not have involved a breakout; nor should it have involved a higher high. As such, the odds are that the analog has finally broken down and we’ll push to new highs before any significant downside sets in.
Just know that the potential is there should all those “ifs” come together.
UPDATE: 1:20 PM
SPX is coming up on our next downside target, the .618 at 2288.08. Traders — be aware that we could get a bounce here. The SMA5 200 was just tagged. Even though CL has broken below its SMA10 and USDJPY appears headed lower, we’ve had plenty of overnight gaps higher lately. 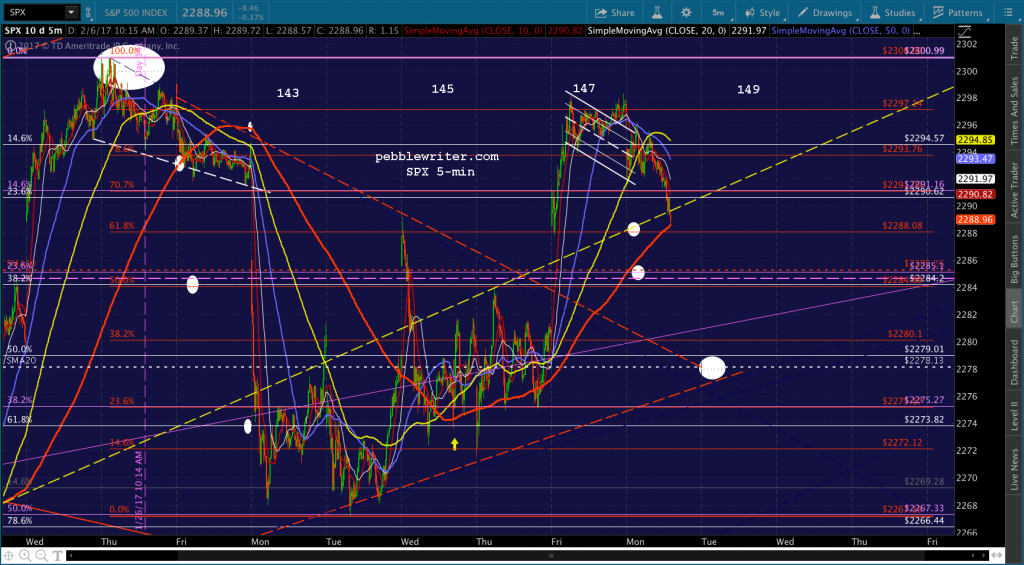
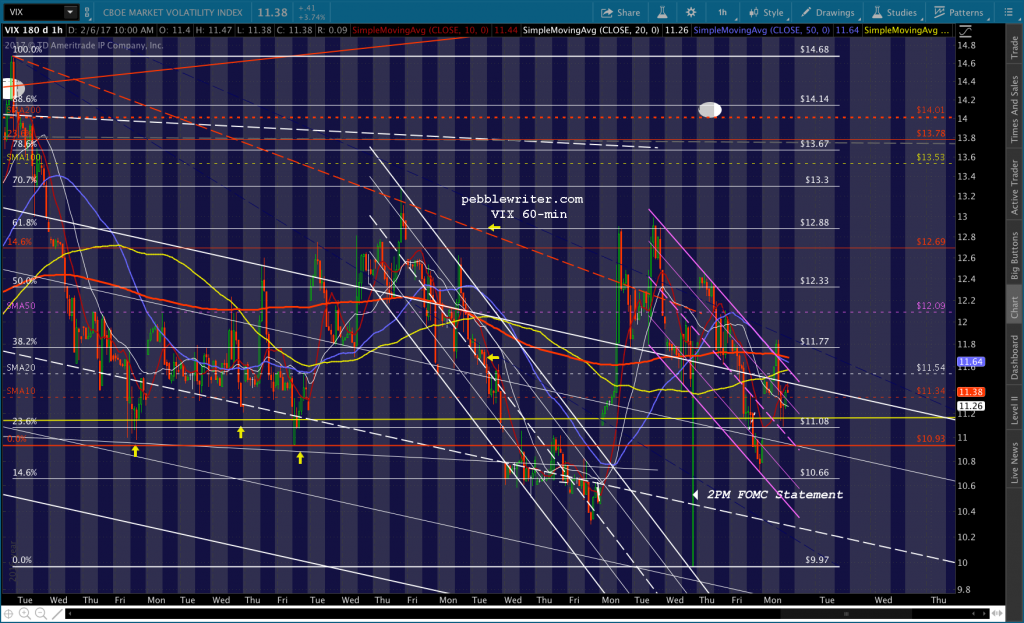
 VIX, having been brought back into the falling white channel, is in a position to break out…or not.
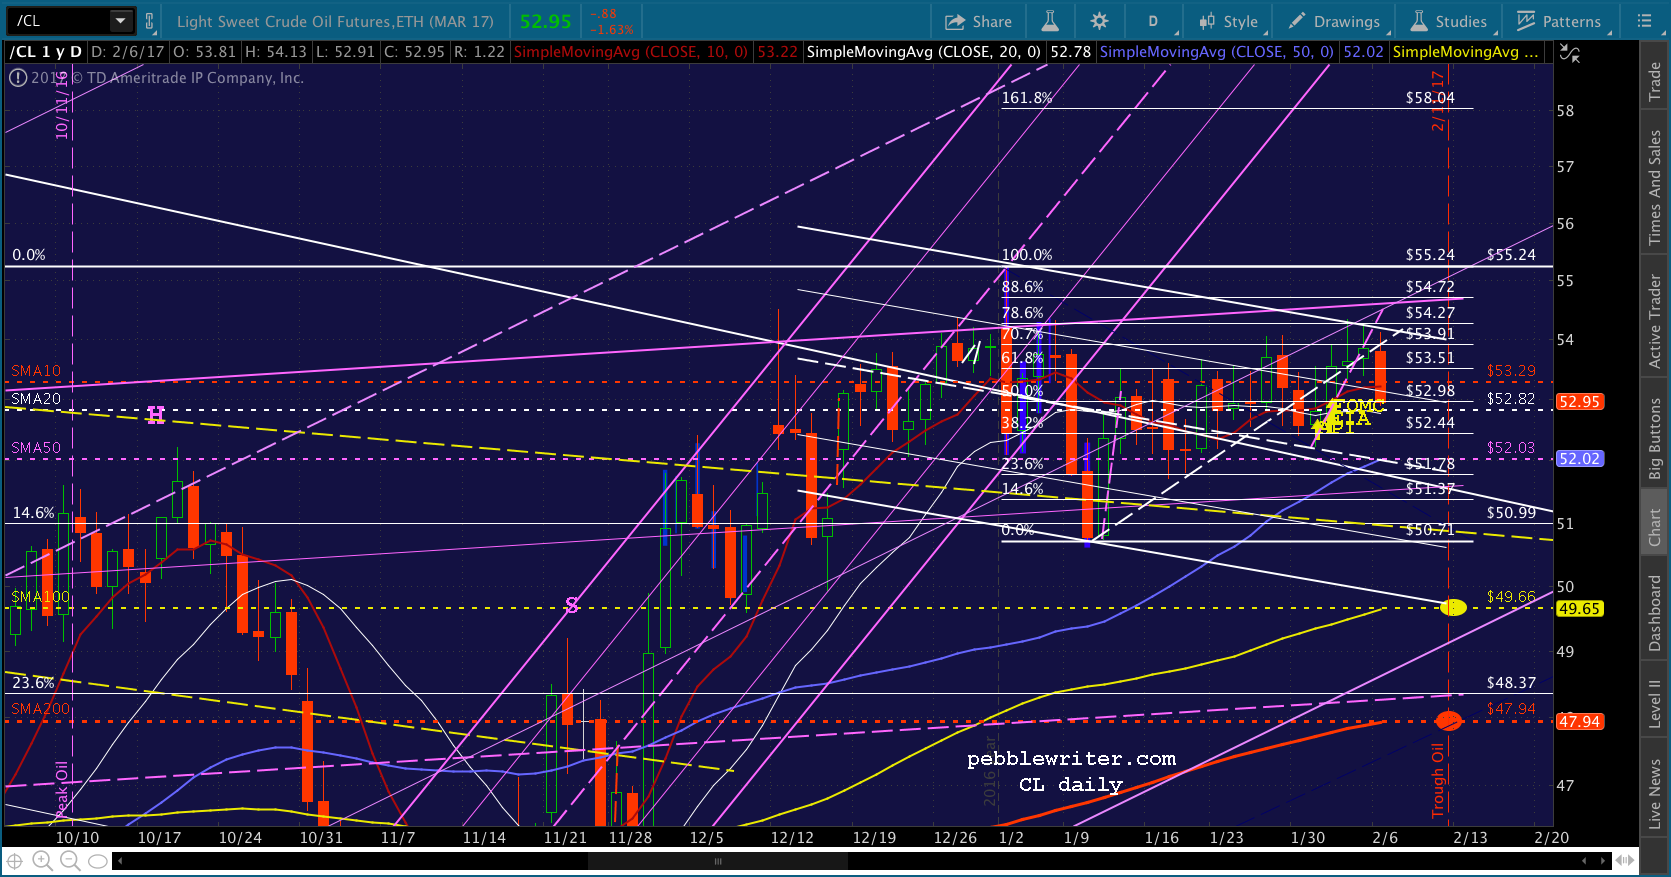
 Note that CL isn’t that far from support at its SMA100 (49.66) and SMA200 (47.94.)
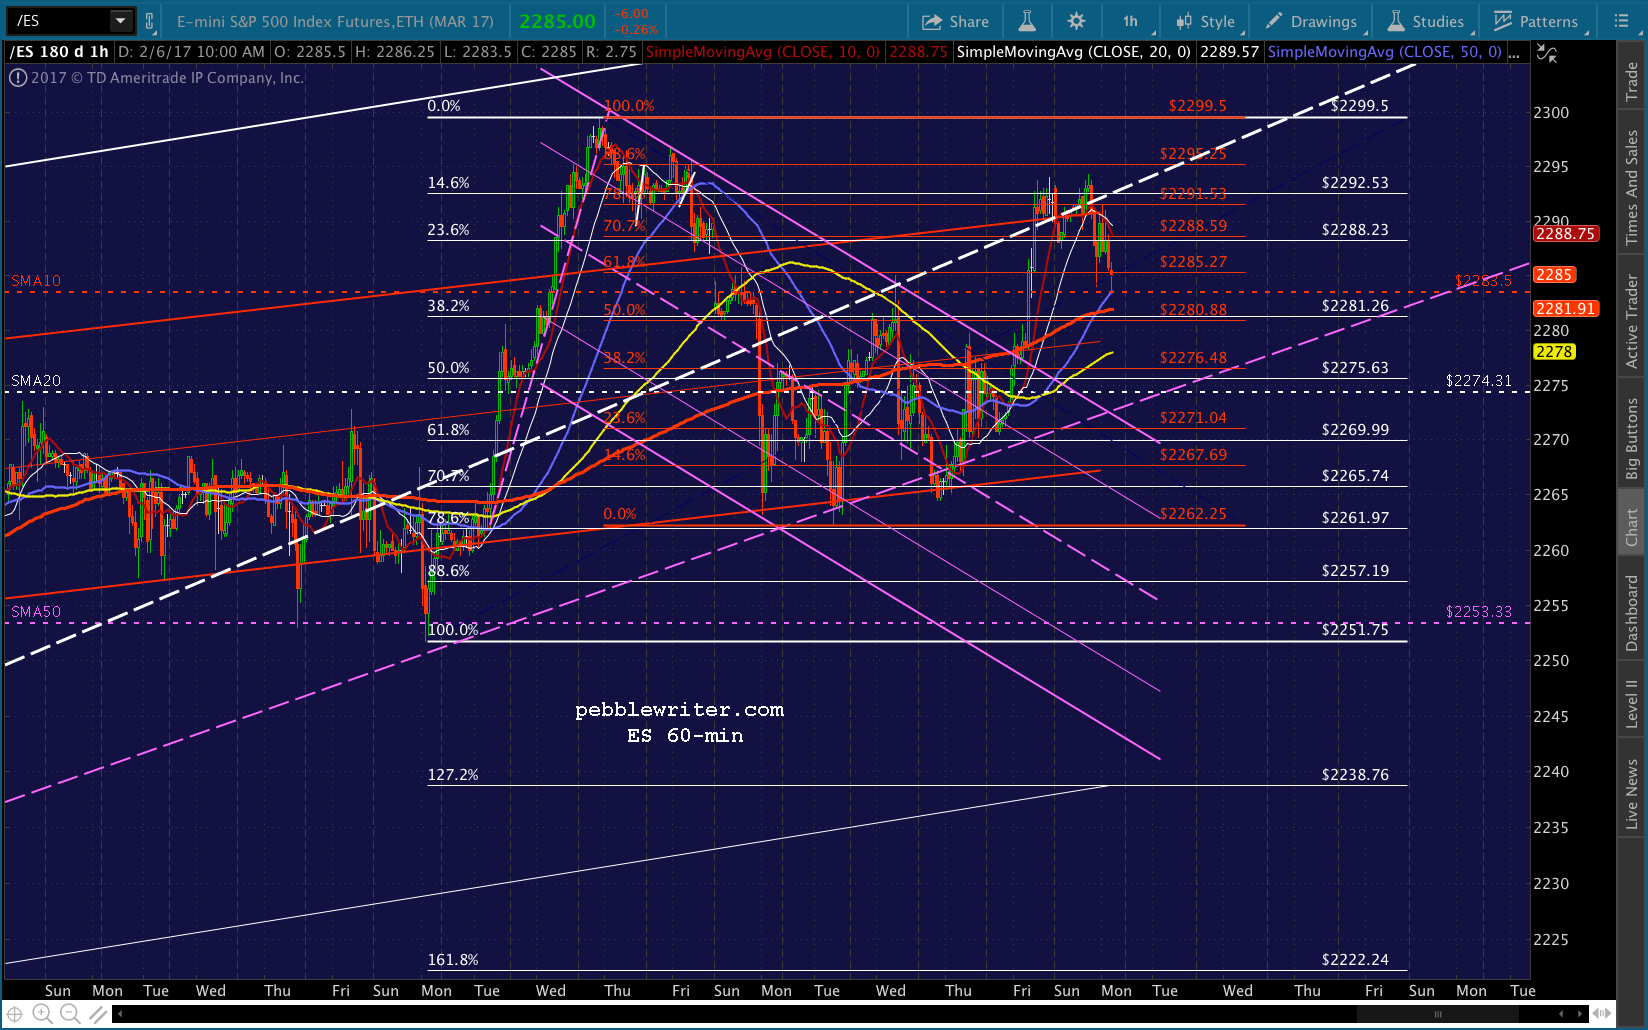
 Note, also, that ES has backtested its SMA10 as expected. Bottom line, the risk of a breakout remains elevated.
 As always, only hold short overnight if you can hedge or handle the gap risk. GLTA.