

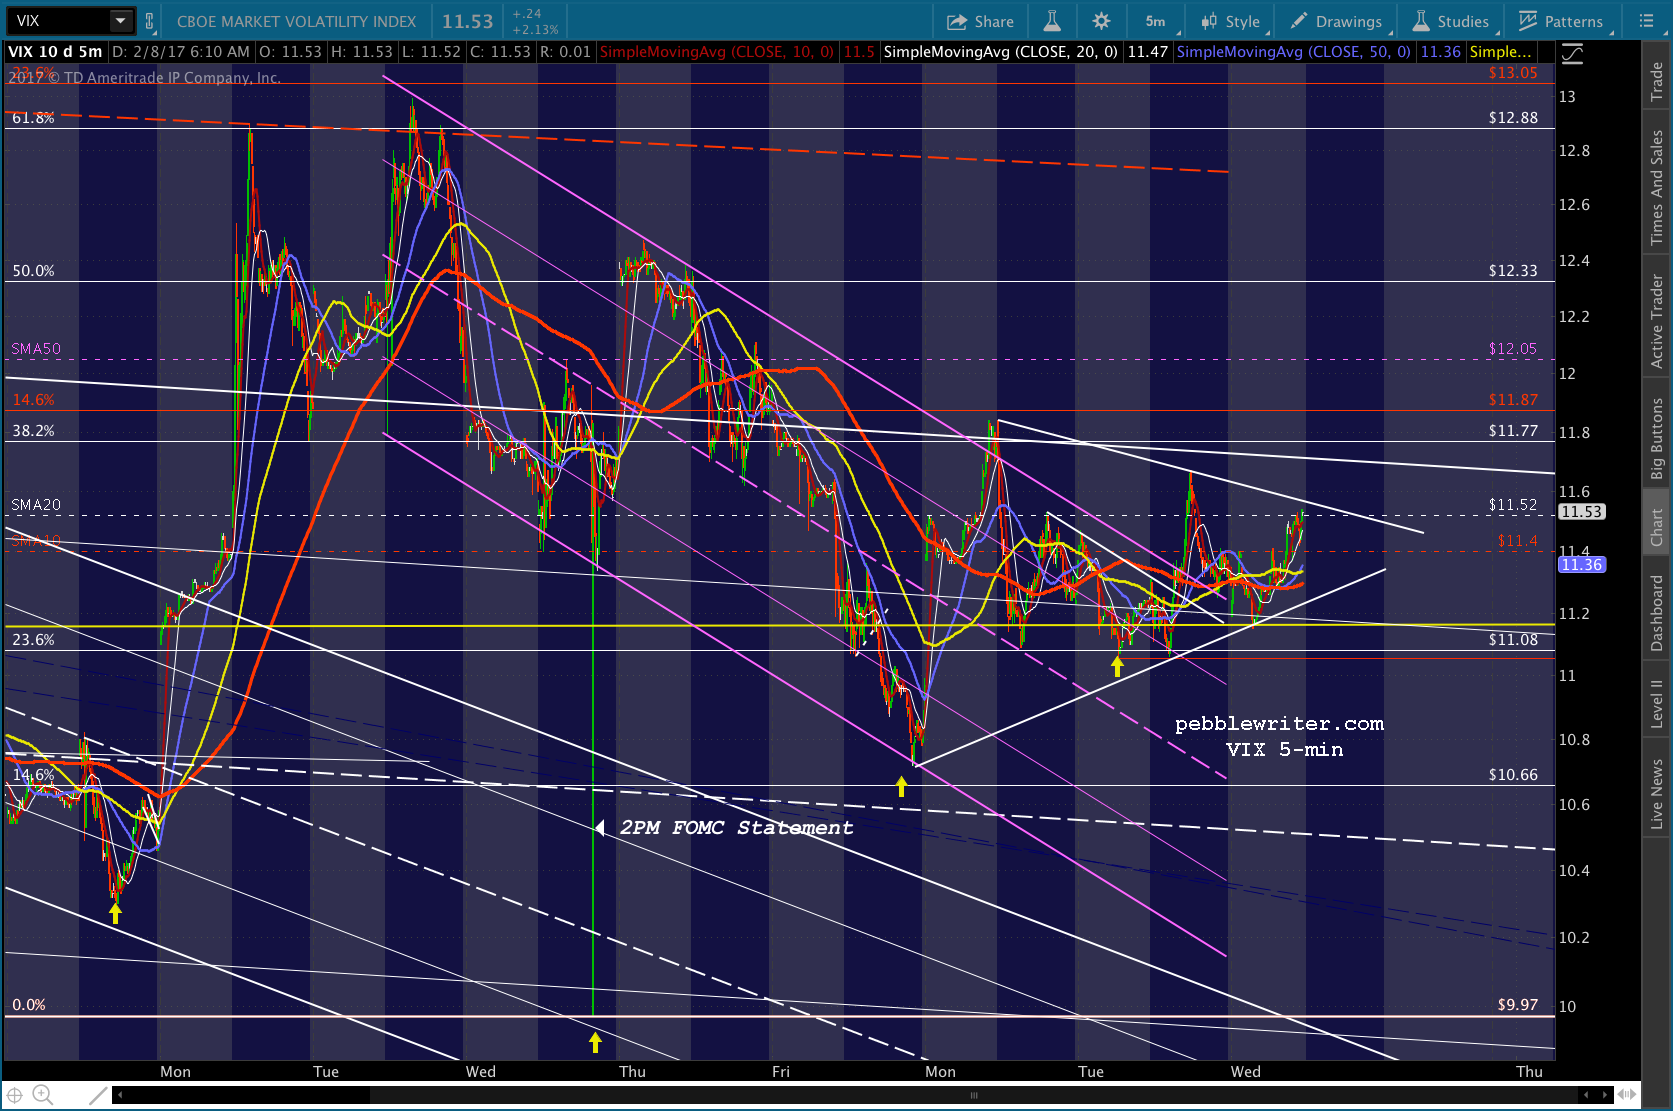
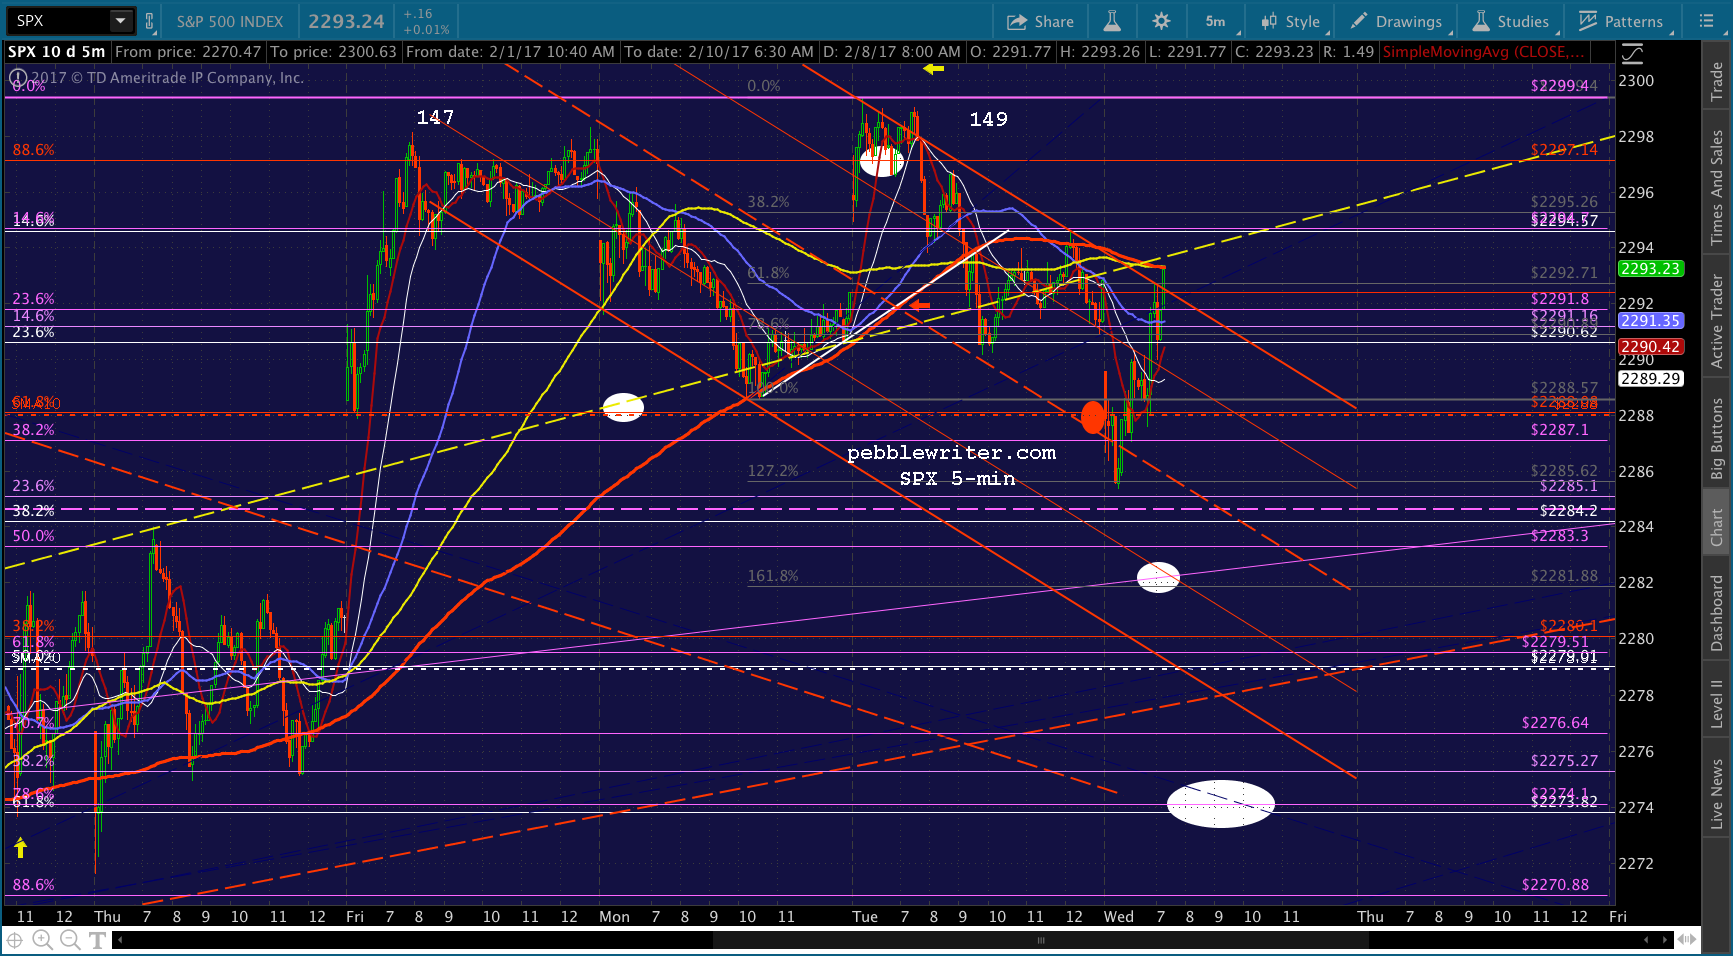
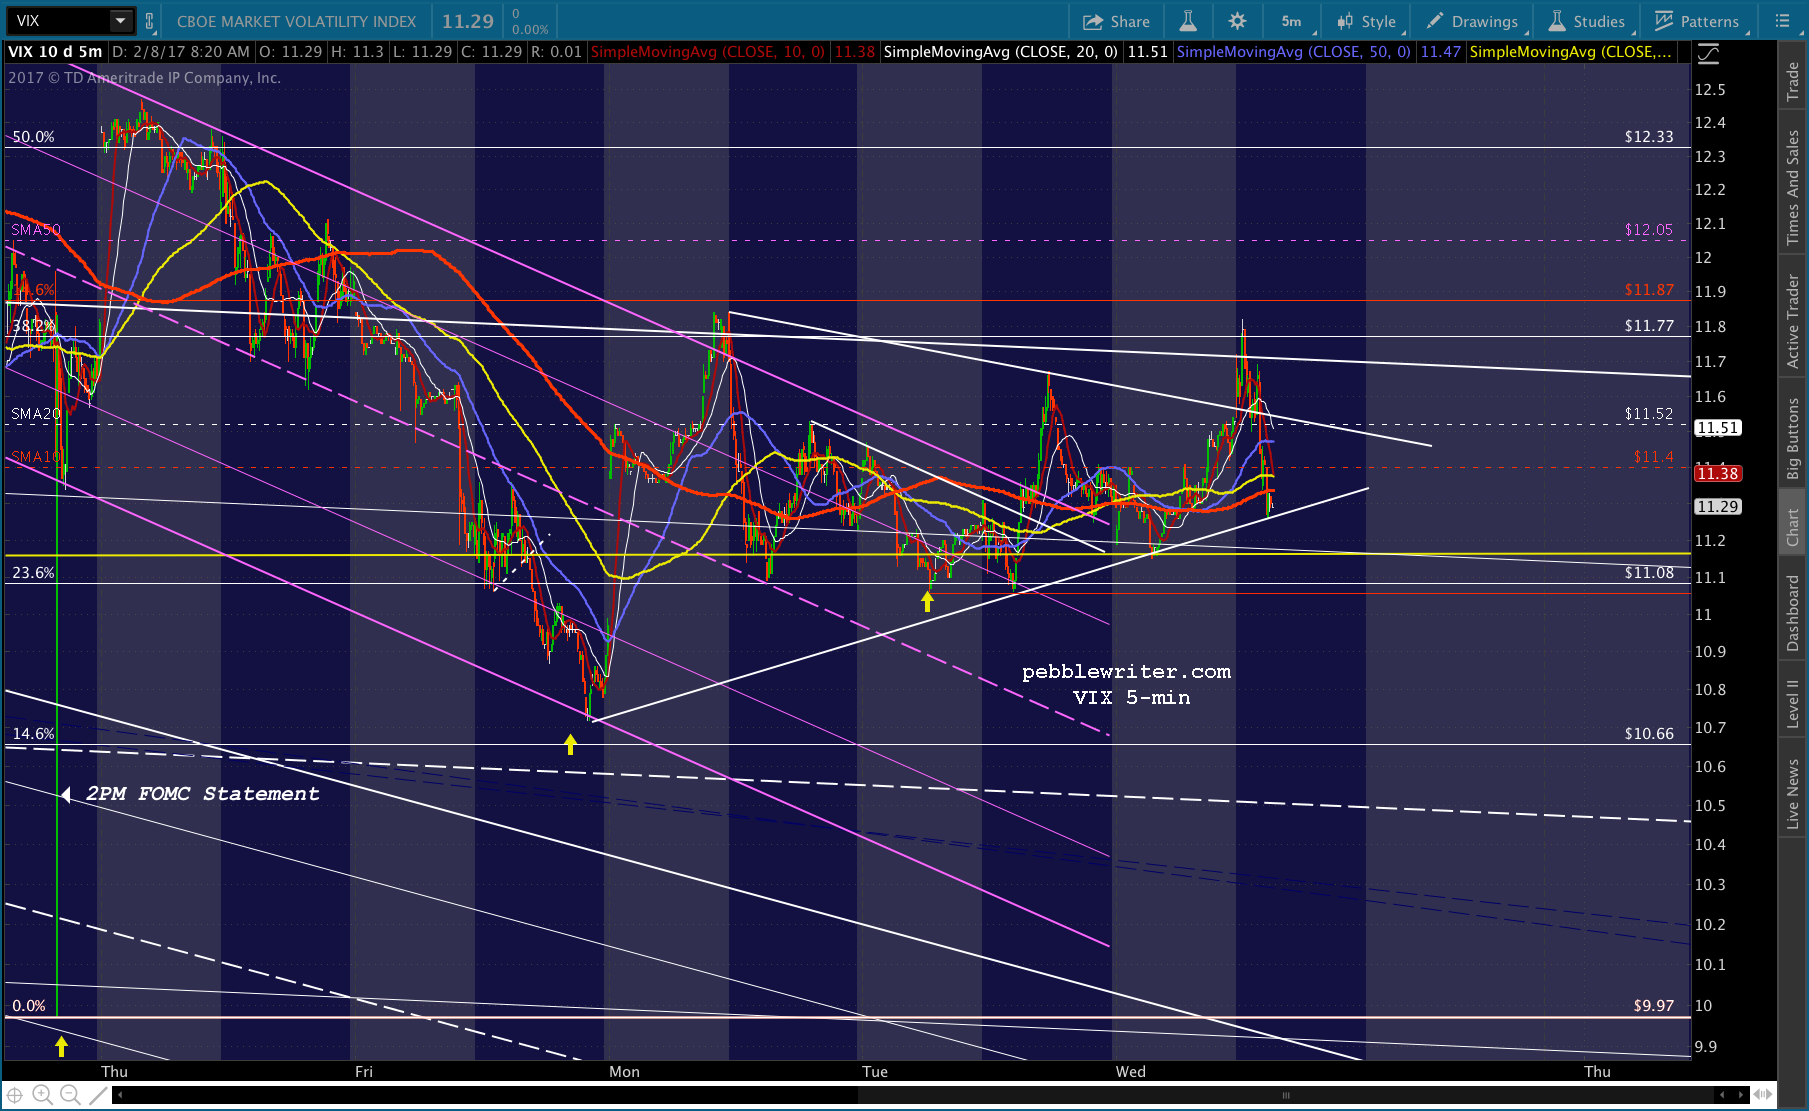
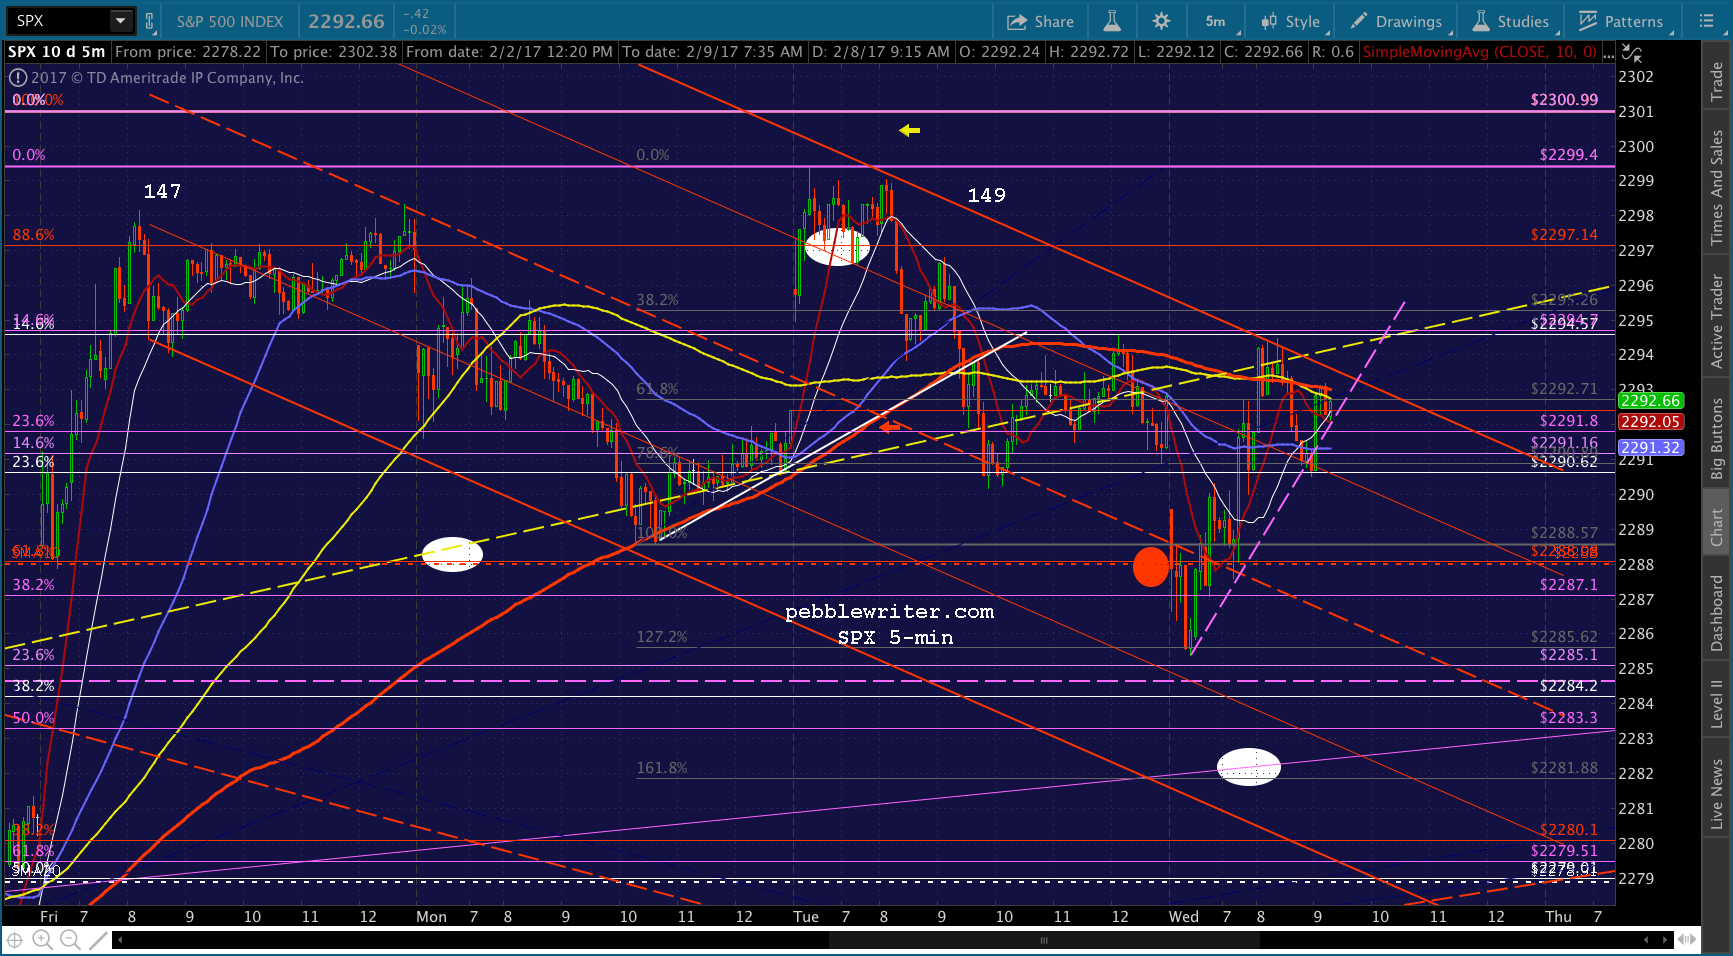
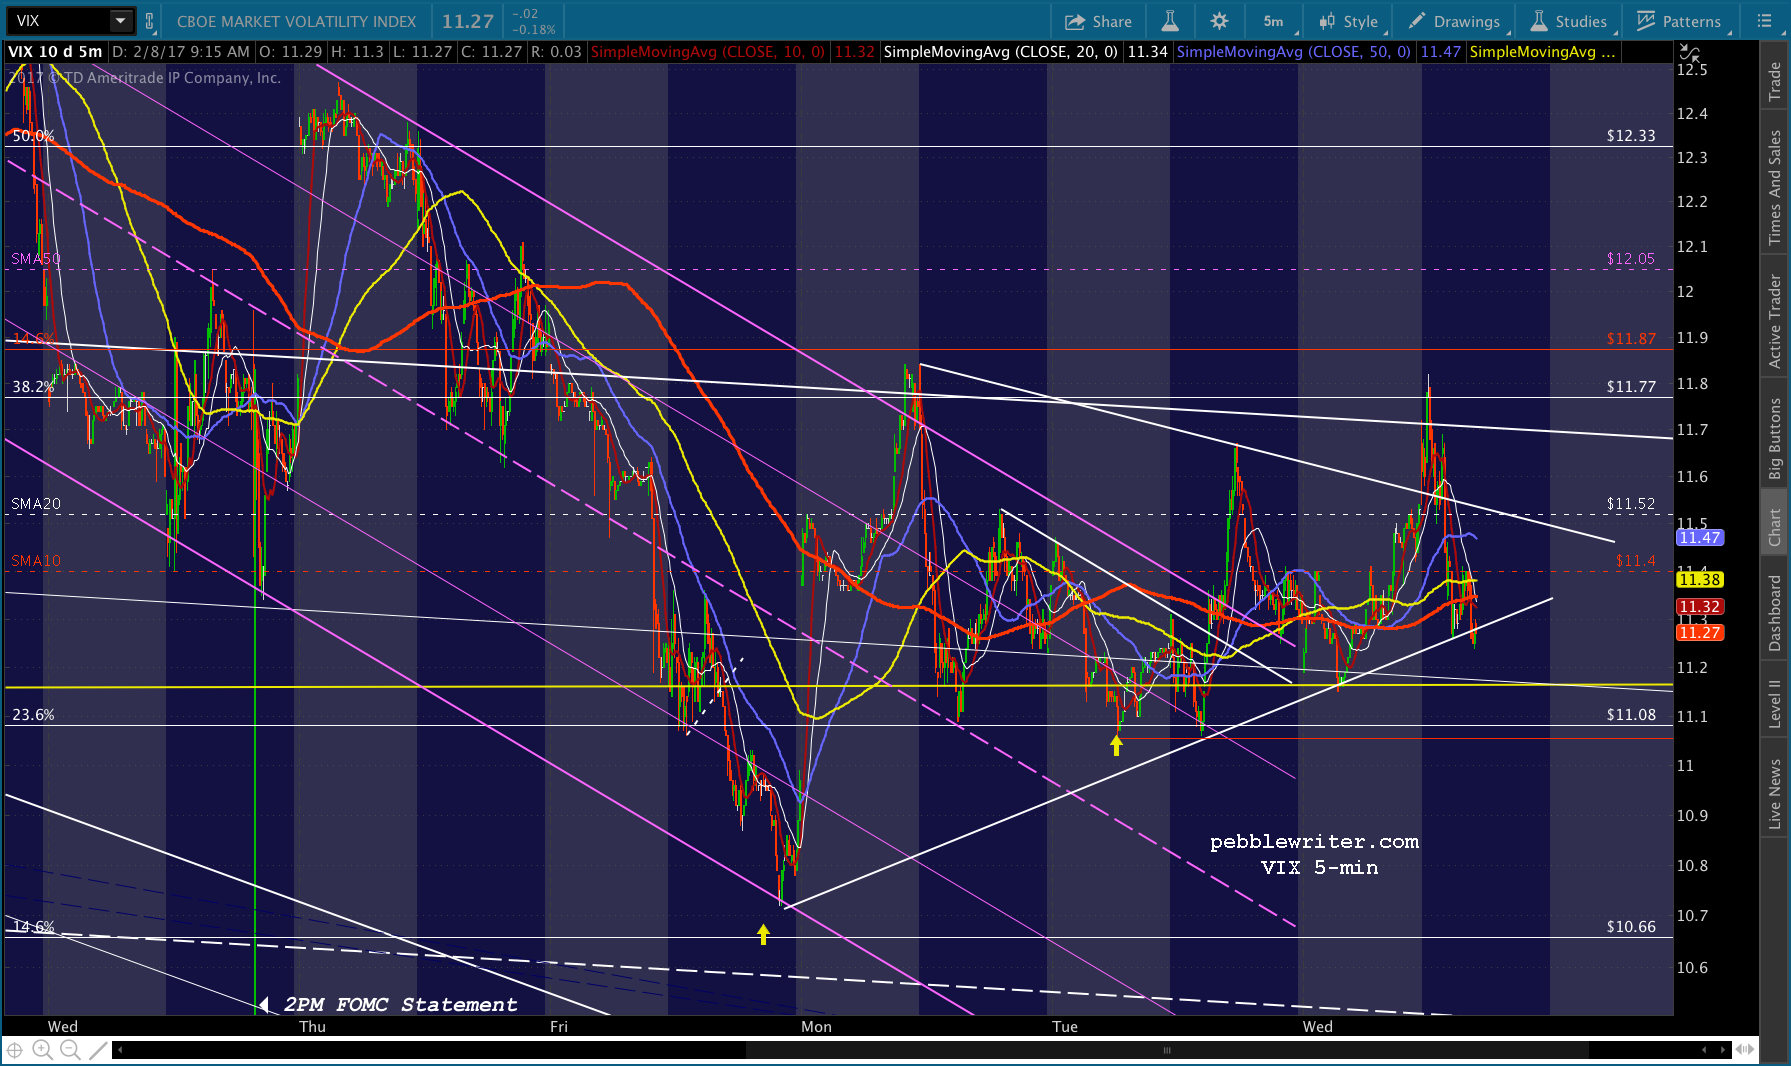
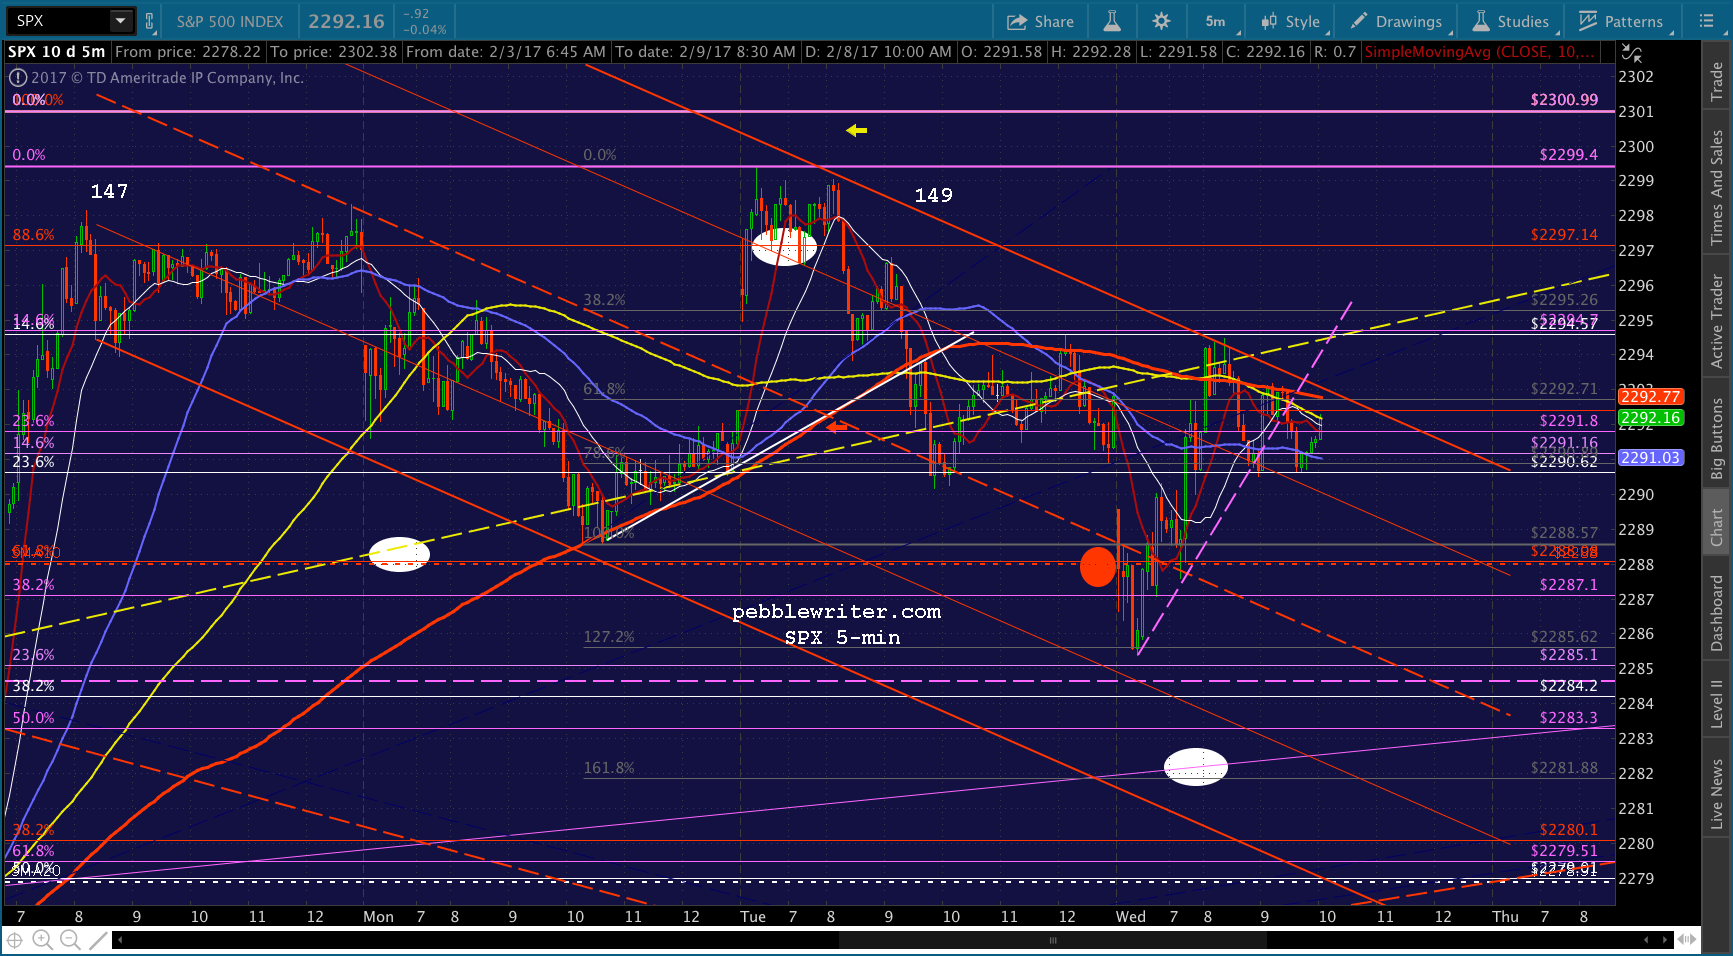
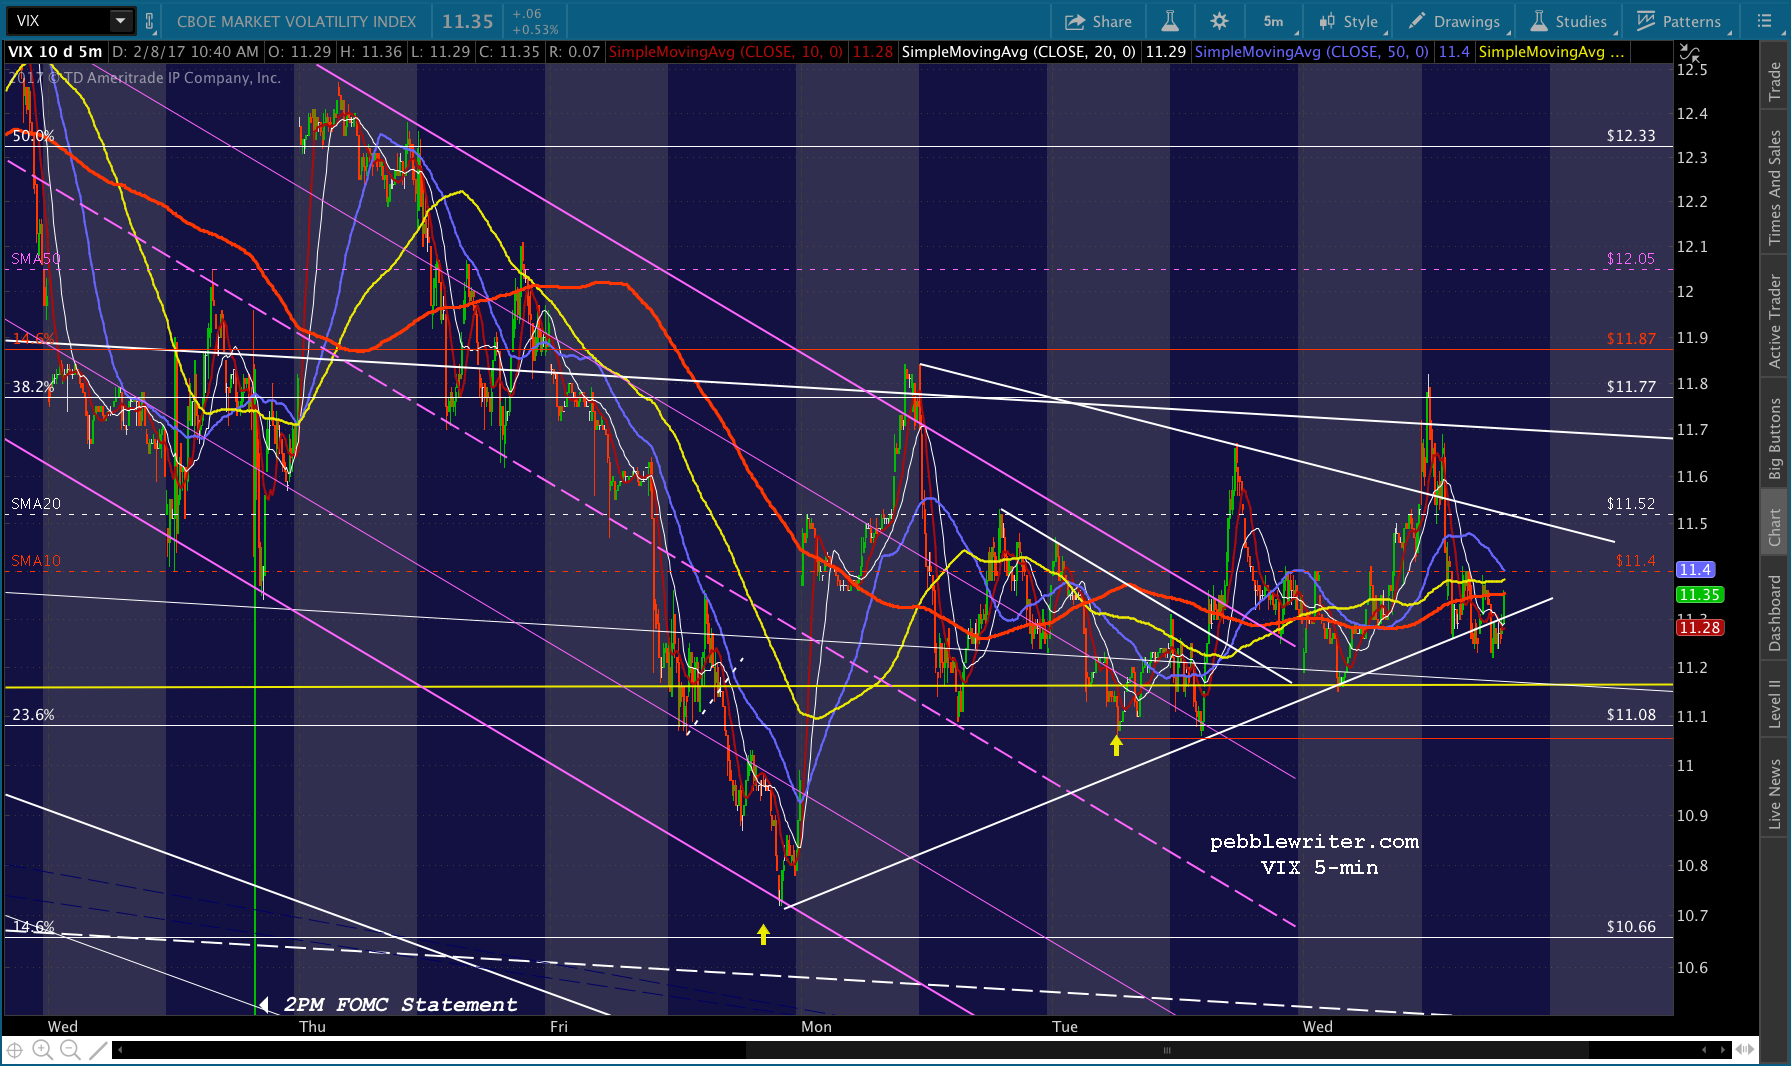
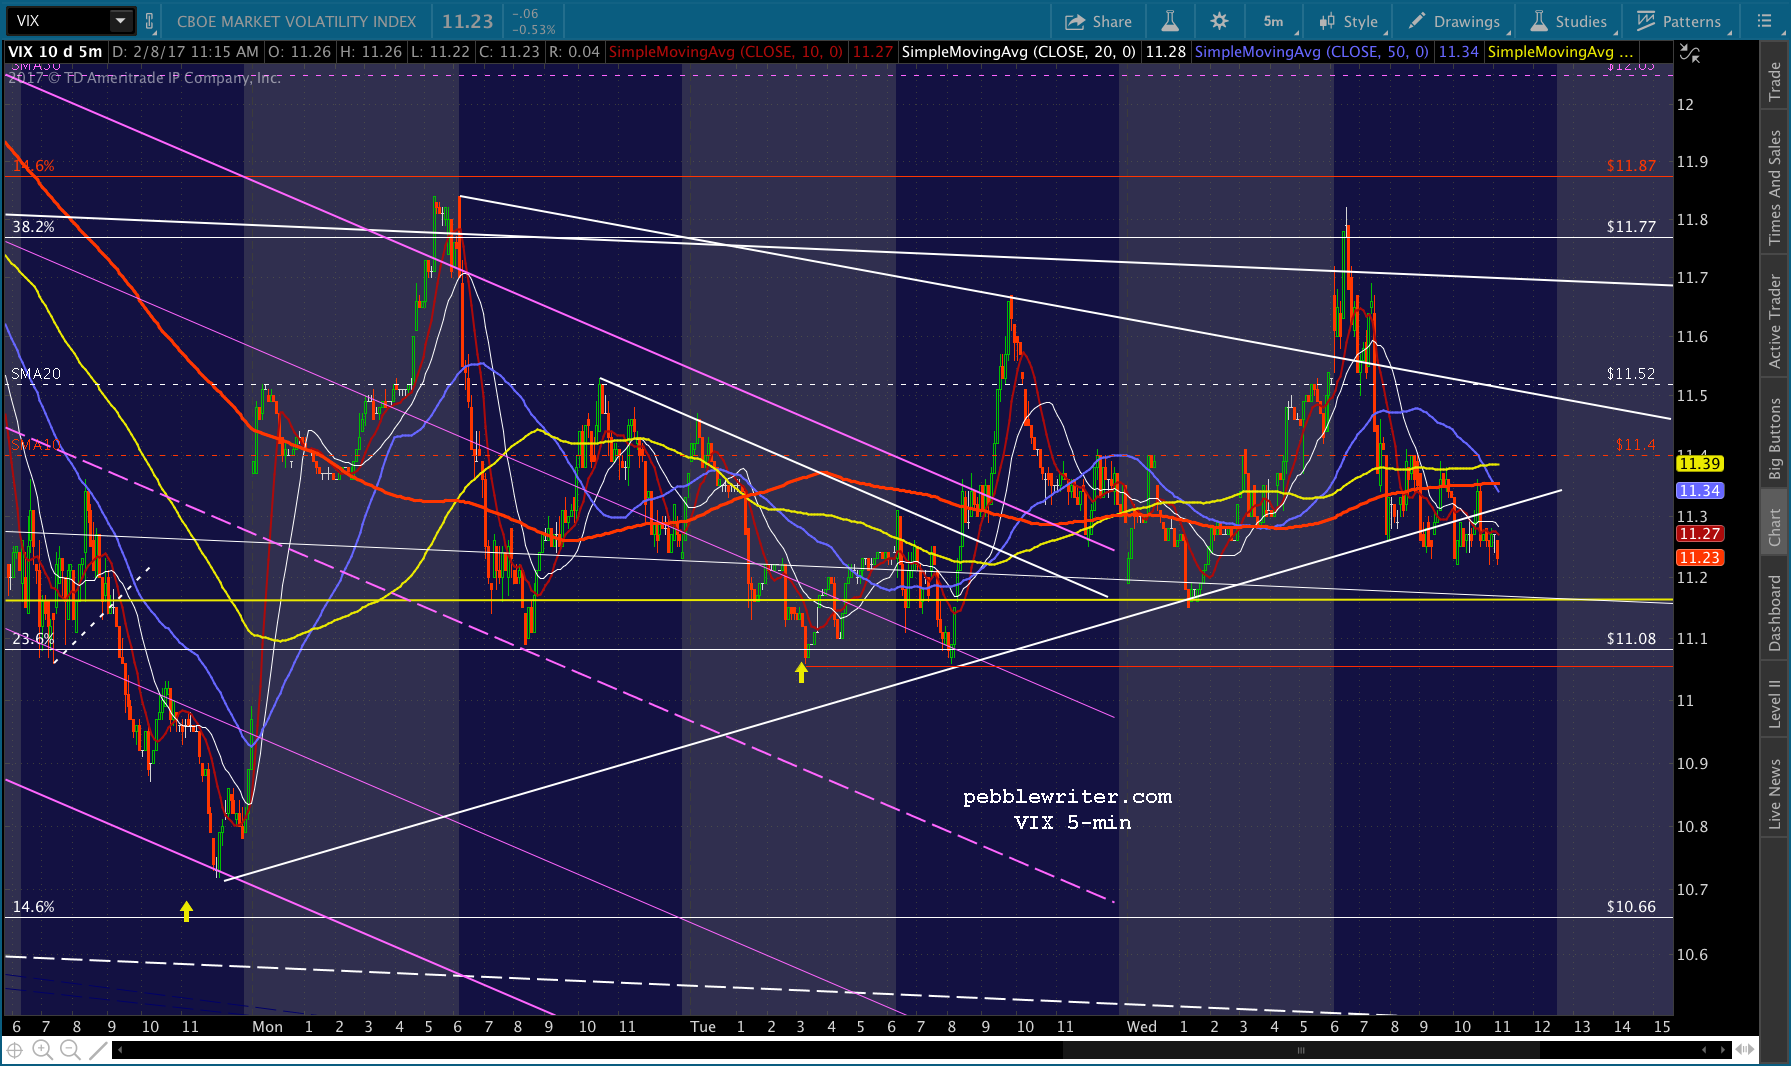
With CL finally melting down and the USDJPY failing to break out (despite four close calls yesterday), it’s up to VIX to prop up stocks today…if it can. It’s tried to break out of its falling white channel six distinct times since the start of the year.  Each time, it’s been smacked down — effectively putting a stop to the decline. Will this time be any different? We remain short from 2297.02 and our downside targets remain the same.
continued for members…
This is basically where VIX was at yesterday’s open — a breakout that has loads of potential.
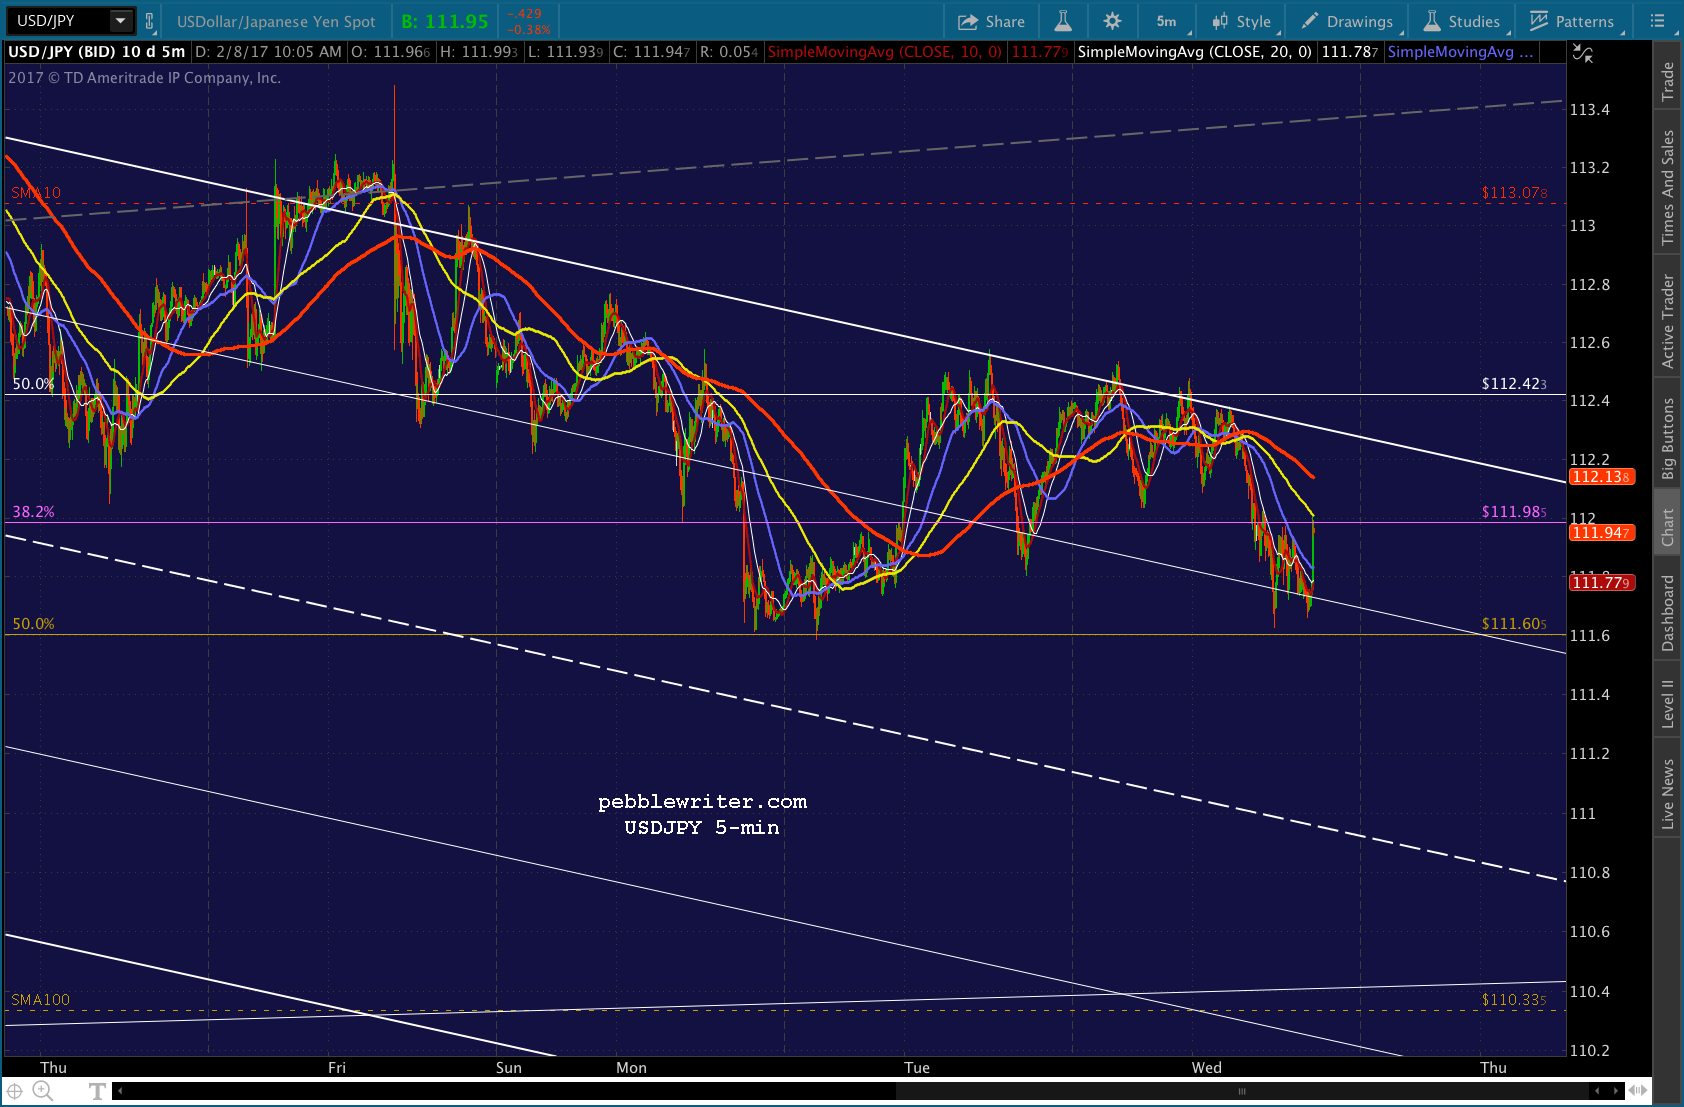
USDJPY appears headed for the SMA100 at 110.335. 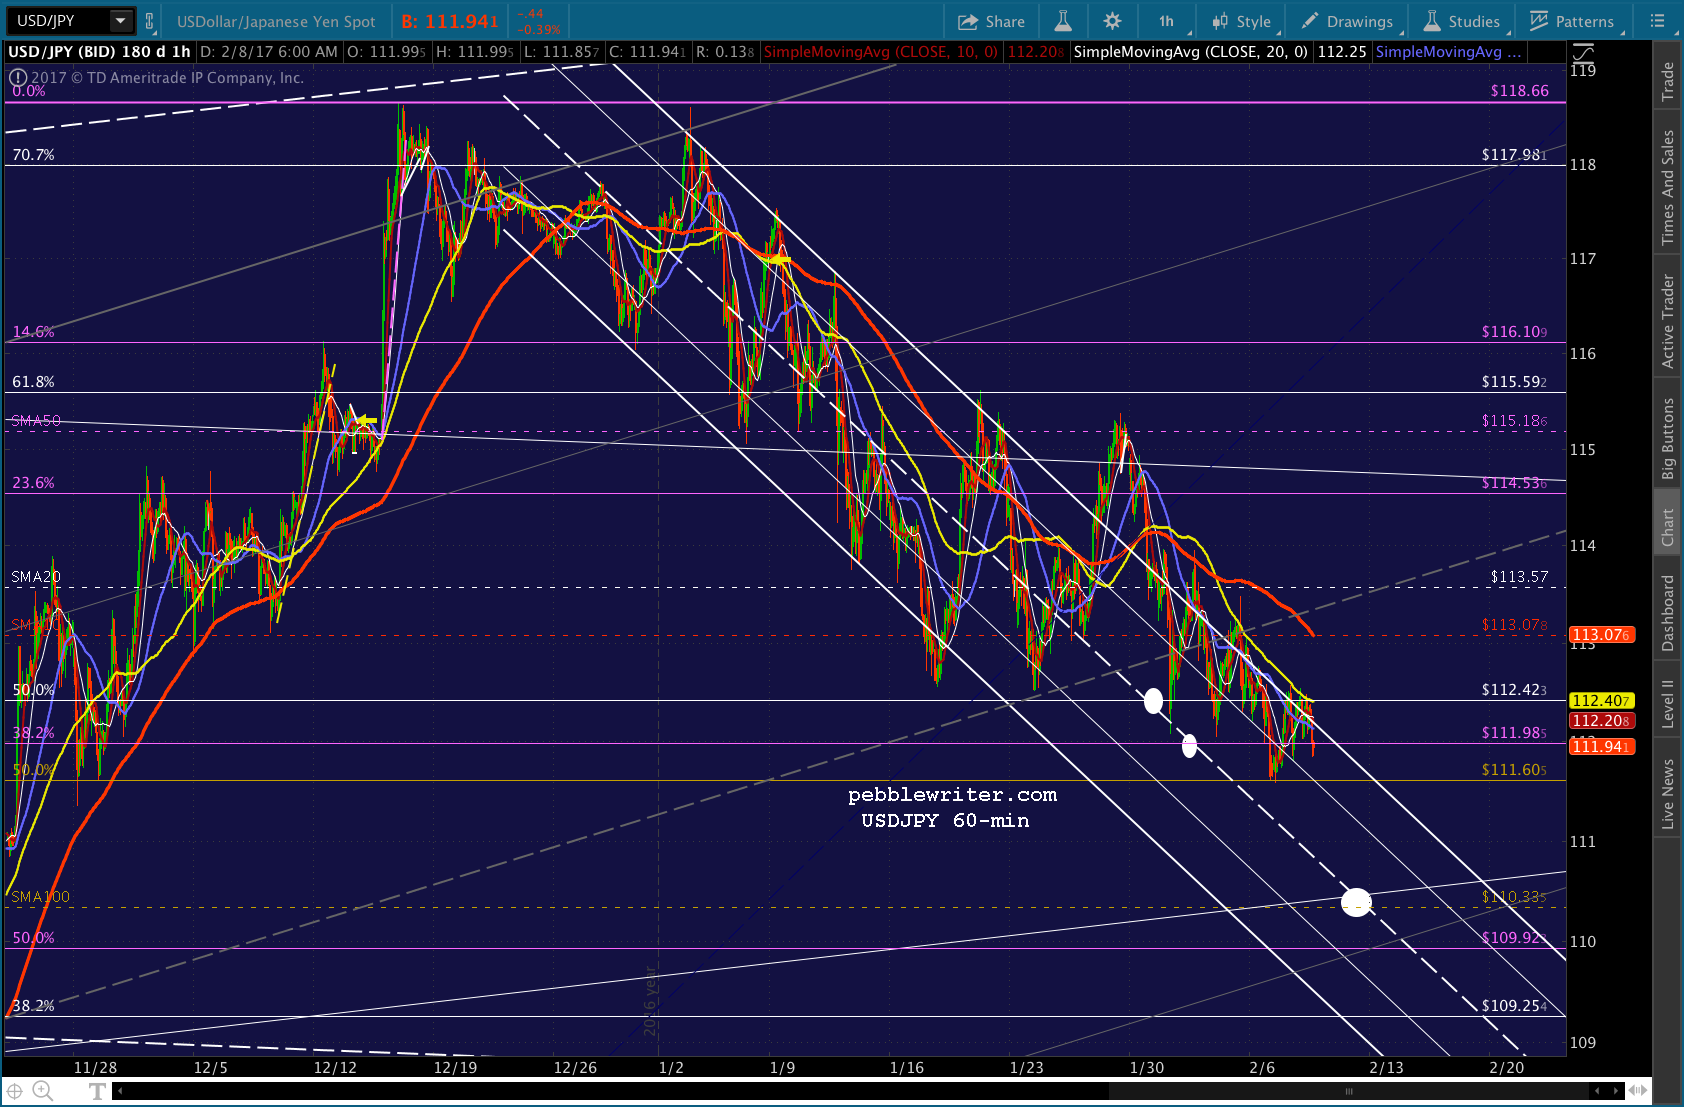
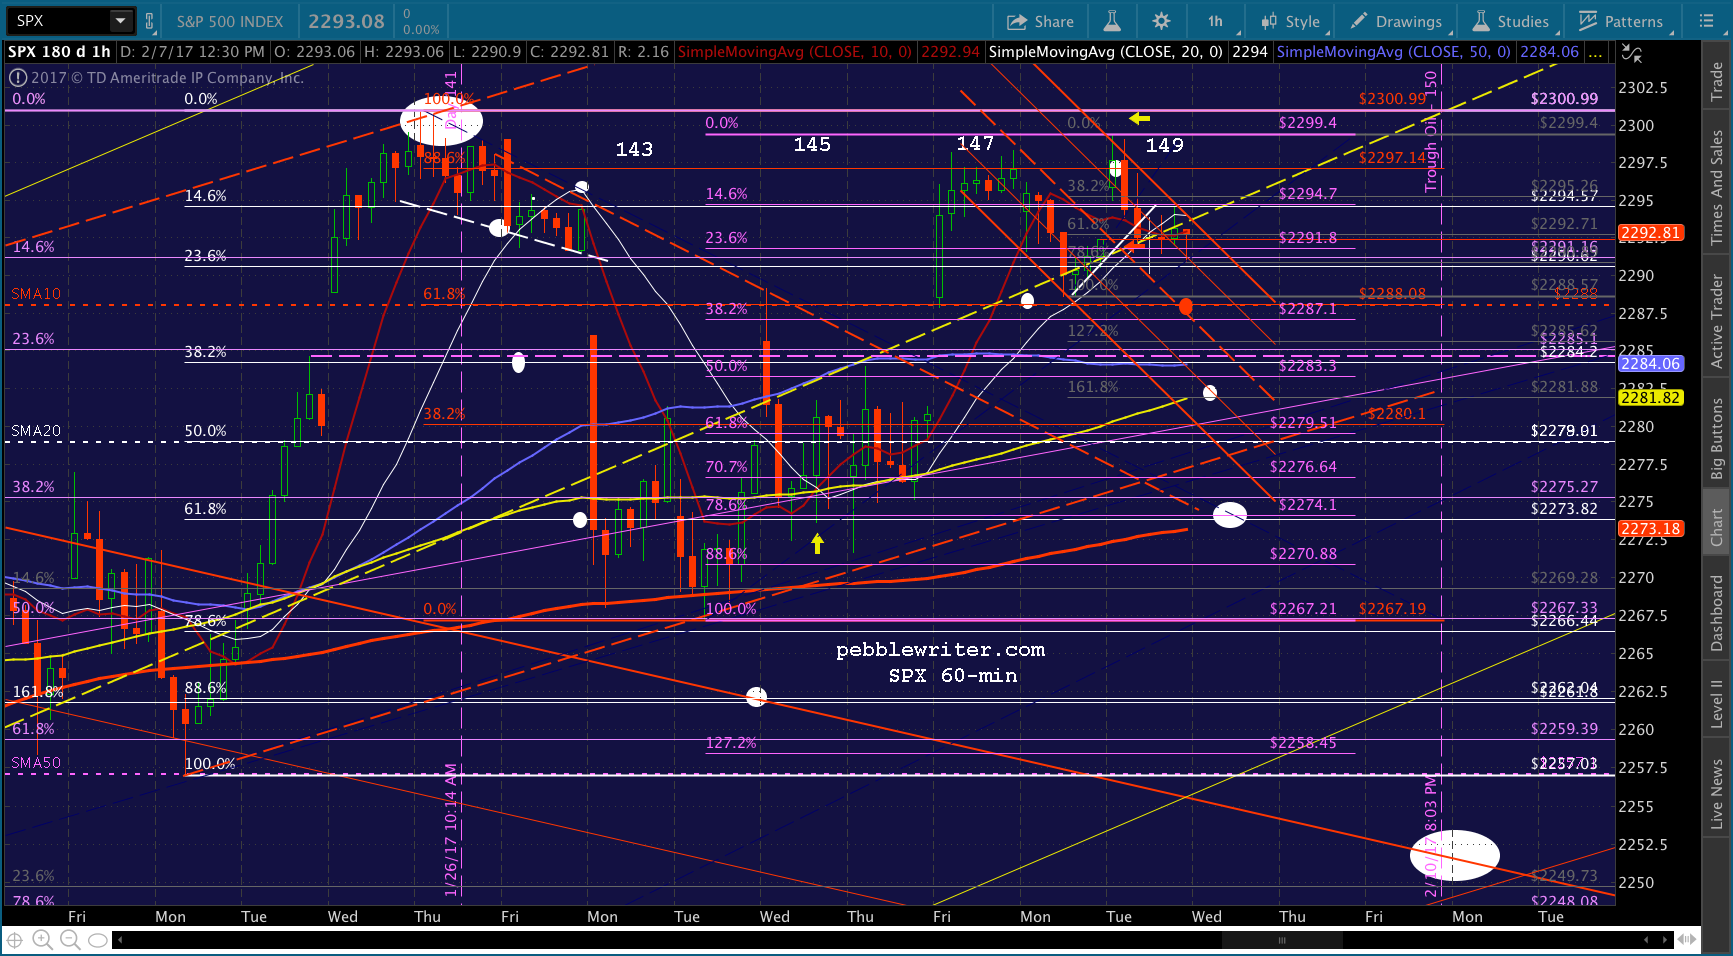
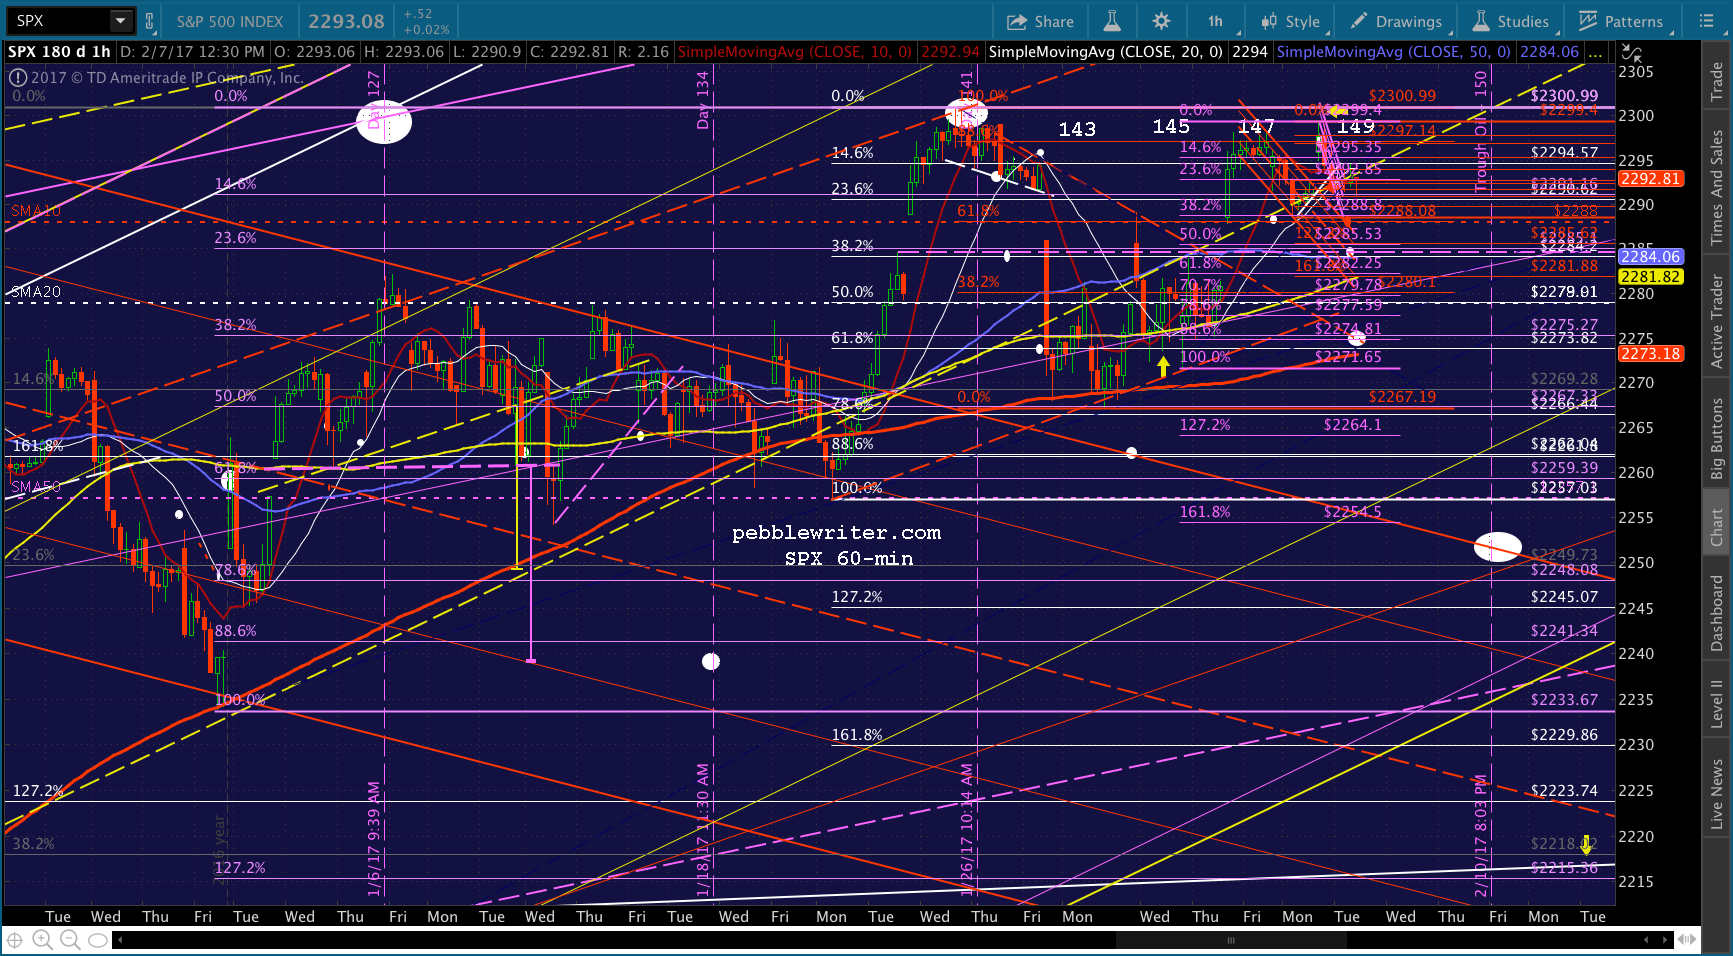
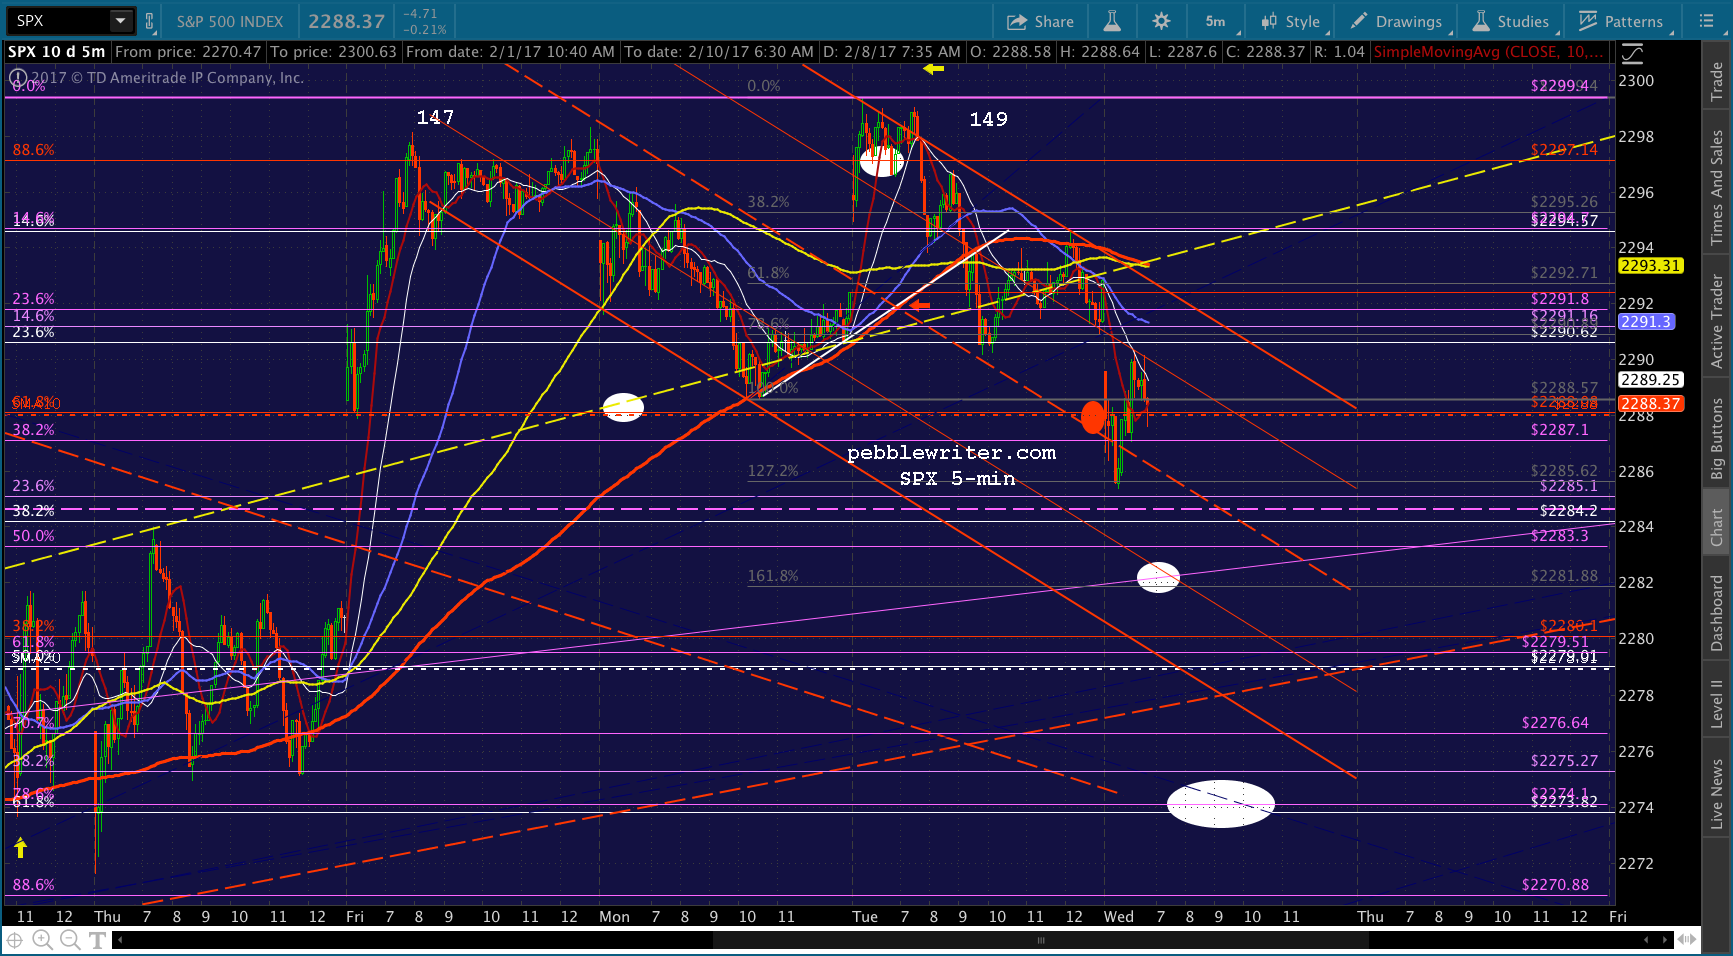
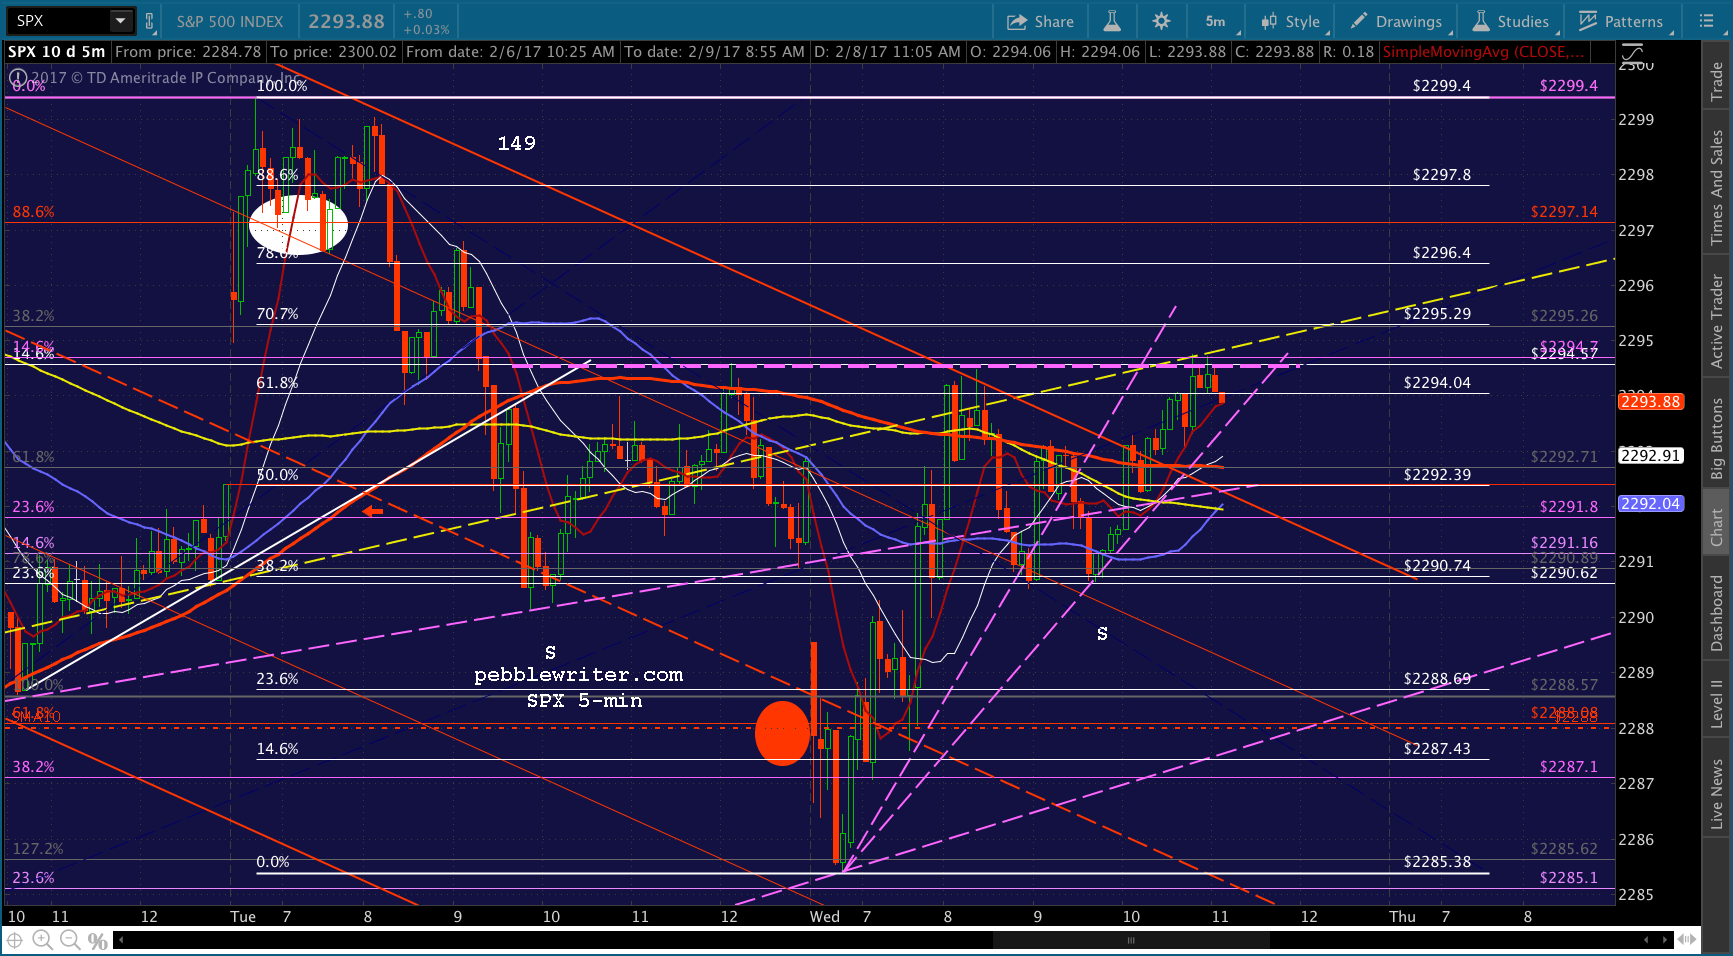
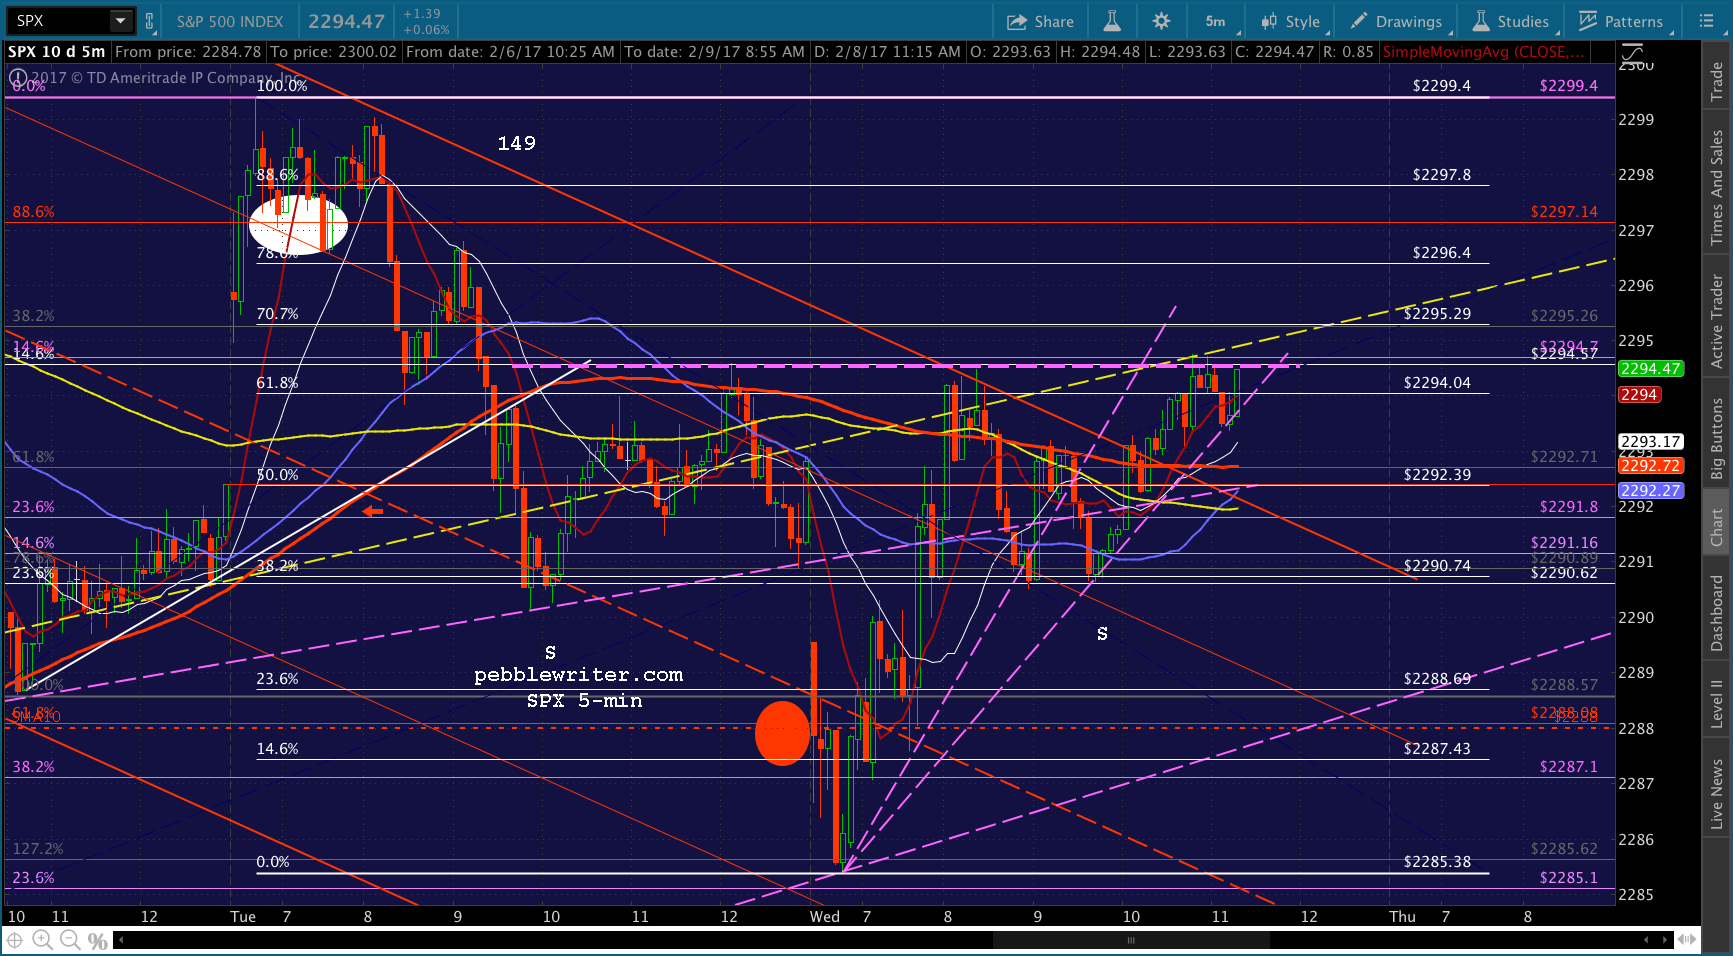
Our targets for SPX remain unchanged from yesterday, which are essentially the same from last week. I’ve plotted a few of the many potential targets, but the full list includes horizontal support at 2285, the 1.618 at 2281, the purple .618 and SMA20 at 2279, and the white .618 at 2273. In the end, it will depend on where CL gets a bounce, and when they pull the plug on VIX’s rise.
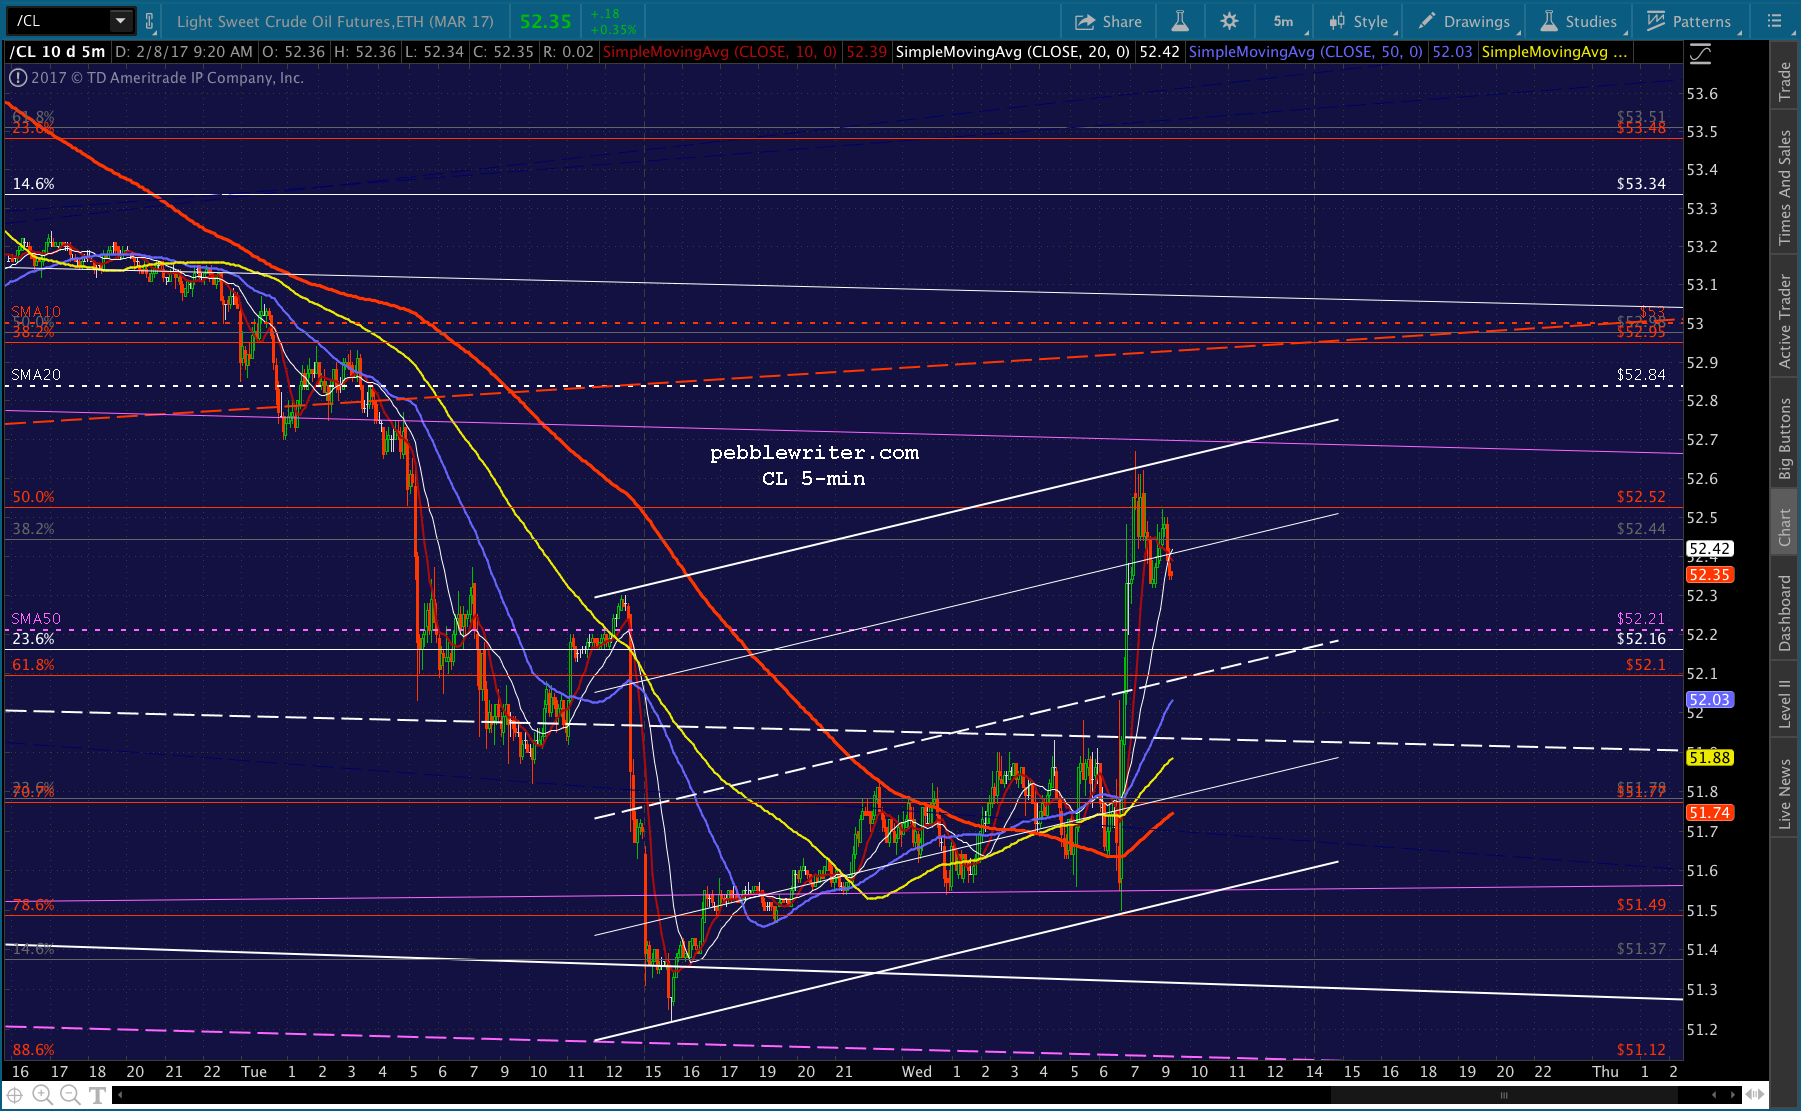
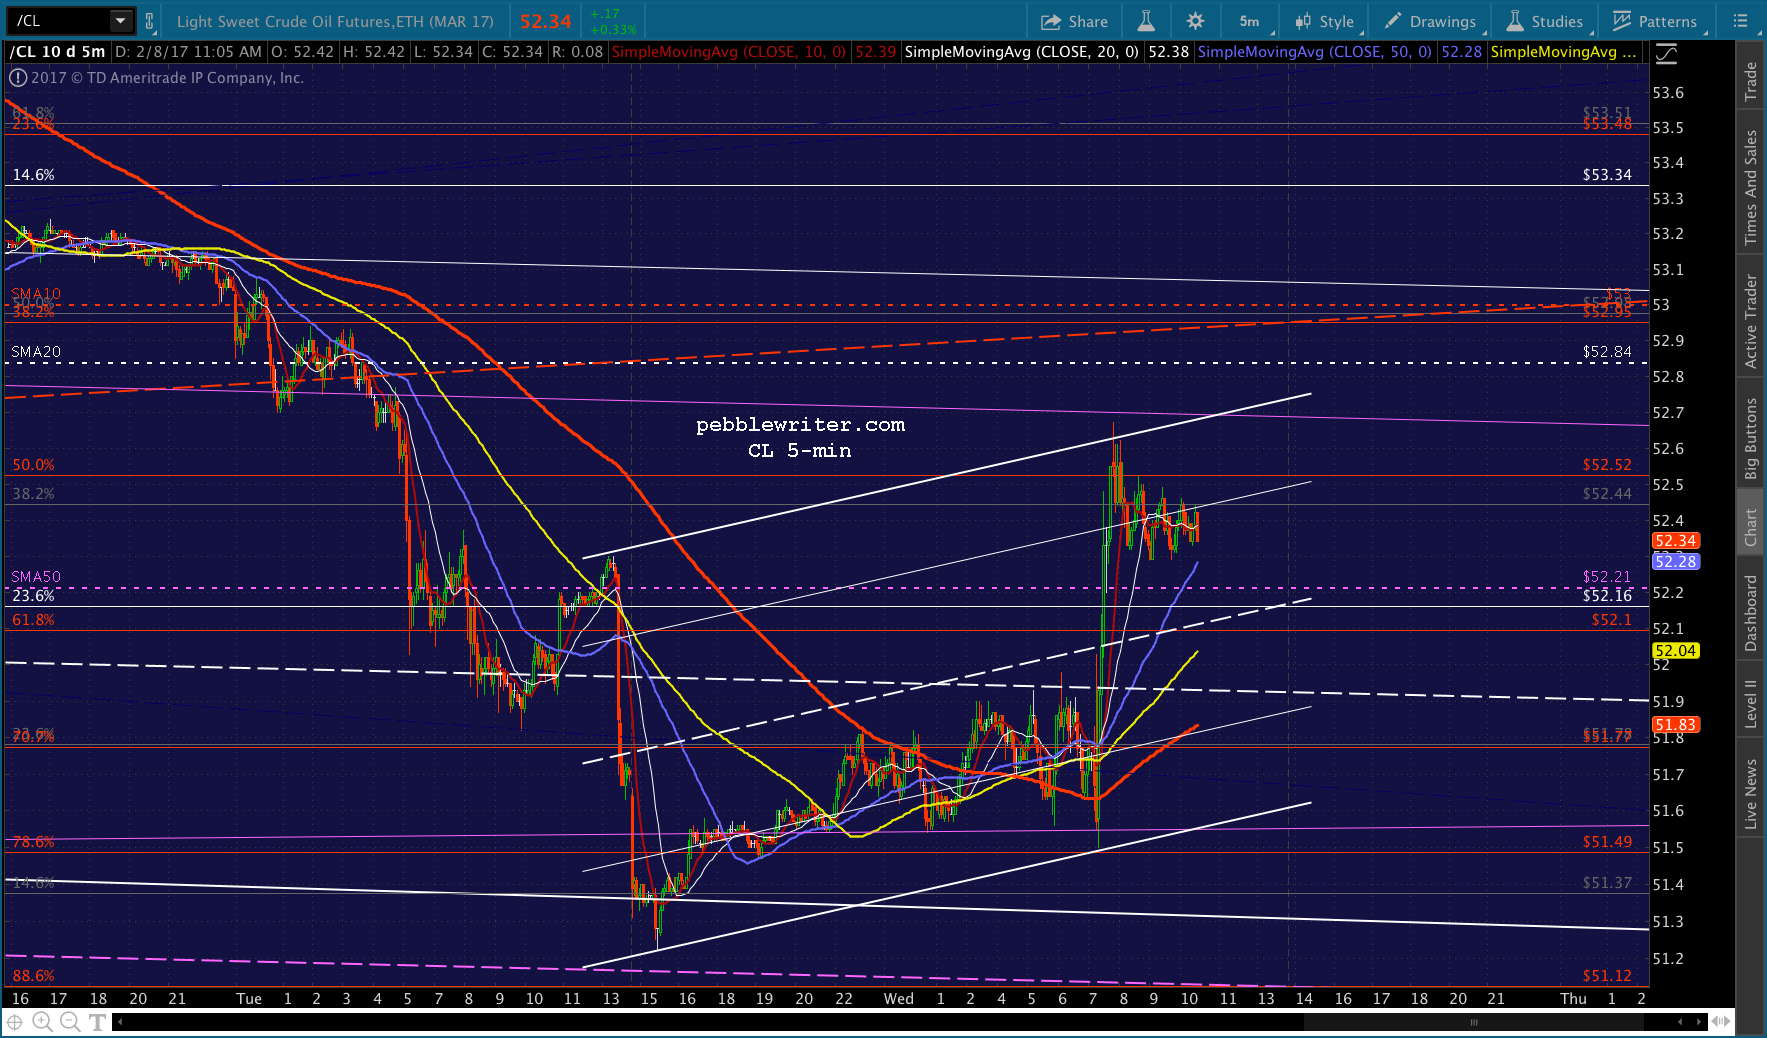
CL certainly appears headed for sub-50. If we expand the falling white channel that guides it to 49.9 to include the Dec 15 lows, we get a legit looking path to the SMA200 — currently at 48.01 and rising. This gives us a target of 48.47 — the red 1.618 and purple channel midline.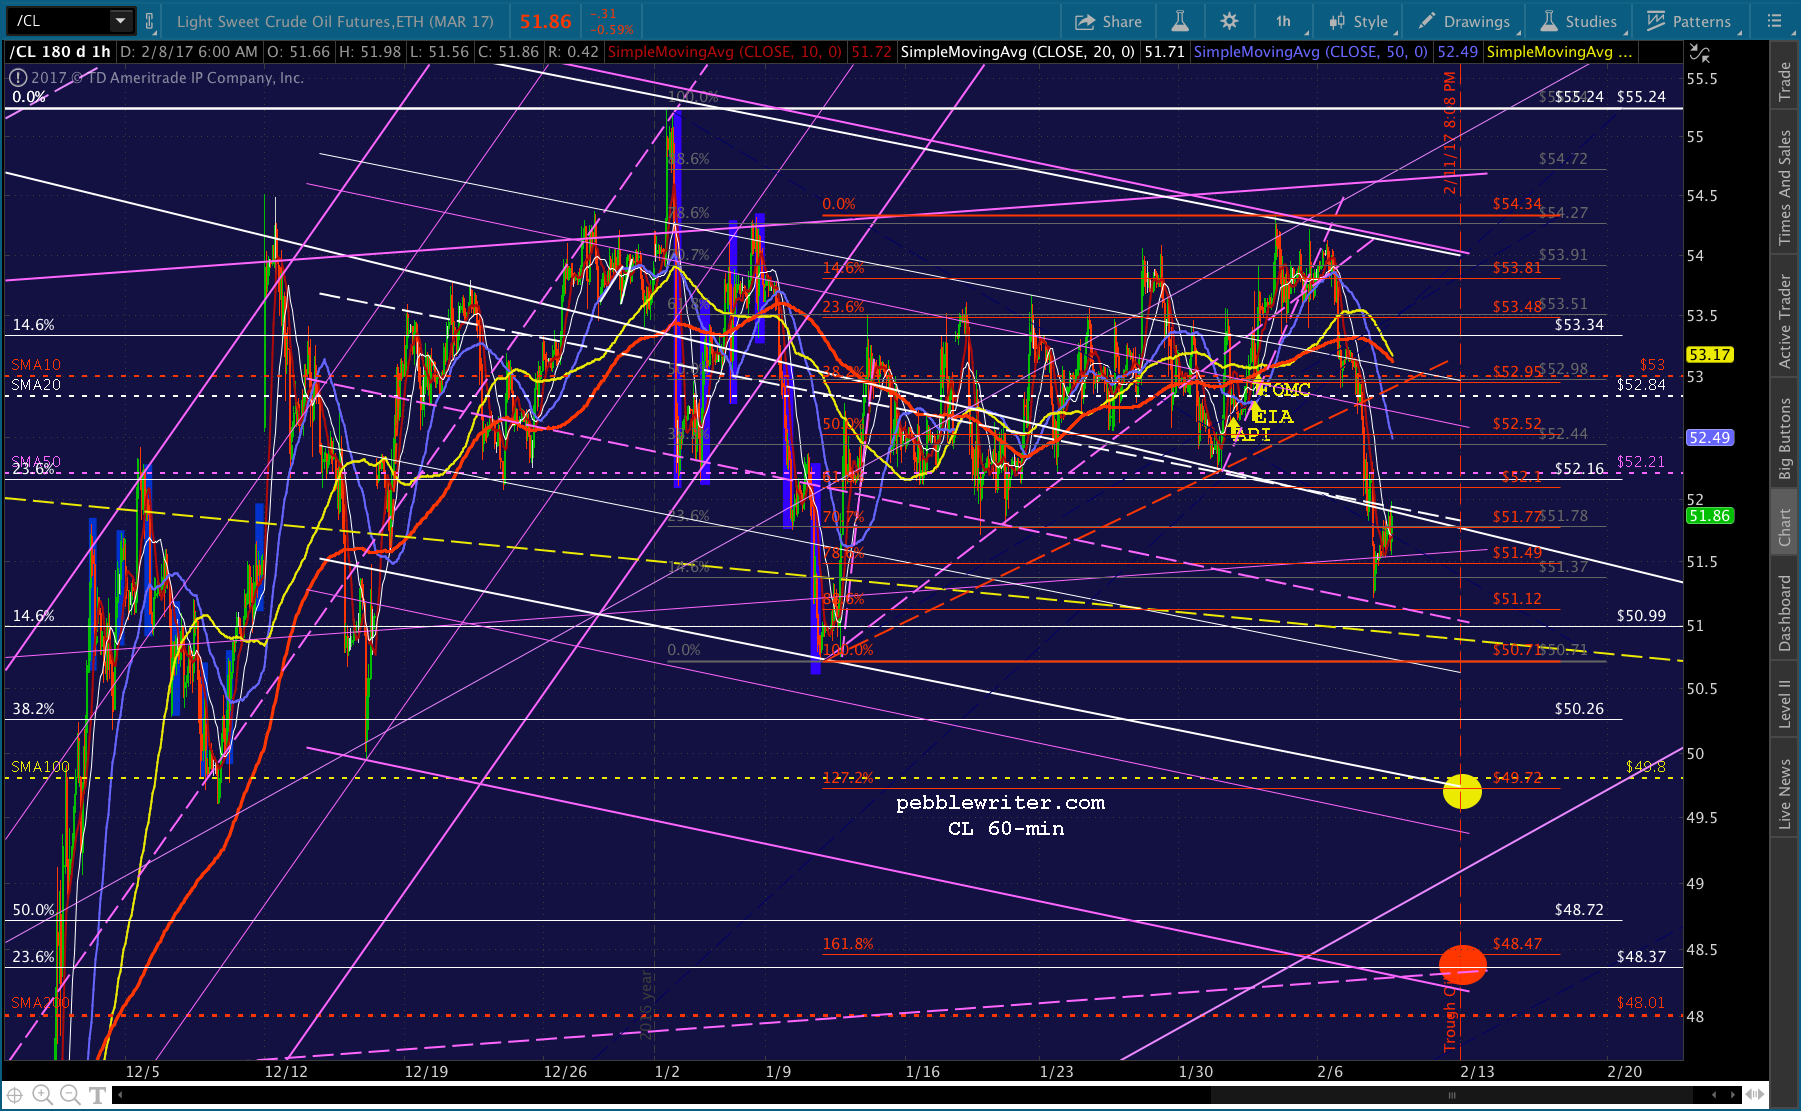
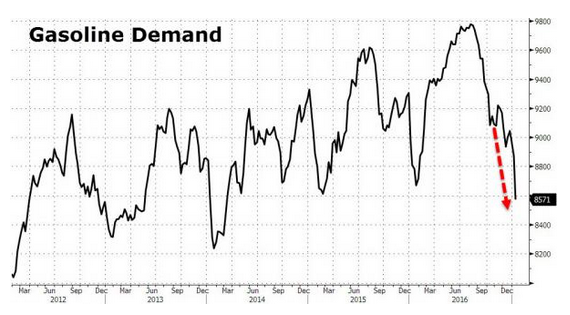
This obviously doesn’t come close to Feb 2016’s lows at 26.05. But, note what’s going on with gasoline — which is the factor that matters most in trying to suppress CPI.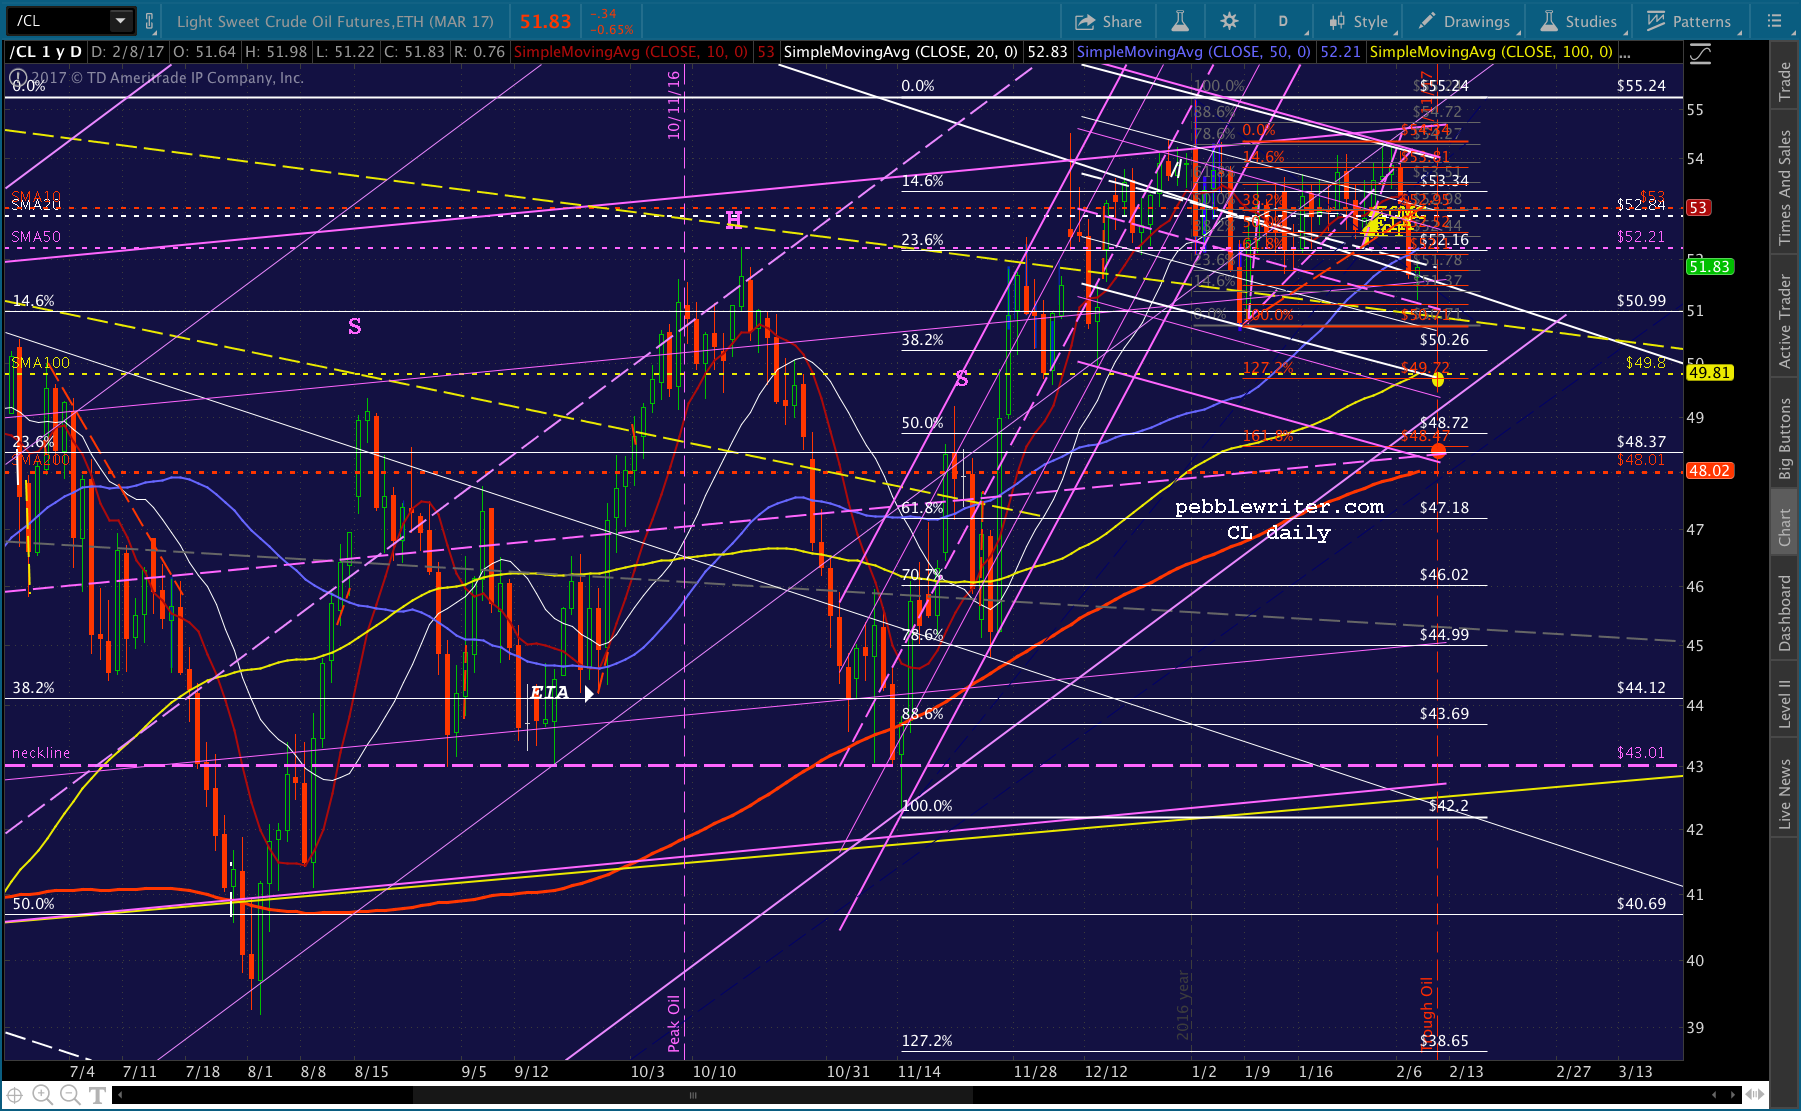
Yesterday, Zerohedge reprinted part of a Goldman report on gasoline that was very interesting reading. The full article can be found at Goldman Stunned by Collapse in Gasoline Demand: “This Would Require a US Recession.”
The key takeaway was that the decline in demand has produced a lower low for the first time since Dec 2013. Goldman maintains that the data is faulty. But, does it really matter? The fact remains that demand, and thus prices, are slumping.
Looking at the RBOB chart, there’s loads of downside if it drops through the SMA200 to which it’s currently clinging.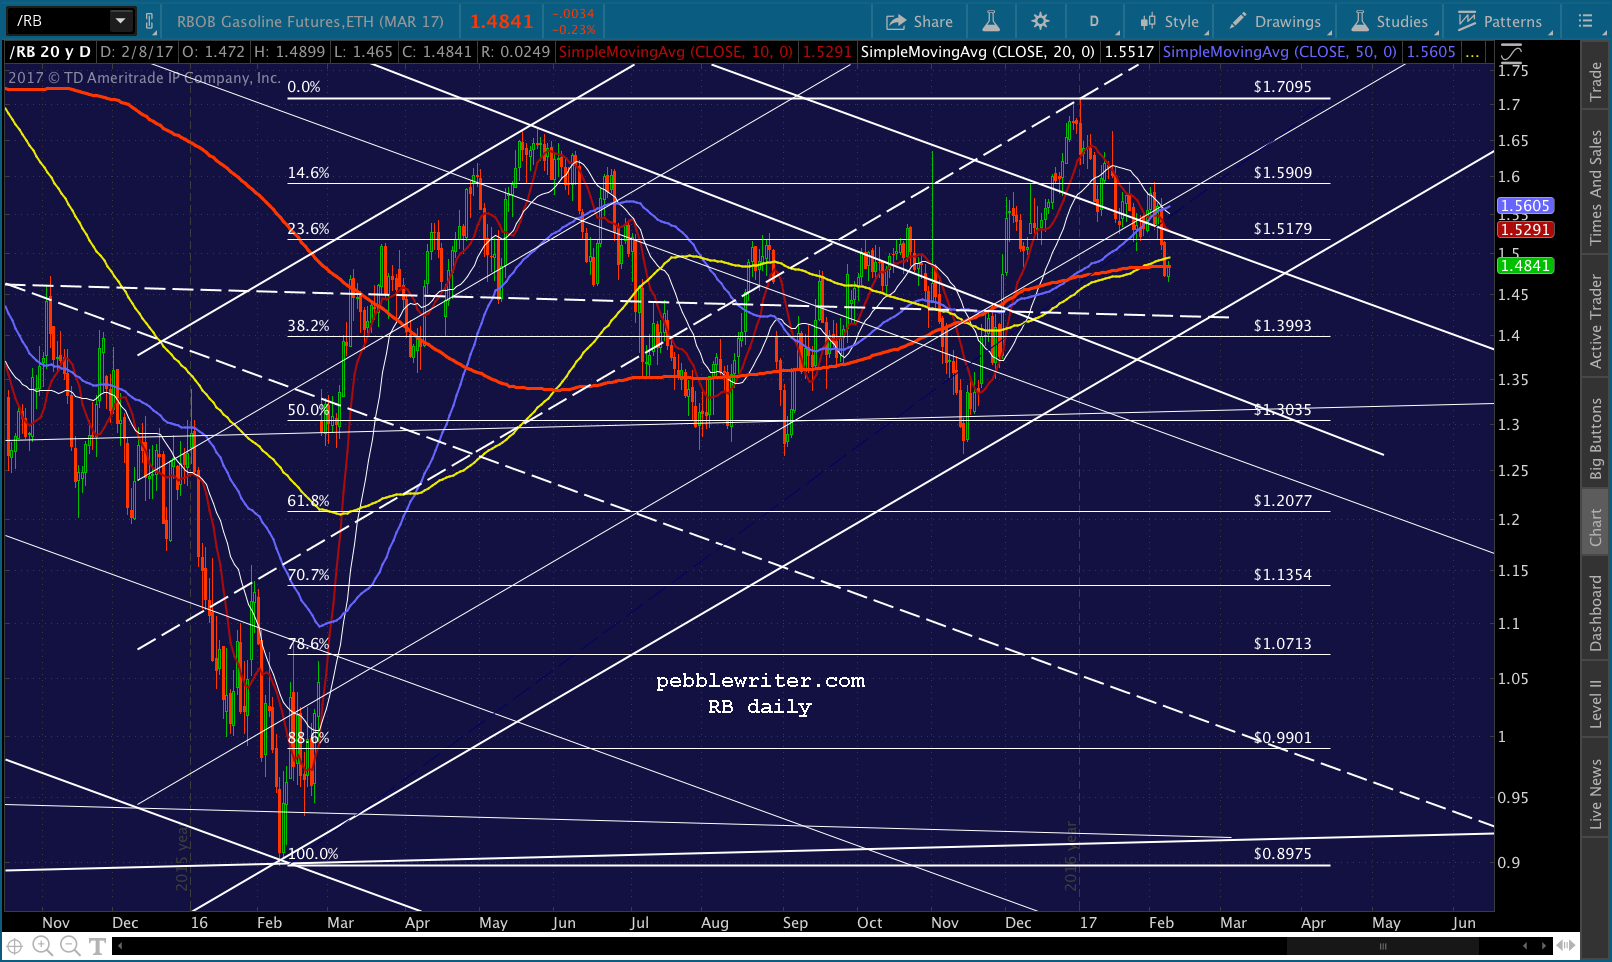
Most notable is the huge gap which hints at a drop to 1.155. And, that’s barely more than a .618 retracement of the spike off the Feb 2016 lows.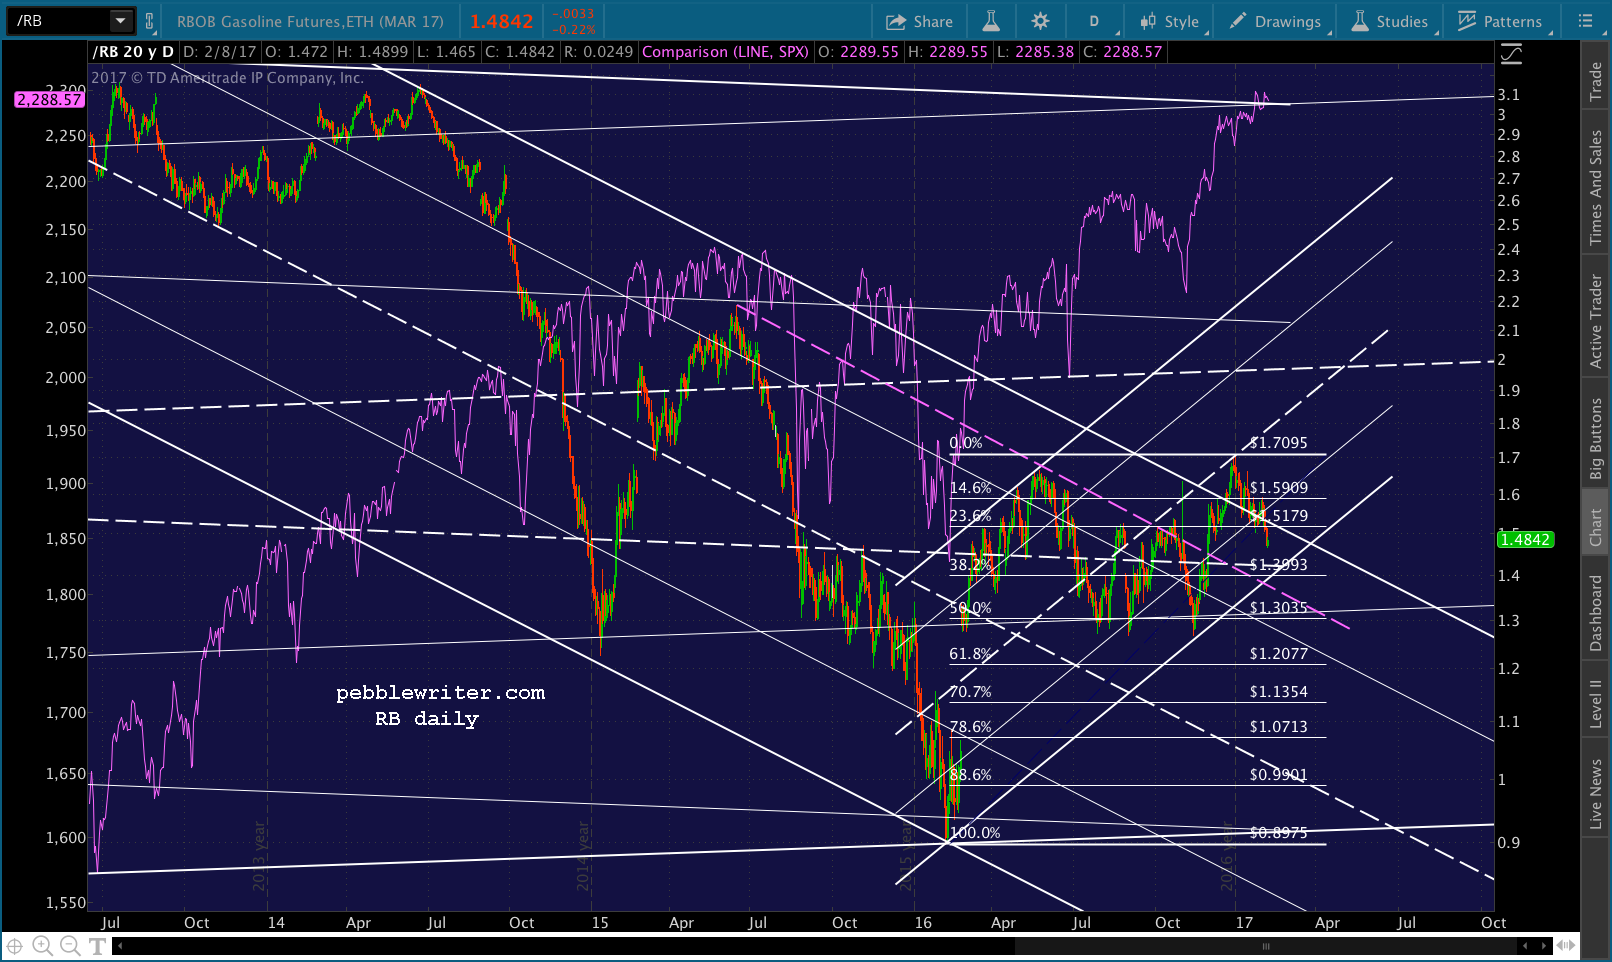
Bottom line, my thesis remains as it was last October. The FOMC is caught between a rock and a hard place. They can leave oil and gas alone, and see CPI spike to a level that demands more hawkish policy — which should tank stocks. Or, they can crash oil and gas prices in the next few days/weeks — which should also tank stocks.
But, the Goldman article makes me wonder if the disconnect between oil and gas — as we discussed yesterday — could be stretched even more in the weeks ahead. It’s worth keeping an eye on.
We’ve seen VIX do a pretty good job of preventing big sell-offs. If a rate rise seems imminent, we should see the dollar strengthen and, potentially, a breakout in USDJPY — which would help. But, this is uncharted territory. The only safe bet, in my book, is shorting oil and gas.
I mentioned SCO, an ultrashort crude ETF, back on Jan 18 when it was at 32. It just broke out today, and is currently trading at 34.61 – an 8% gain since then and a 15% ytd gain. If CL breaks down appreciably, there’s plenty more where that came from.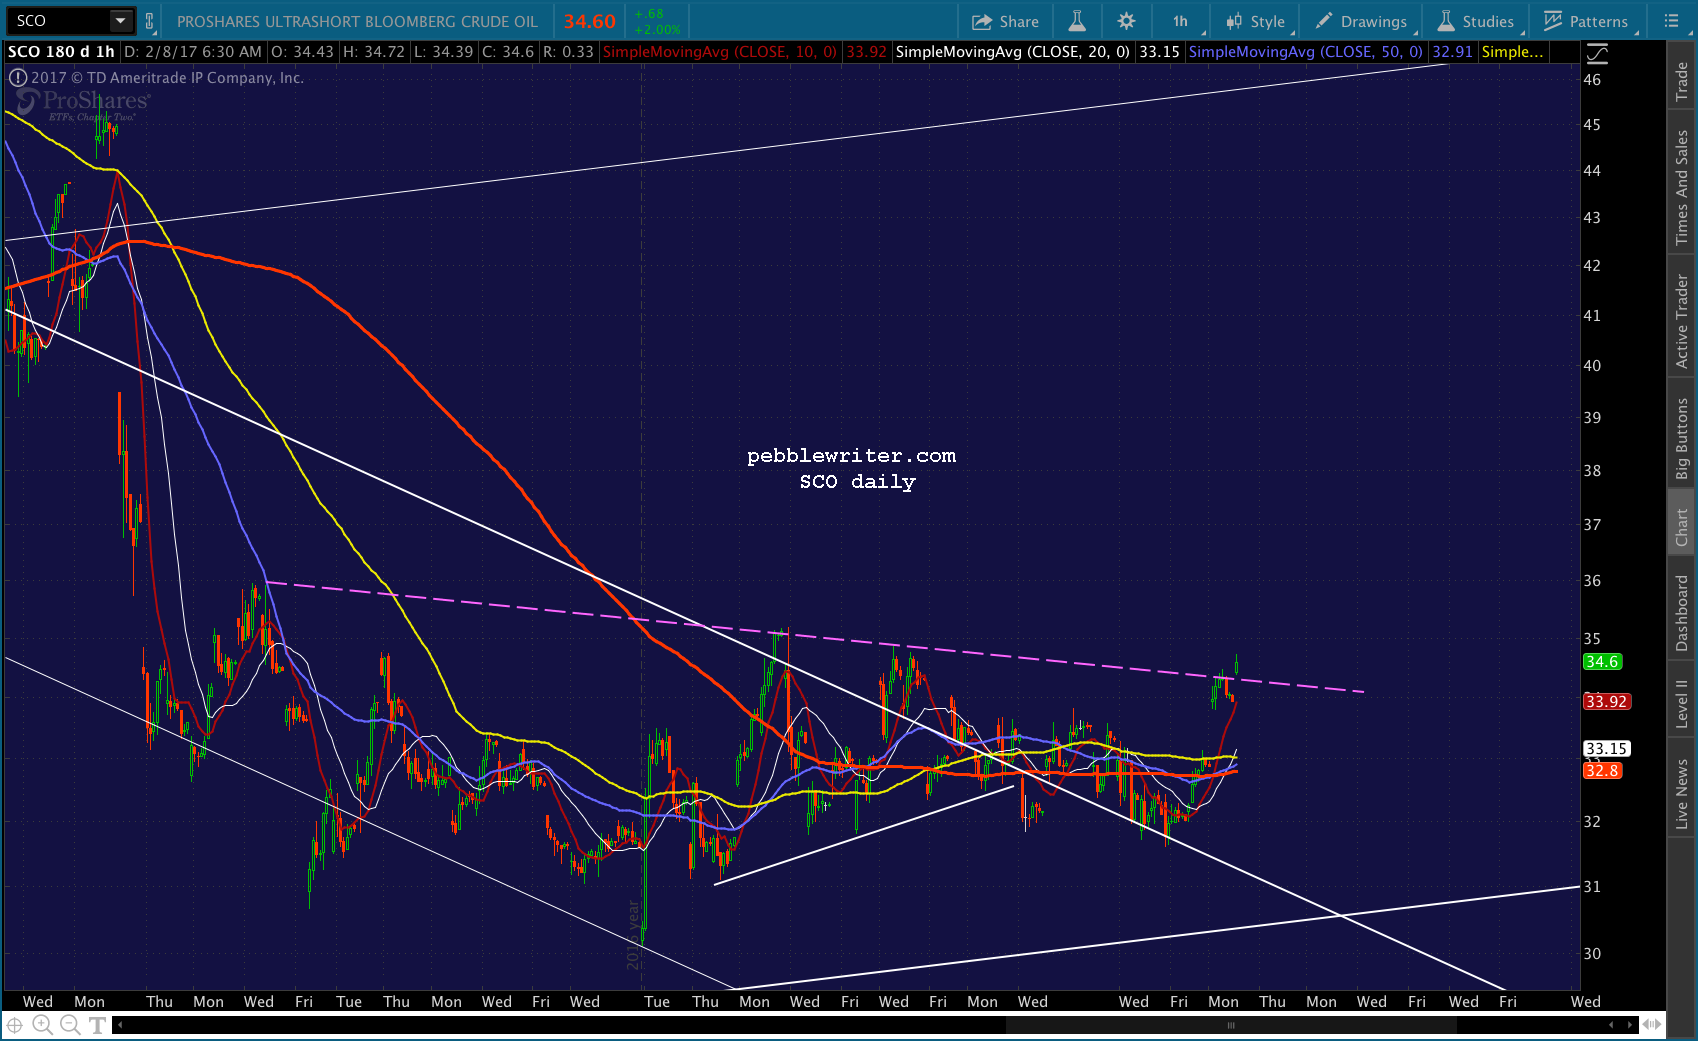
UPDATE: 10:35 AM
EIA just confirmed yesterday’s API inventory report (+14.227), reporting a 13.8 million barrel increase in crude from the previous week. Gasoline inventory was reported as decreasing by 0.9 million barrels, in stark contrast to API’s data showing a 2.9 million barrel build. Someone’s fibbing.
Time for VIX to break down…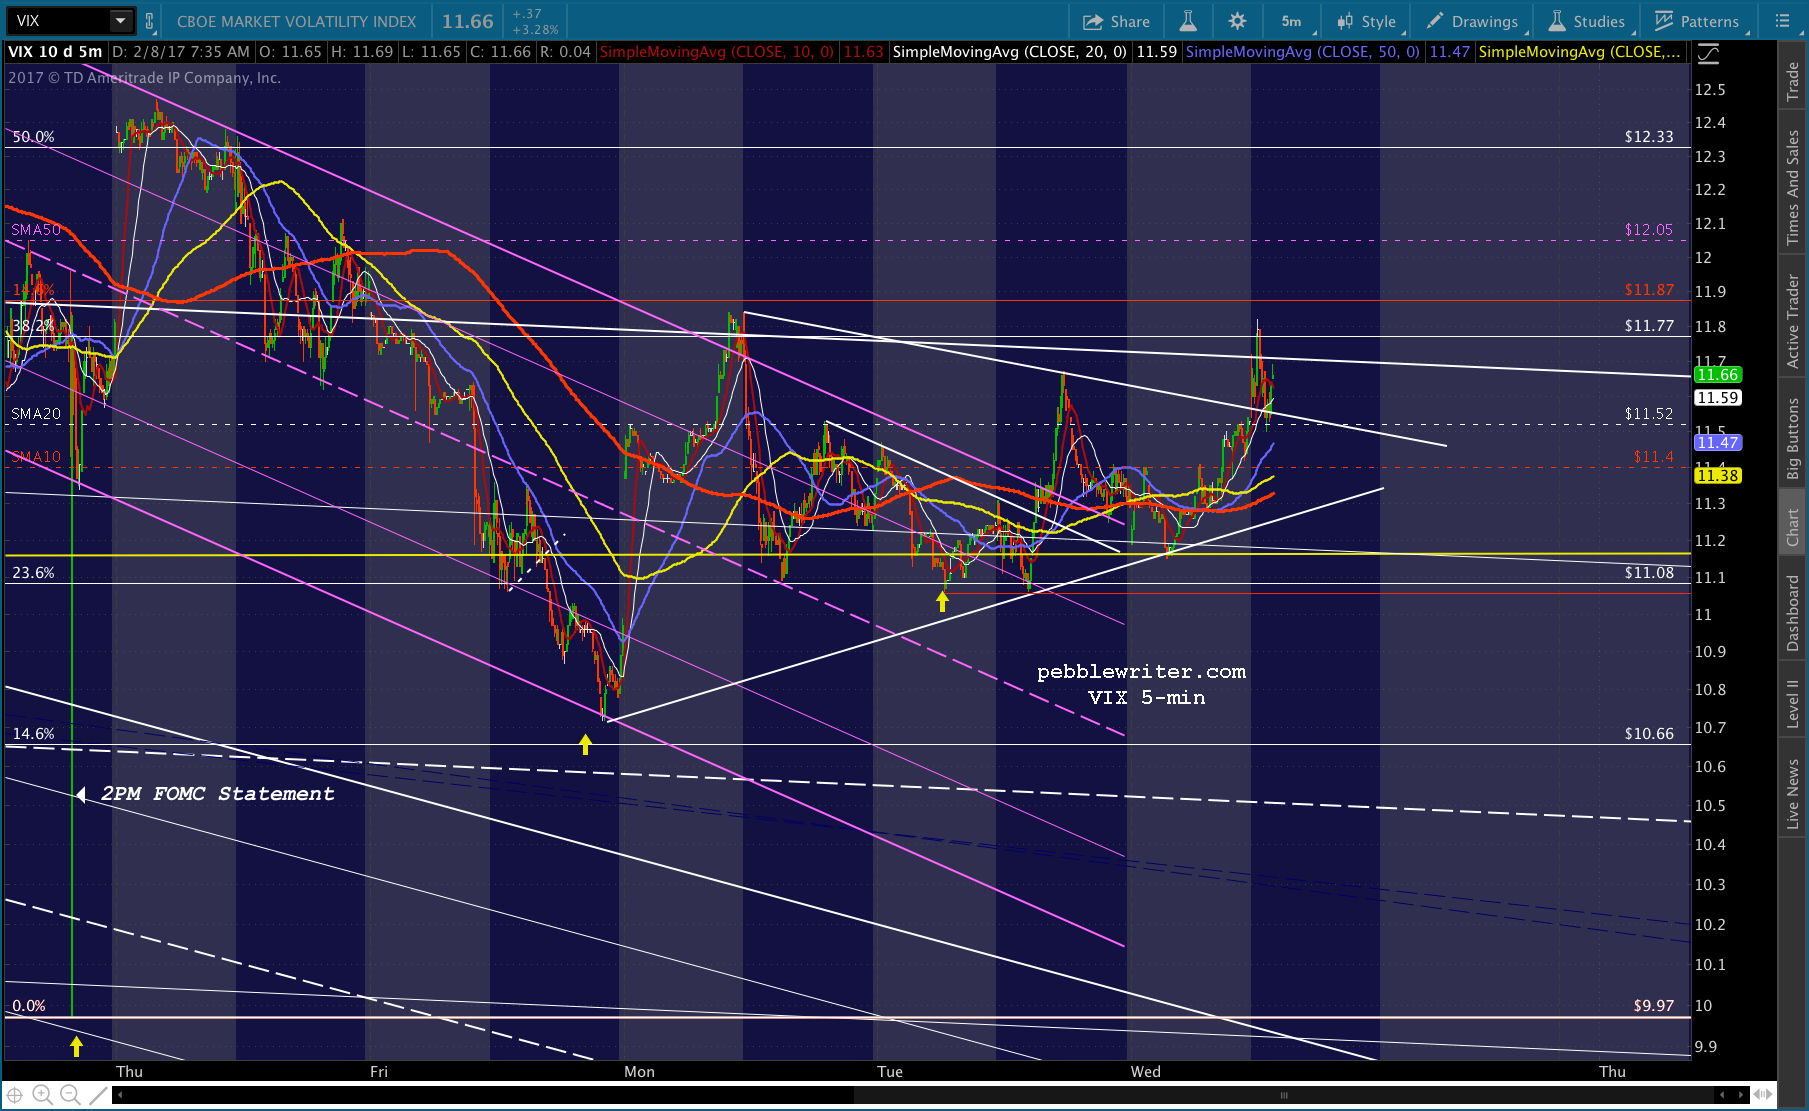
UPDATE: 11:03 AM
I just discovered that several updates, starting with this one, were made to yesterday’s post instead of today’s. My apologies for the error.
* * *
VIX collapsed after the inventory report, re-entering the triangle and now breaking down below the SMA5 200. If it drops through the triangle at 11.26ish, SPX should pop through the yellow midline. I’d cover on any sustained push above the SMA5 200 at 2293.33 and wait for a drop back through to re-short.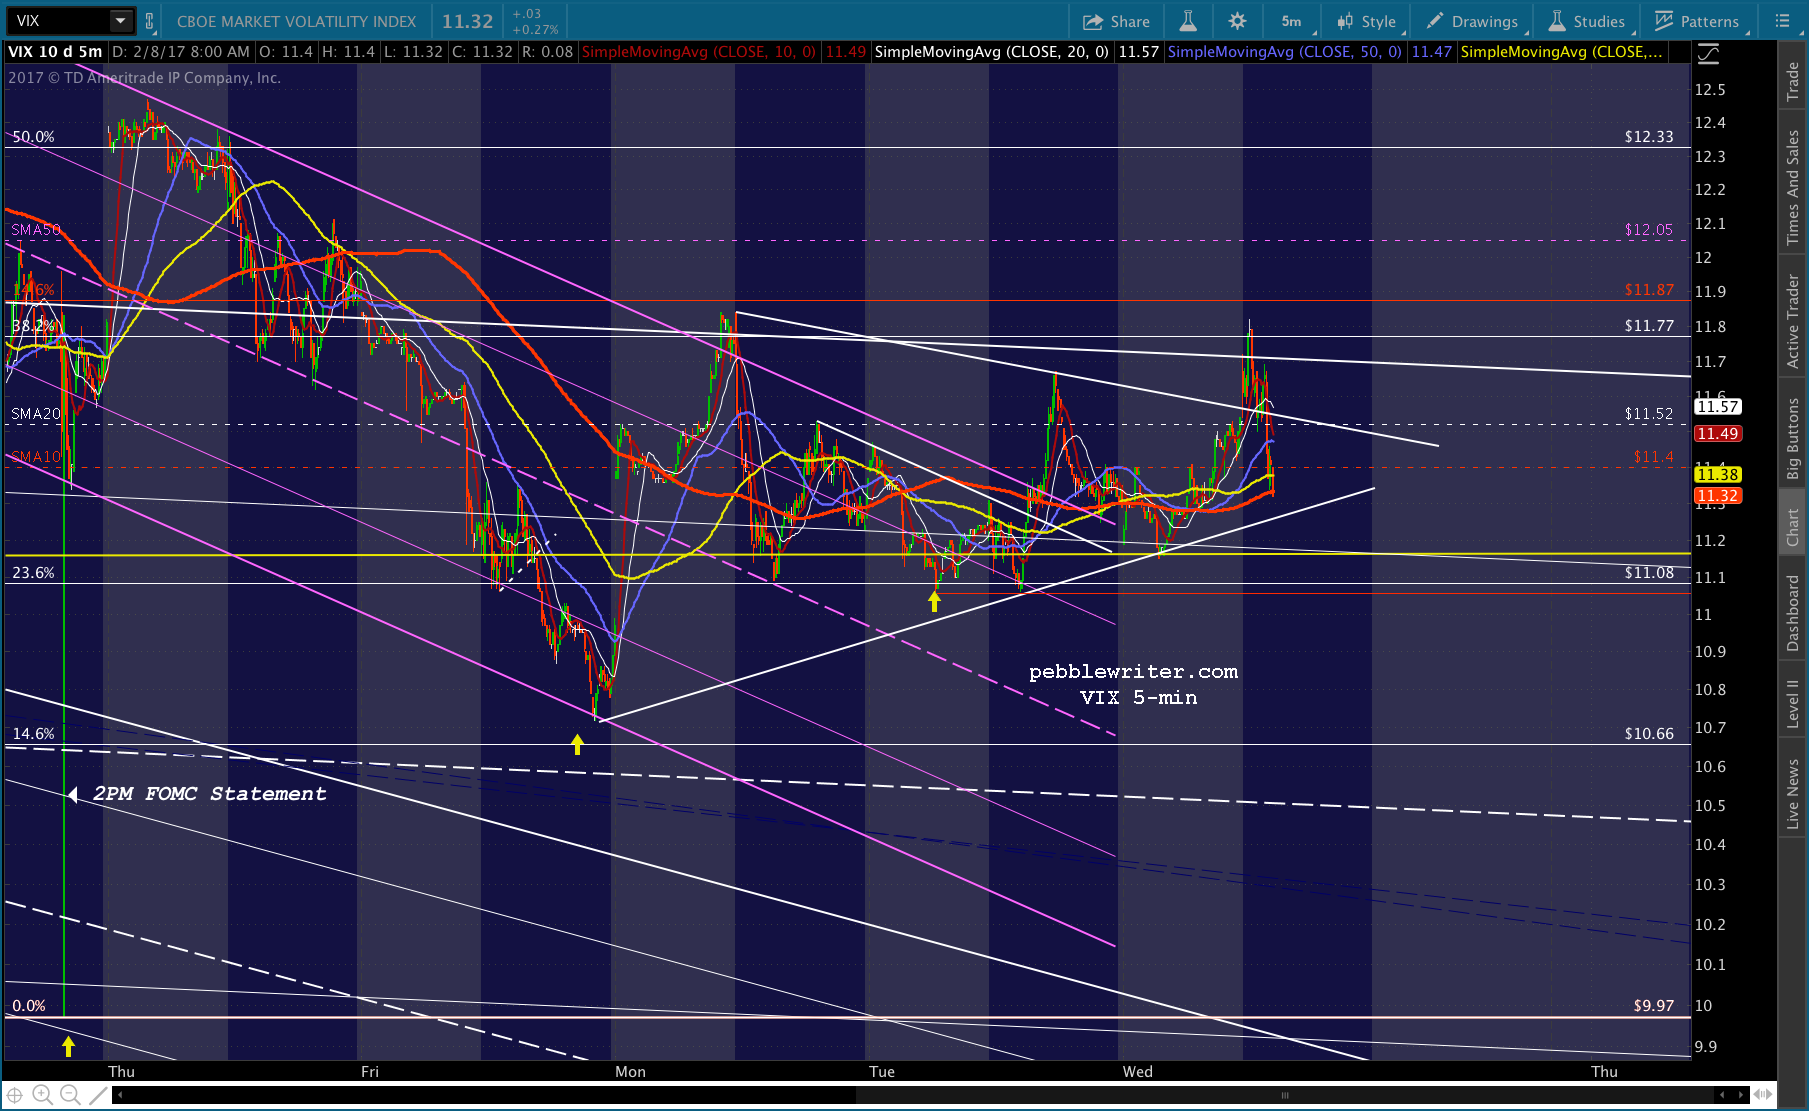
CL just completed a flag pattern at a key purple channel line (the .786) and should reverse here at 52.67. Next stop from a channel standpoint, the .236 currently at 49.5ish — just below our yellow target at the SMA100.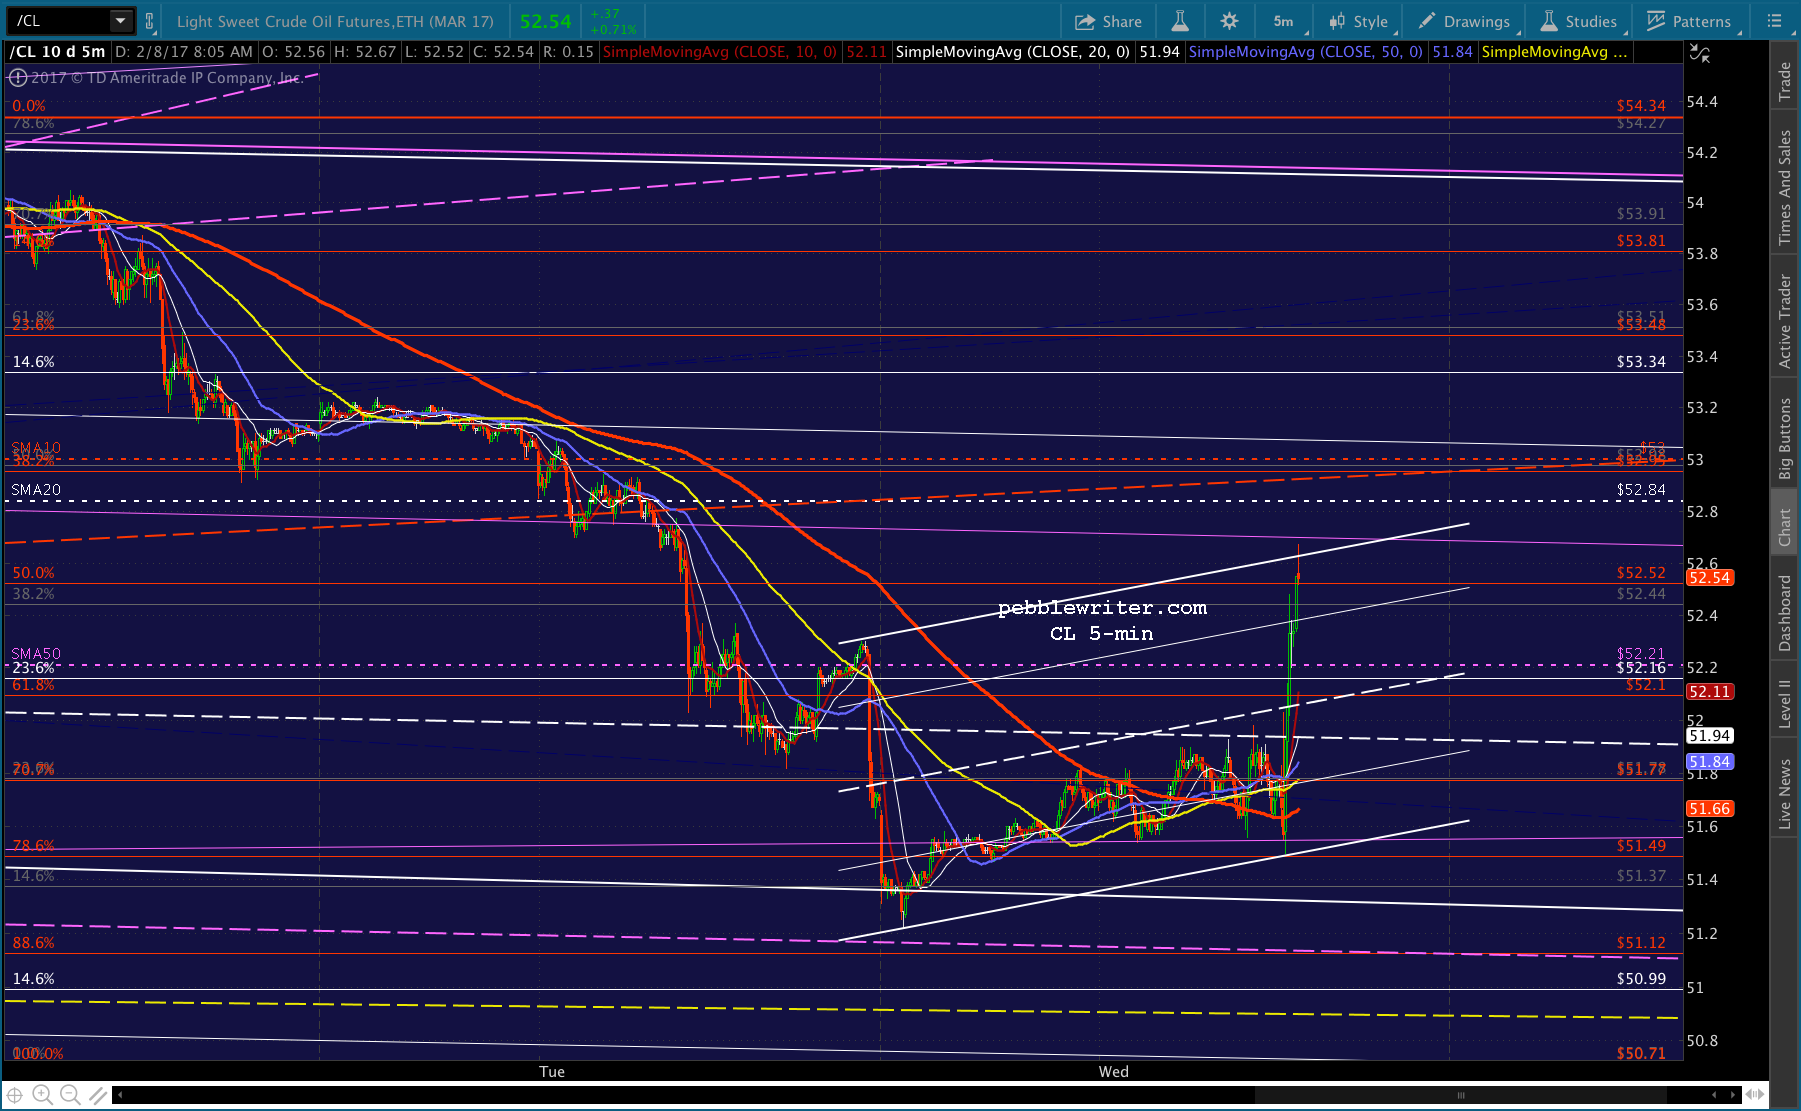
The bounce off its midline confirms the legitimacy of the purple channel — though it also underscores how strong the forces are which are working to save CL from any serious downside (unless they’re using this algo bounce to position themselves for the next leg down.)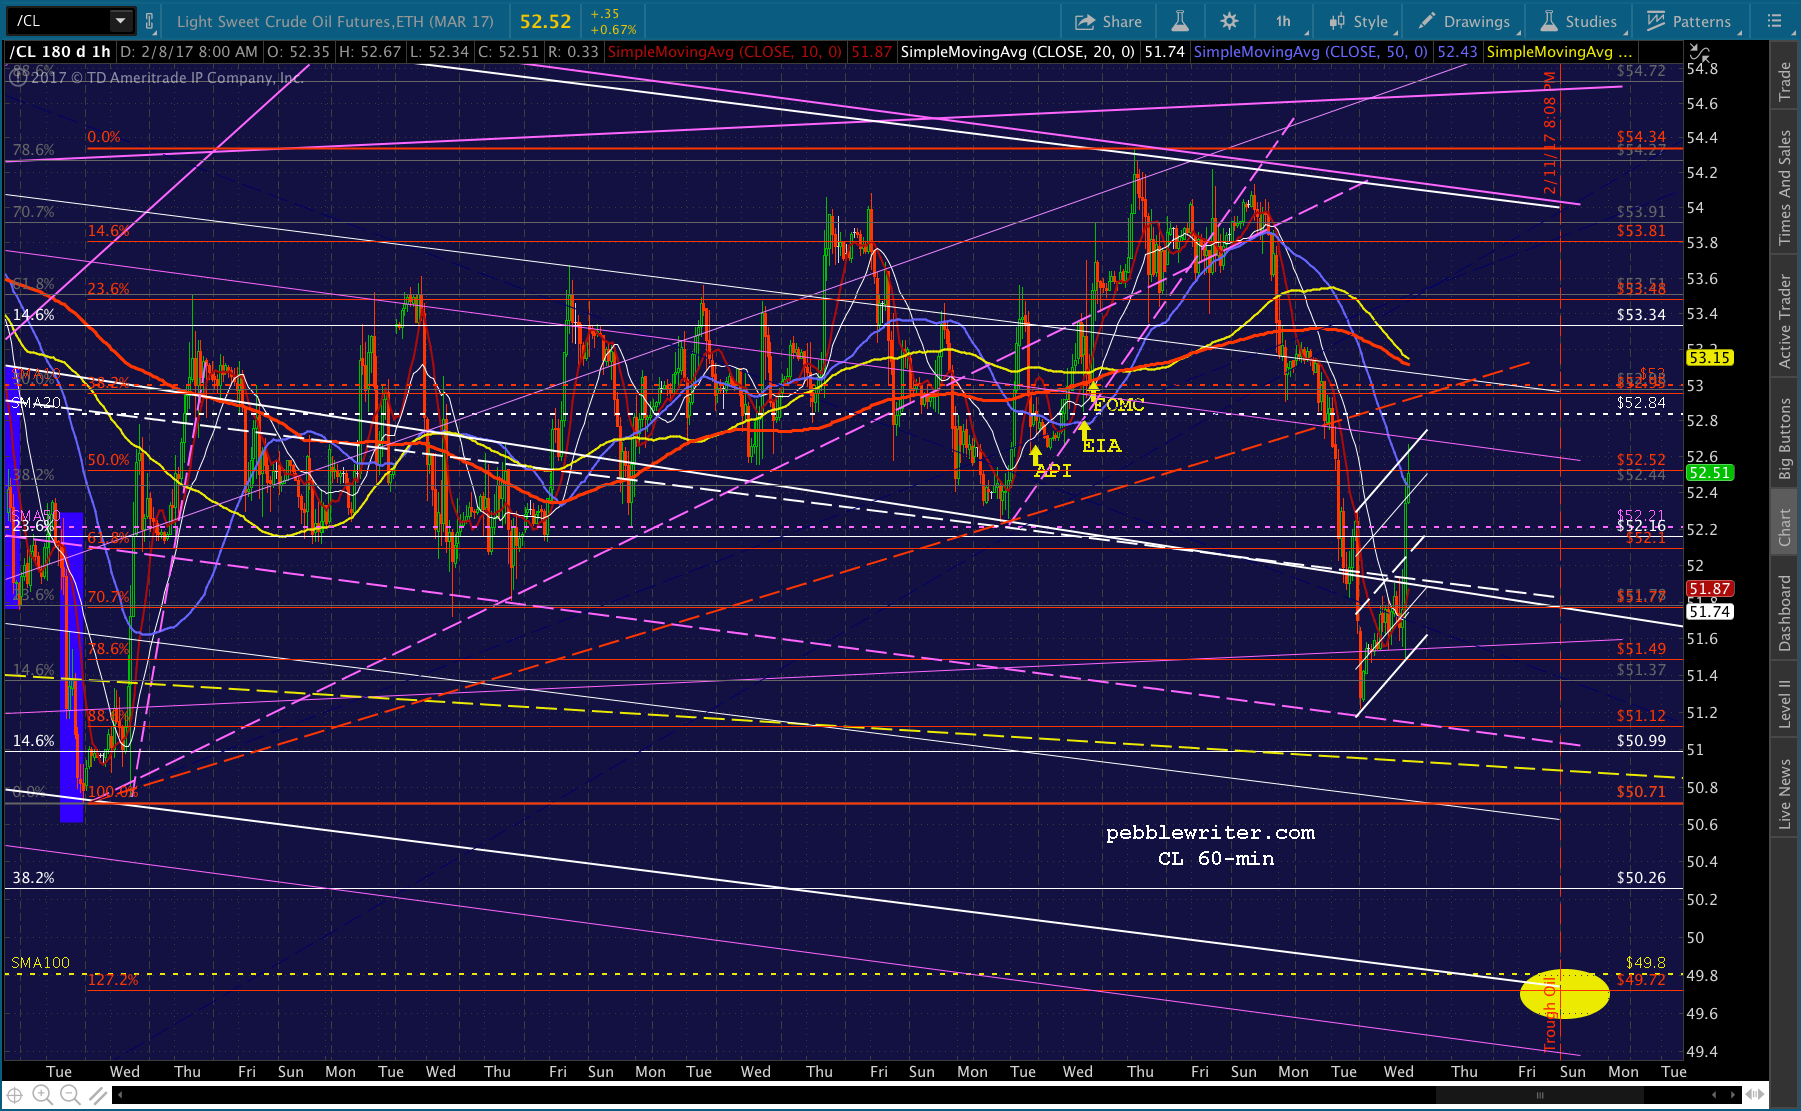
SCO has dropped back through the TL it broke out of and might just close the gap at 33.13. At 33.50, I see this as a nice buying opportunity.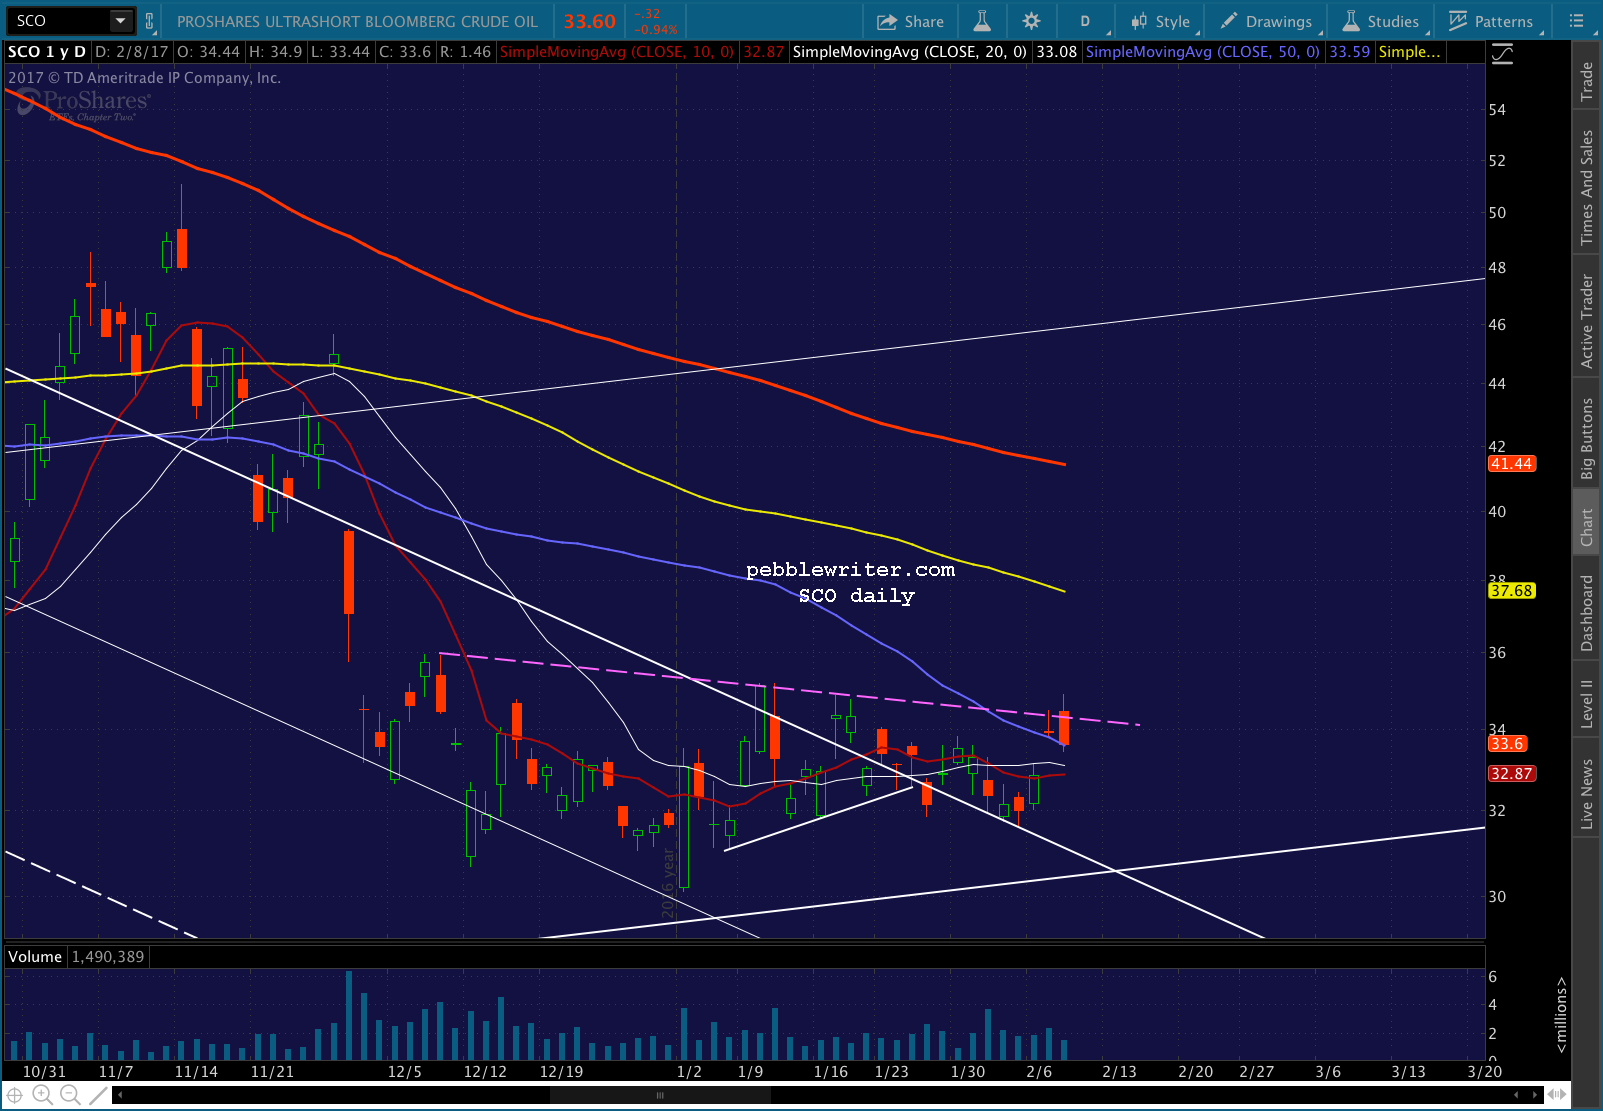
UPDATE: 11:19 AM
SPX is stalling here at the yellow midline. But, VIX is sitting right at the triangle bottom — threatening to break down if need be. 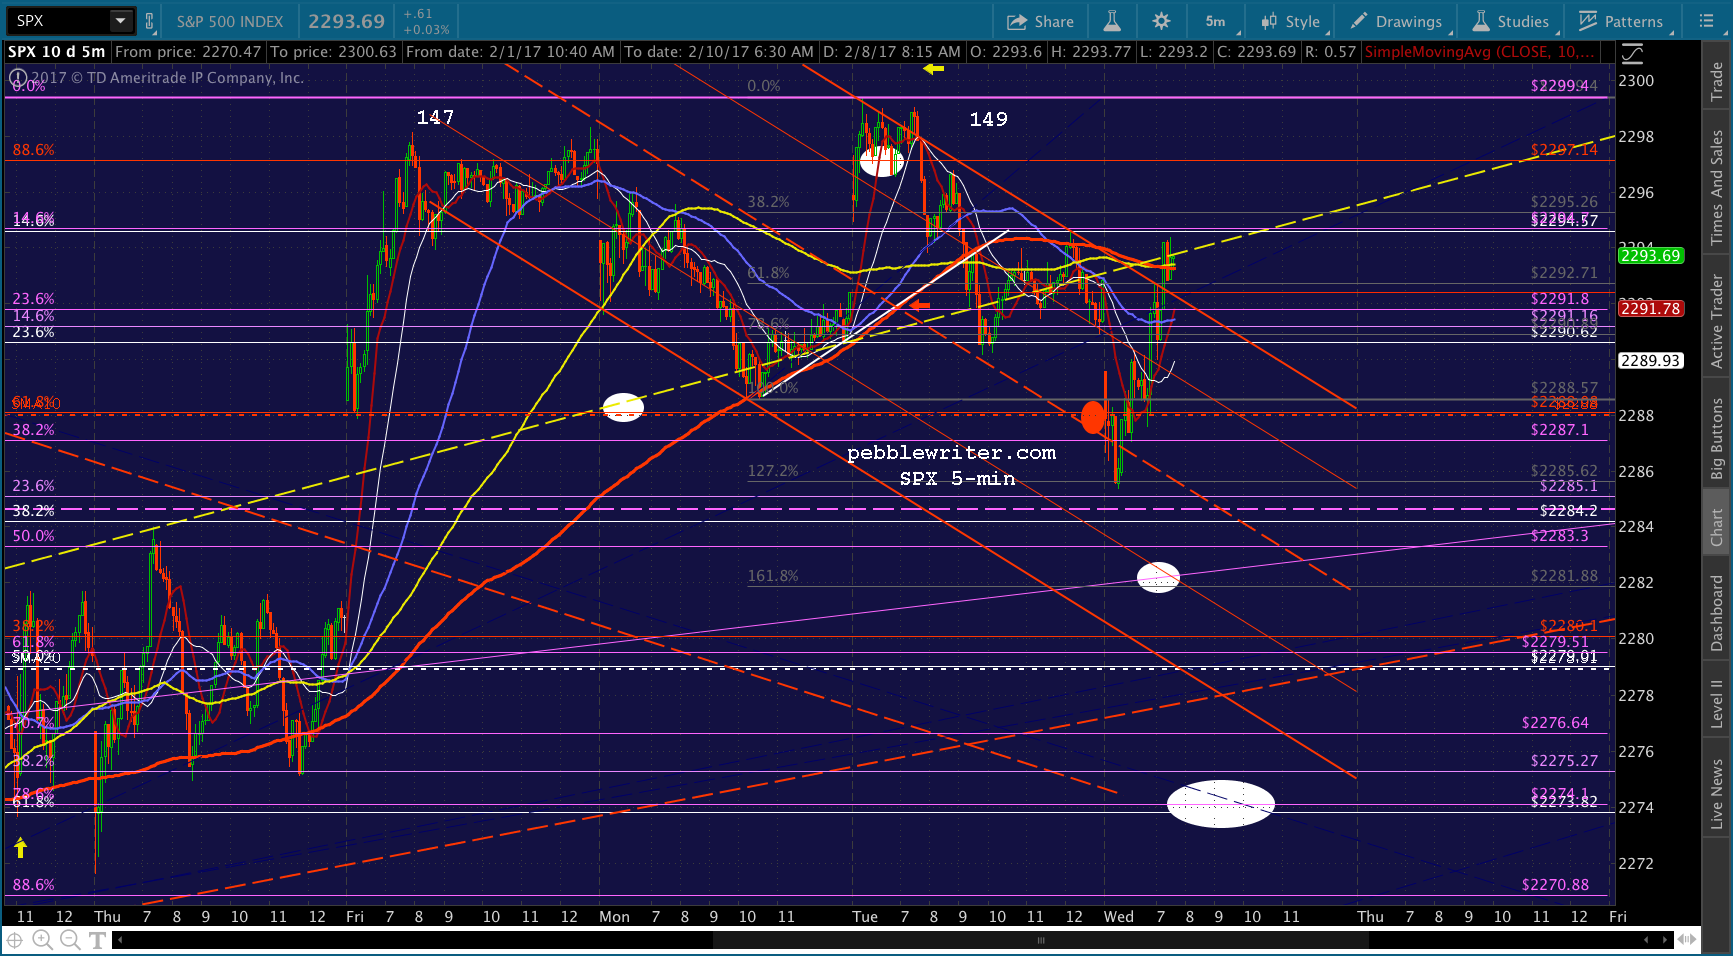
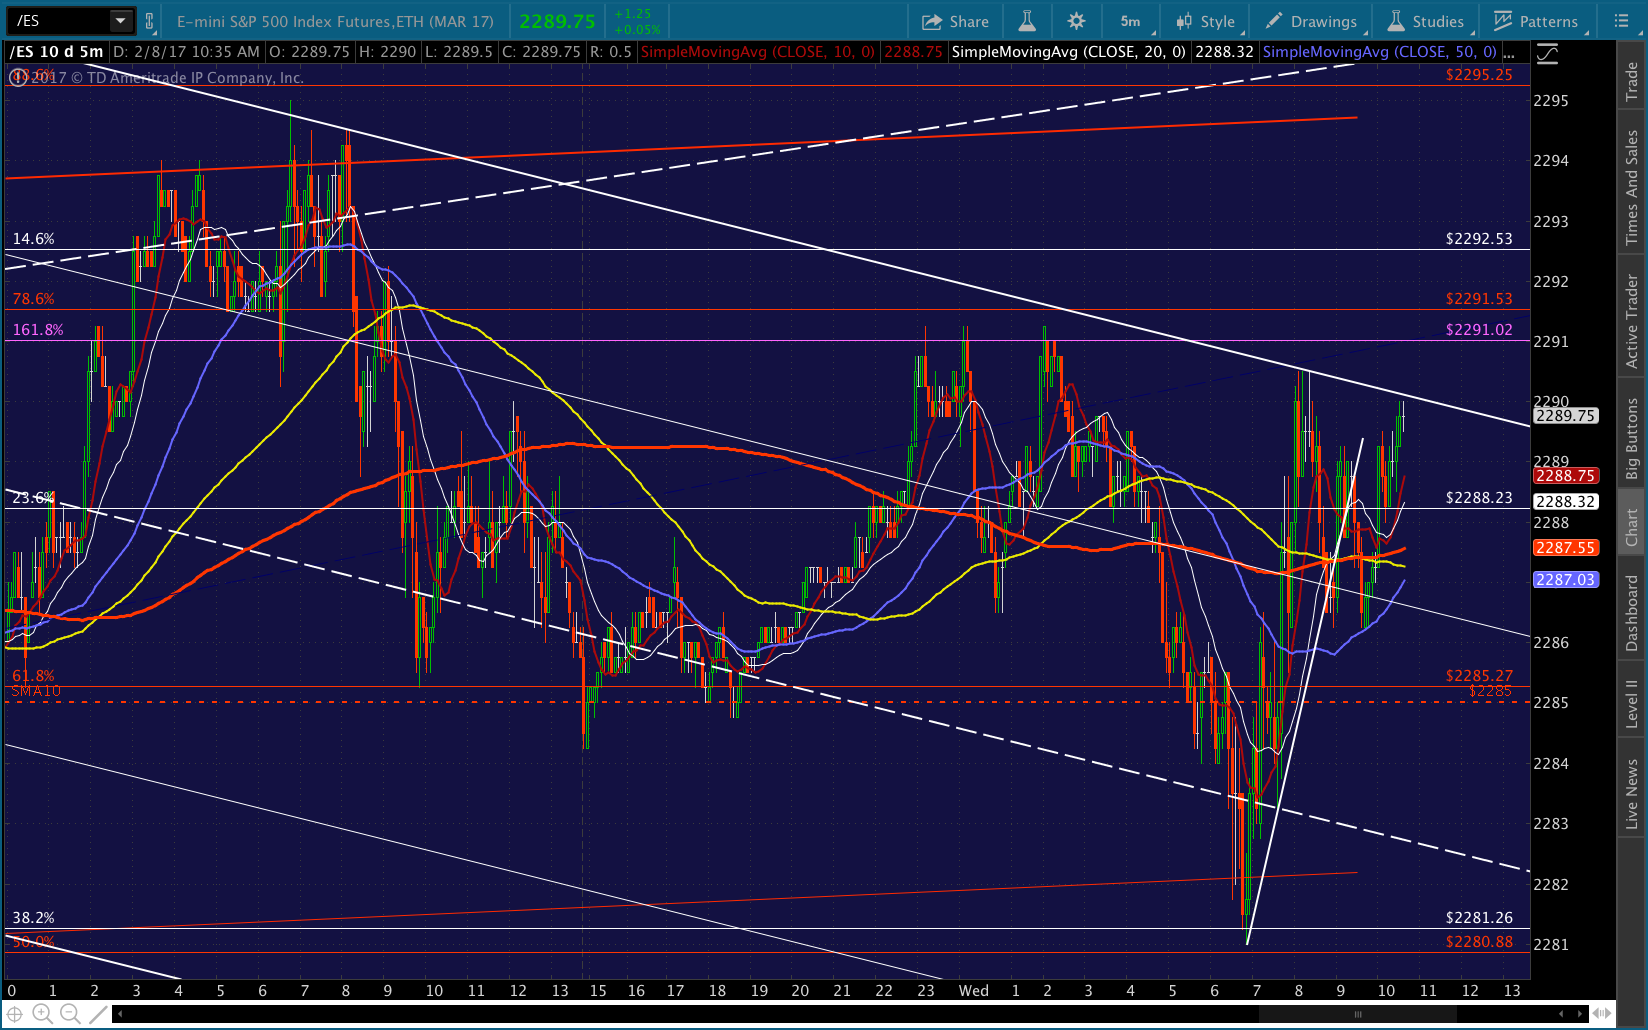
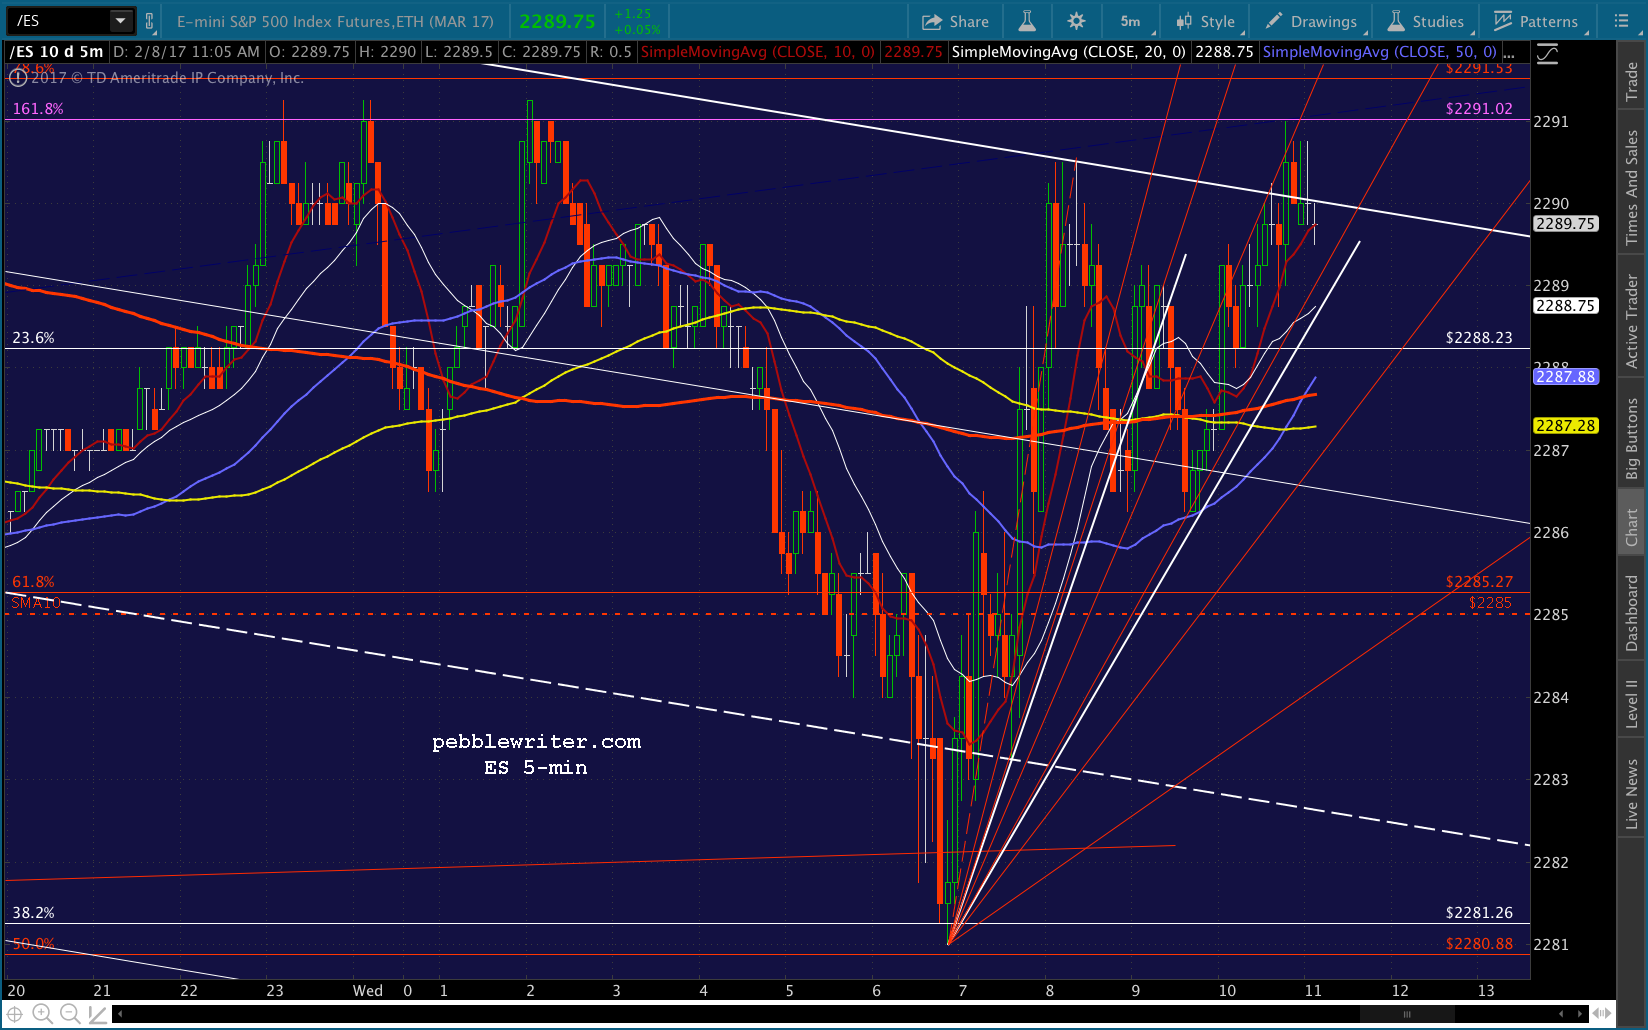
Perhaps the most telling chart: ES, which is right at channel resistance. Note the suggested, new white channel is parallel to the purple one it broke out of. SPX is slightly above the SMA5 200, but I’d stay short unless ES breaks out or VIX breaks down.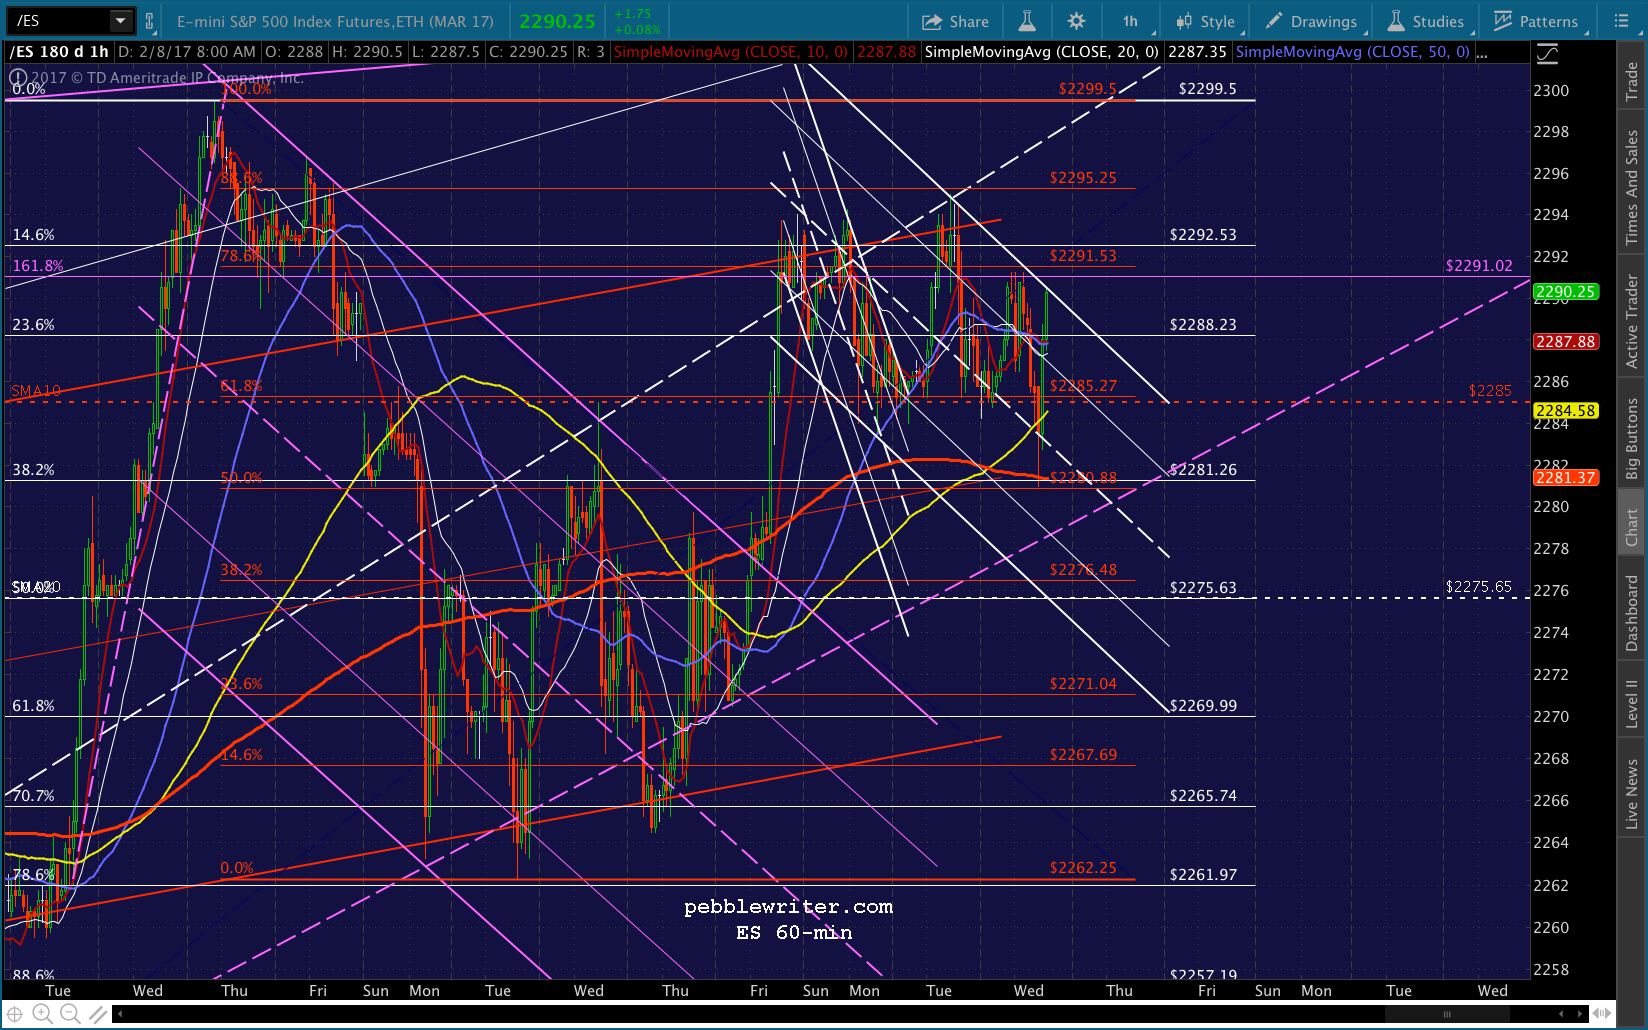
UPDATE: 12:17 PM
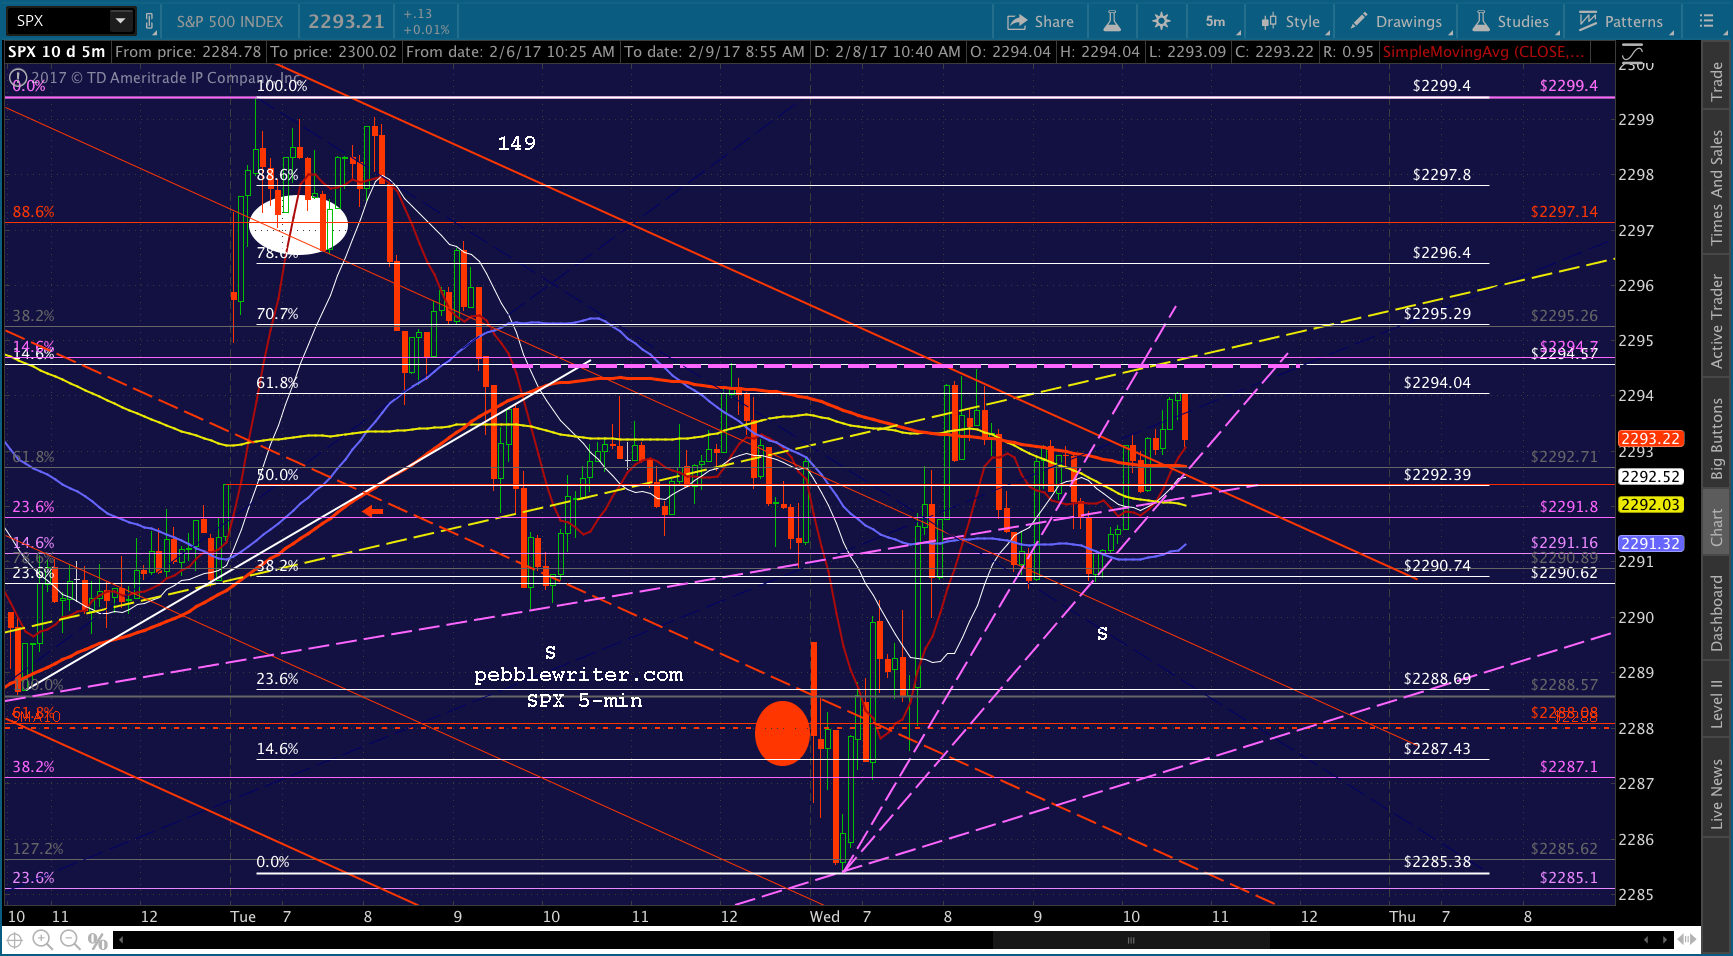
SPX started to break down, but VIX (big surprise) suddenly dropped through the triangle bottom — just enough to keep everyone guessing. SPX’s SMA5 10 just dipped below the SMA5 20 — so we should get a breakdown or a pop above the SMA5 200 in the next few minutes. Watching VIX very closely, as CL is breaking down and USDJPY is going nowhere.
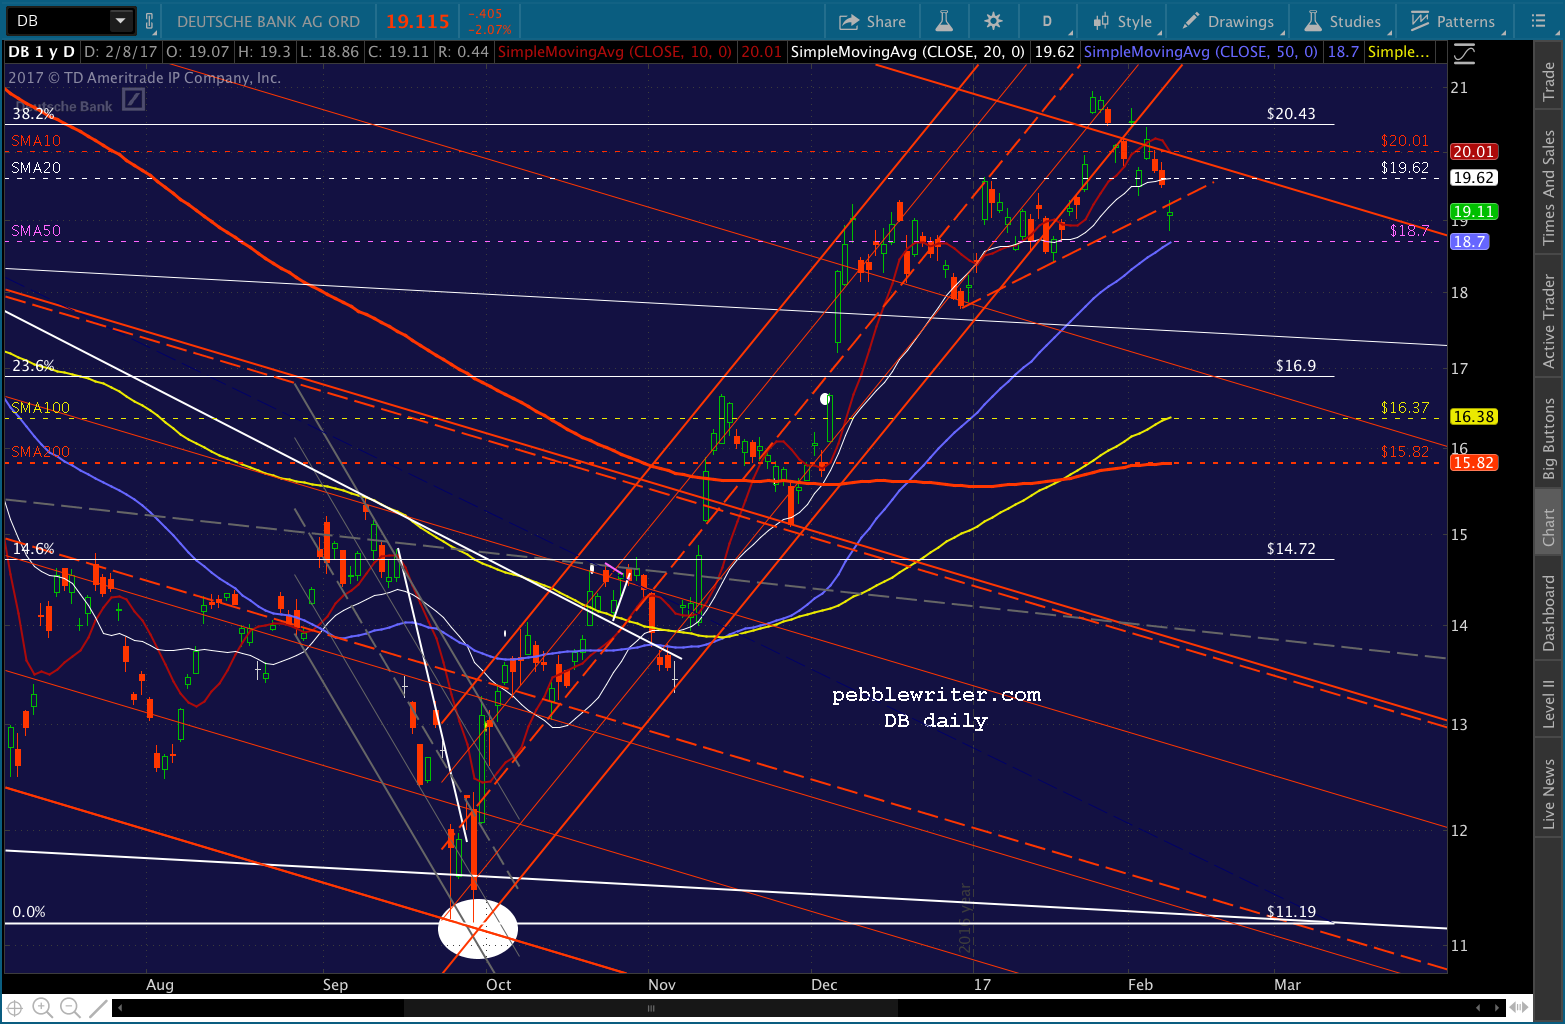
FWIW, for those who are still keeping an eye on DB, it has broken down not only from the rising red channel that guided it since our bottom call at 11.79 but, also the SMA10 and SMA20 and a TL connecting the recent lows.
Not a good omen for TPTB, though we’ve seen it spike higher on many occasions when it made no sense whatsoever. Its earnings last week were disastrous, and Draghi’s pledge to keep ZIRP around for a while longer won’t help much. At this point, I look at it mostly as a barometer for TPTB’s ability to keep things on the desired path. From that standpoint, it isn’t exactly sending out positive signals.
UPDATE: 1:02 PM
They’re taking another run at VIX to try to break SPX out. This time, it includes a pop in USDJPY. Again, I’d bail on any sustained move above the SMA5 200. The red channel top is around 2293.10.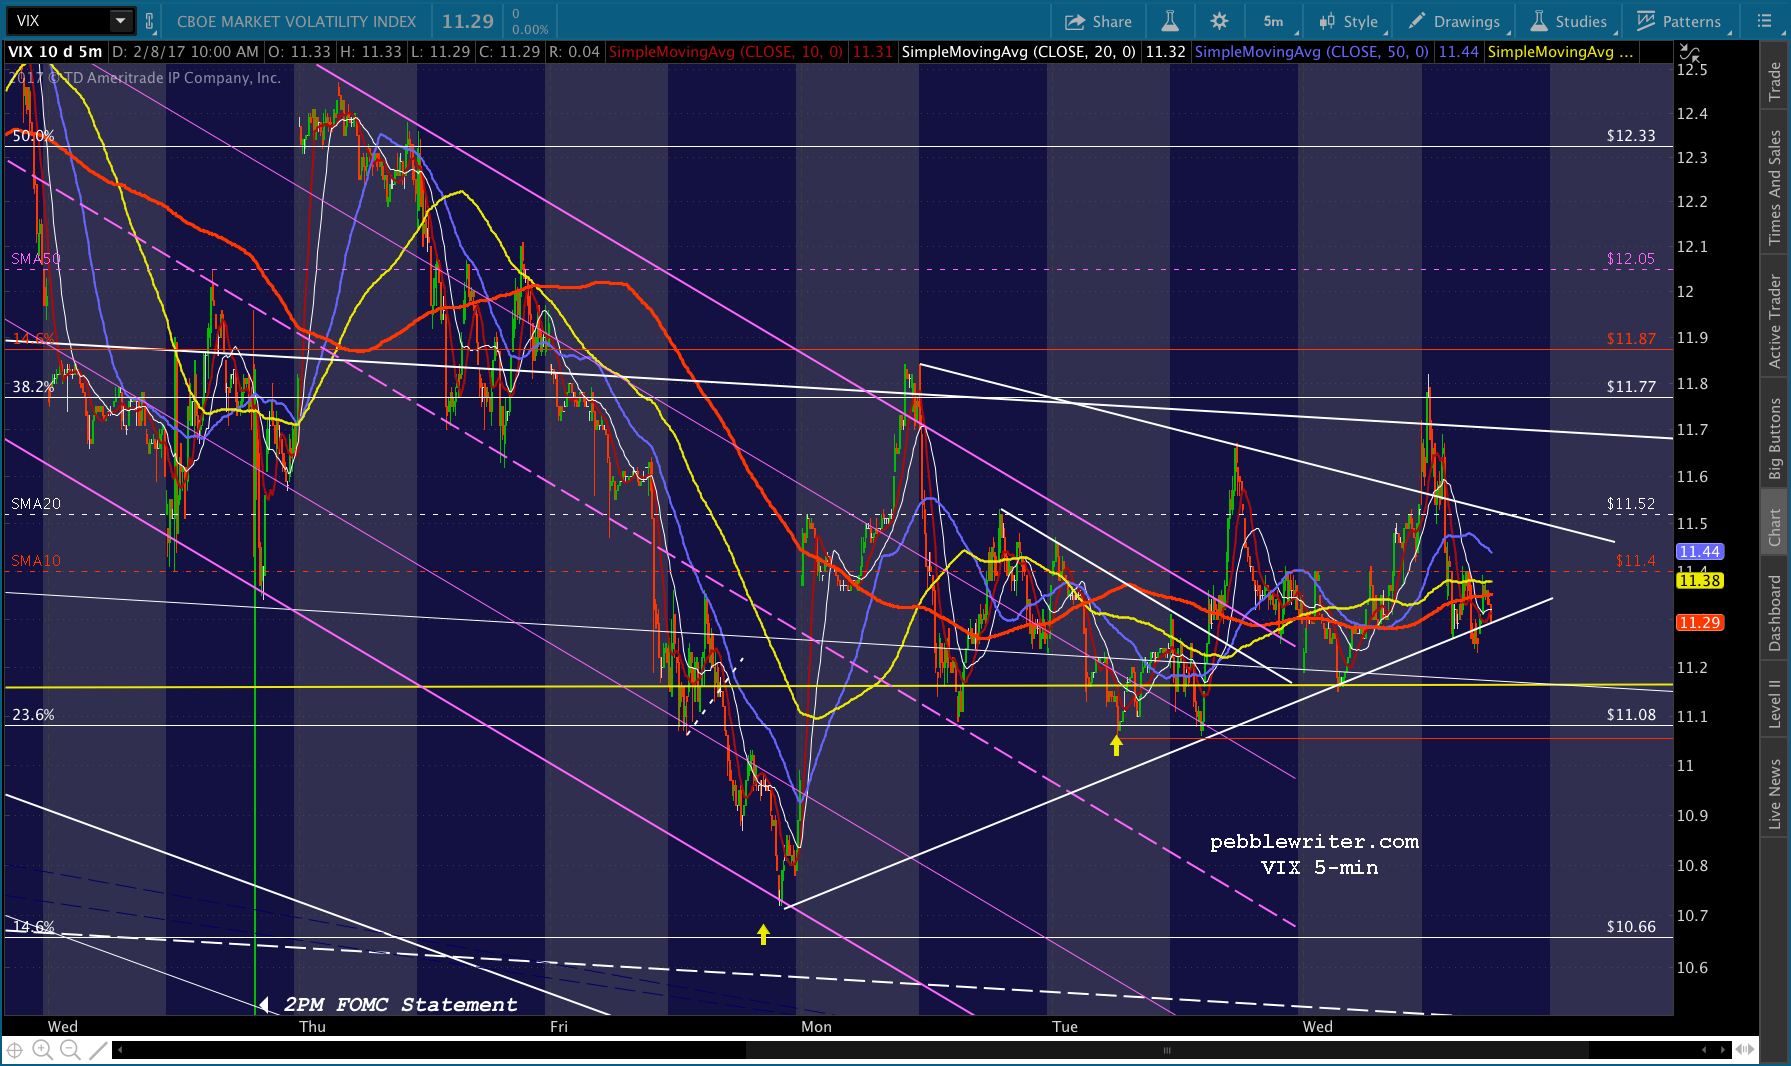
At stake: potential new highs. If they can break SPX out and above 2294.50, it’ll complete a little IH&S that targets 2303.60. Total rubbish, of course. But, that’s the way the “market” works these days.
UPDATE: 1:13 PM
Speaking of rubbish, that neckline at 2294.50 correlates very closely with the top of ES’s channel at 2290.13. So, a twofer if they can pull it off. VIX is currently below the triangle bottom, so the signal is that they’ll probably try. Watch your stops.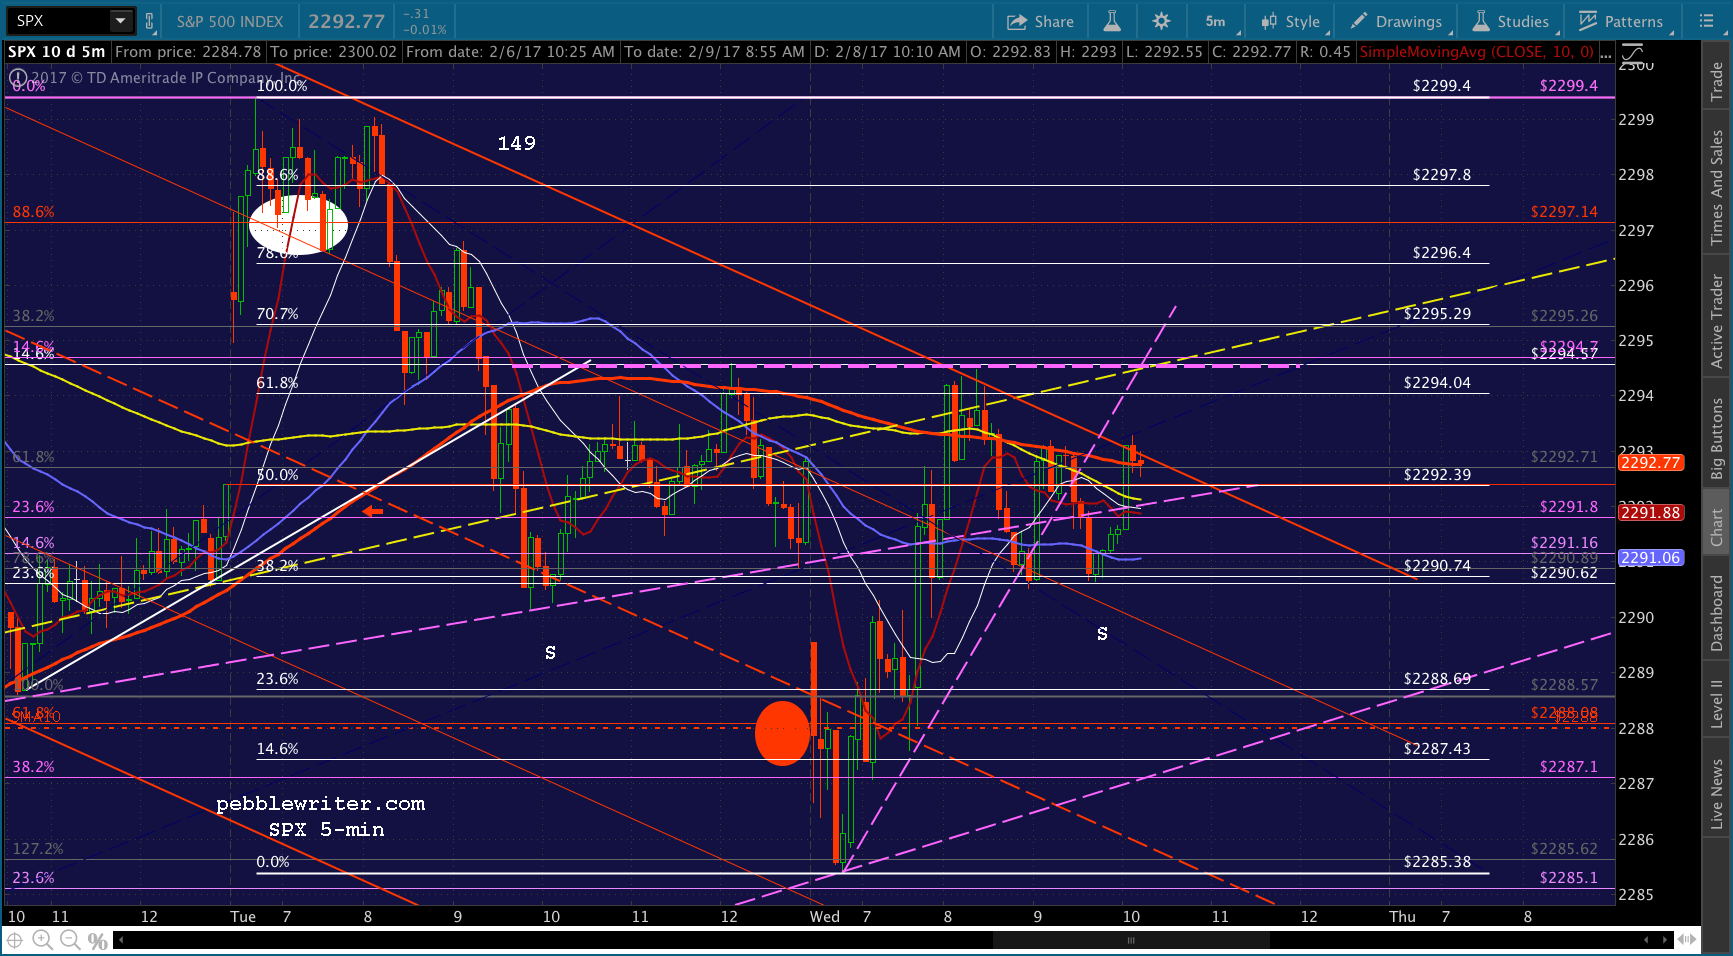
UPDATE: 1:34 PM
Bailing on the short here if ES pushes through 2290, as USDJPY just blew through its SMA5 200. We might get a backtest of the SMA5 200 as the SMA5 10 crosses, but no guarantees.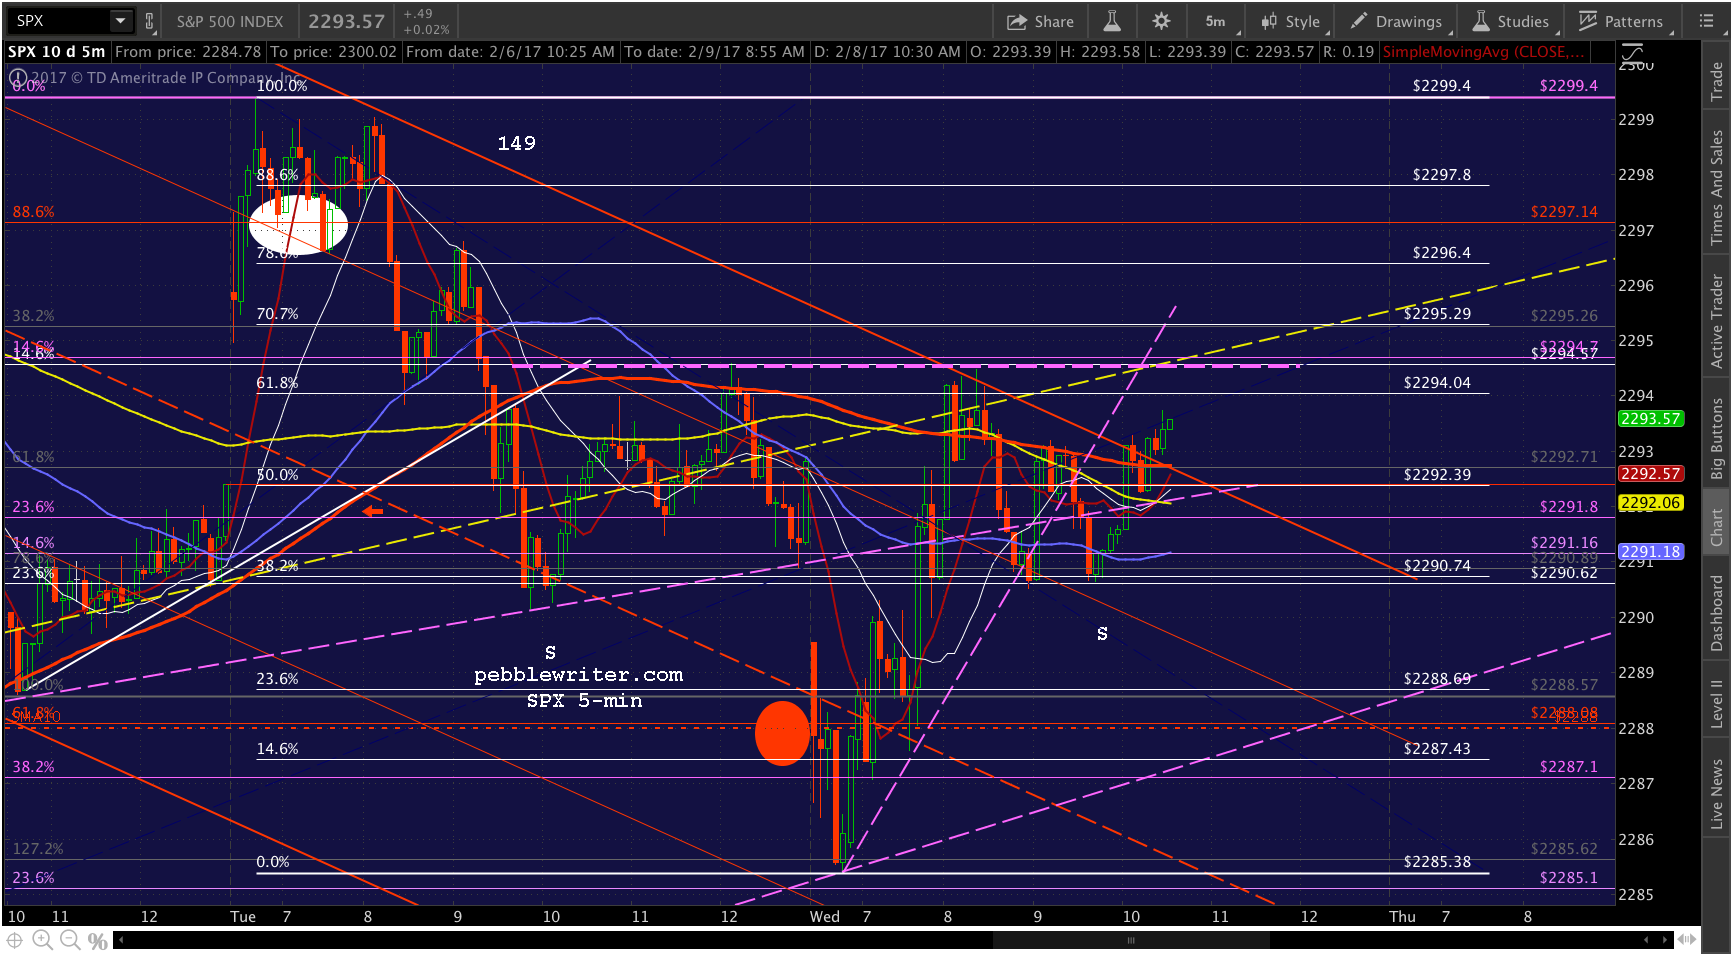
UPDATE: 1:46 PM
Time to get out. Covering here. There’s no guarantee it’ll play out, as SPX still has to clear the yellow midline. As always, keep an eye on VIX and, now, USDJPY. If they both start going nuts and SPX pops through 2295, it’s time to play along on the long side. If SPX drops through the SMA5 10, it’s time to re-short.
 UPDATE: 2:06 PM
Okay, I’ll bite. Taking a chance on shorting here, as ES has failed to break out and both ES and SPX have dipped below their SMA5 10s. USDJPY is back below its SMA5 200.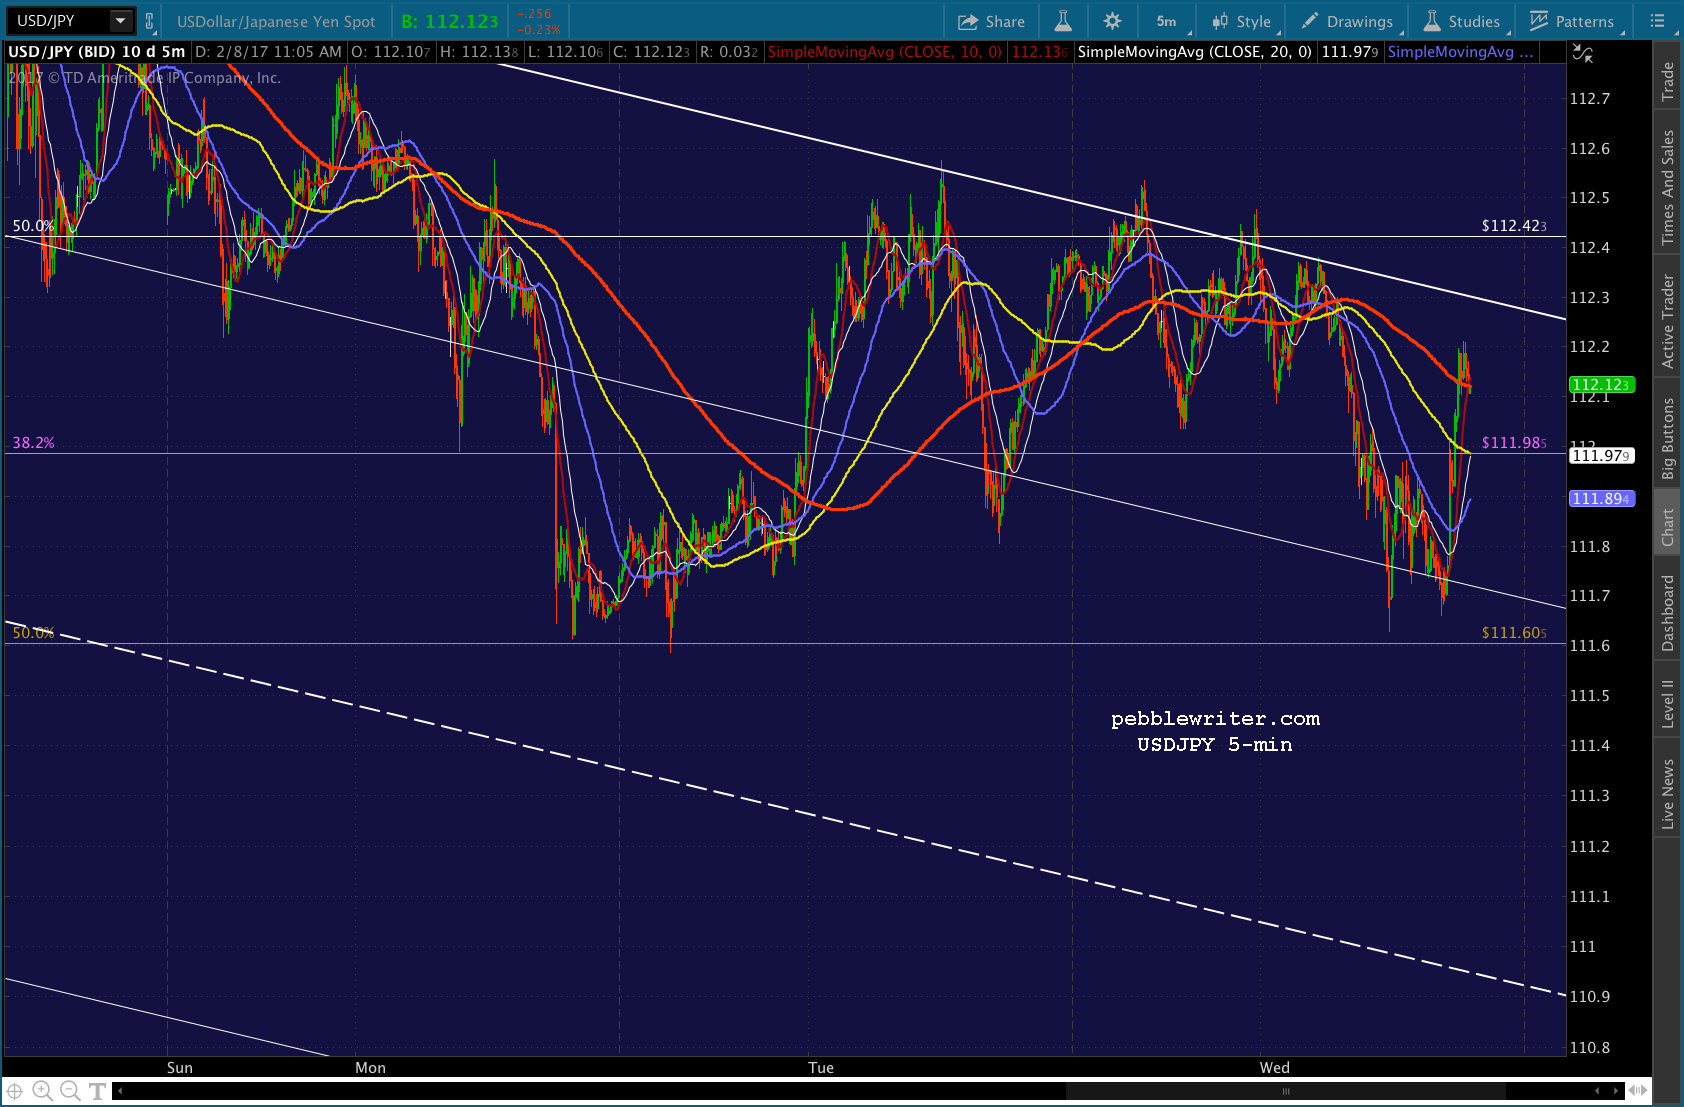
 It’s not a high percentage trade, and relies on VIX calming down and CL continuing to break down.
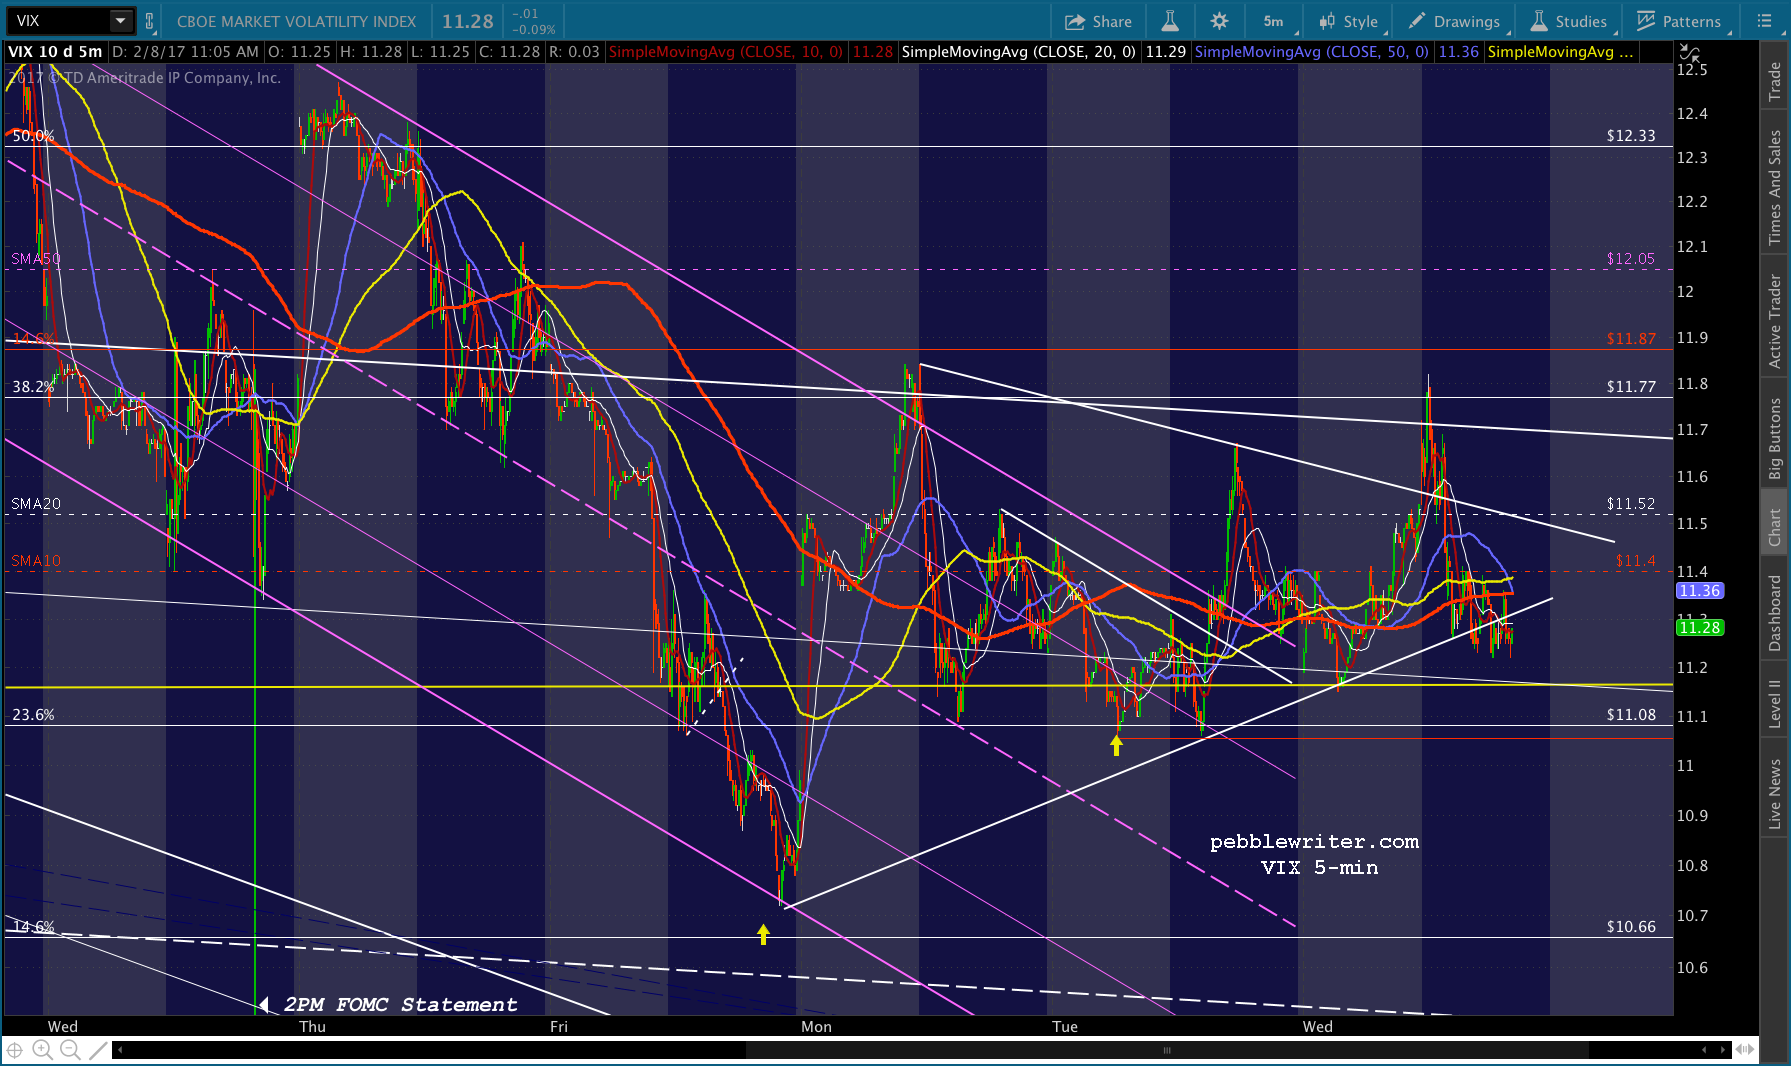
UPDATE: 2:18 PM
This could go on for the next two hours — SPX starts to break down, and VIX dips just enough to get it back to the neckline. So far, VIX hasn’t done a nosedive. It’s just enough to prop up stocks, but not enough to break out. Note that VIX is approaching the yellow channel bottom that has tended to provide support in the past.
This makes me wonder if they’re just stalling, and trying to see how low they can let CL fall without stocks breaking down. CL just backtested the SMA50 at 52.21 and is getting a little bounce off that. But, it’s really hard to say.
It would have been very easy to break SPX by now. But, they haven’t — which I suppose means that it either isn’t time or they’re not planning on it.
 As always, don’t hold short overnight unless you can hedge or handle the gap risk so prevalent these days.
.
Comments
One response to “More of the Same”
http://www.zerohedge.com/news/2016-12-21/traders-place-massive-bets-10y-yields-tumble-2-february
Older article – but a massive trade was placed for TLT > 126 by the 17th. Could support our decline in stocks/oil over the next week.