Month: January 2017

  • Markets Unravel a Bit

    Lots of moving pieces over the holiday weekend — which are typically used to leapfrog stocks up past resistance.  Our analog said otherwise, this time, and we will be rewarded with a nice gap down on the open.

    ES is currently off 9.25, but was off double digits before oil futures began their latest algo-nudging ramp job.  It’s more than a bit ironic, as the Saudis went out of their way yesterday to announce that the recent OPEC agreement which was used to prop up oil prices, and thus stocks, into the year end is likely to be unwound in six months time.  Naturally, CL rallied on the news just like it did on the latest bearish inventory figures.

    2017-01-17 CL 60 0600

    continued for members(more…)

  • Another Backtest

    Head & Shoulders Patterns are wonderful chart patterns, providing solid advance warning of impending plunges in stocks.  But, their clearly defined trigger points and targets can also be used by those propping up “markets” to negate the move that would otherwise play out.

    Such is the case in SPX, where two different H&S Patterns have completed, and partially played out, only to see sharp spikes in CL and plunges in VIX drive prices back above both necklines.  It has become a hallmark of the “markets” for the past eight years, and makes sticking to your guns that much harder.  And that, of course, is the whole point.2017-01-13 VIX 60 0615

    Yesterday, SPX got within 2.11 of our next downside target before VIX was hammered by 10.2% — a spectacular move that resulted in SPX melting up 17 points into the close.  Another day, another pattern busted (for now) by the algos.

    continued for members(more…)

  • Manipulating Oil for Fun and Profit

    The EIA reported that crude inventories increased by 4.1 million barrels (+1.5MM expected), gasoline increased by 5.0 million barrels, and distillates increased by 8.4 million barrels.  It was an ugly inventory report, made all the worse by: (a) the recent DOE announcement of the sale of 8 million barrels from the Strategic Petroleum Reserve, (b) news that some OPEC members have already been caught cheating, and (c) data showing that US production continues to surge.Screen Shot 2017-01-12 at 6.15.49 AM

    Naturally, oil prices sold off sharply on the EIA data.  Or, did they?  CL plunged about 0.75 in the first 5-10 minutes, then began a preposterous rally that continues even this morning.  After shedding 6.4% since last Friday, CL rallied 5.5% on the worst news in months.  2017-01-12 CL 5 0625What gives?  Could it have anything to do with the bearish Head & Shoulders Pattern that SPX completed when the EIA report was released?  SPX bounced at our initial downside target.  Yet, we remain short, with our downside targets unchanged.

    continued for members... (more…)

  • The Trump Slump

    If the rally over the past two months was the Trump Rally, will they call this the Trump Slump?  It’s been over three months since we had a bearish cross in the moving averages, though the follow-through hasn’t been very impressive…yet.

    We remain short with our downside targets essentially unchanged from last week.

    continued for members(more…)

  • Analog Update: Jan 10, 2017

    We came within 0.7% and 1 day of our analog’s forecast top before things started rolling over yesterday.  Our latest iteration had 2298 on Jan 5, and we hit 2282 on Jan 6.  2017-01-10-spx-daily-analogNow that we’re here, it’s a good time to review the rest of the forecast, and see if our last downside targets still make sense.

    continued for members… (more…)

  • So Far, So Good

    Friday was one of those days that perfectly confirmed how rigged this market has become.  As I wrote in Moving Averages Rolling Over:

    Our initial target is the SMA5 200 at 2263.63, followed by the SMA10 at 2259.44.  The SMA20 is just below at 2258.84.  Unless SPX makes nice gains in the next six hours, its 10/20 cross will happen today as well.

    SPX reached 2264.06 before the ramps in both USDJPY and CL kicked in and VIX got hammered down to a 10 handle.  The net result: the SMA10 and SMA20 both ended up at exactly 2260.62.  So, technically, no rollover just yet on SPX.

    This was predictable, and follows our conversation later in that post:

    …when a bearish 10/20 cross is about to occur, we often get a sudden rise in SPX, followed by the drop a few sessions later.  When this occurs, it’s because those in the know (CBs and other insiders) are positioning themselves ahead of time.  They do this by running stops and getting short (or at least hedging) while others are scrambling to cover.

    2017-01-06-spx-moving-averages

    Today’s action will be telling, not only in terms of SPX’s support mechanisms (USDJPY — which did roll over — backtested the rising white channel as expected) but our analog, first posted last August, which originally forecast a top for Jan 5.
    2017-01-09-susdjpy-60-0600

    I will be taking the day off today, as we had a death in the family and I have relatives coming into town.  Nothing important has changed since Friday’s charts.  Our downside targets remain unchanged.

    GLTA.

     

  • Moving Averages Rolling Over

    Yesterday was another one of those days when the folks minding the store got a little over-anxious.  A simple backtest of SPX’s 10-day moving average never happened because CL and NKD started ramping prematurely.  Could it have been the bearish moving average crosses that got them so nervous?2017-01-06usdjpy-daily-mas

    continued for members(more…)

  • Our Analog Grows Up

    It was over five months ago that I first suggested our current analog [see: A New Analog Aug 3, 2016.].  It was unlike many of the past ones in that it suggested a tortured path to higher prices.  As of yesterday, we were within 1% of our upside target, with today being labeled a likely high.

    The most notable development overnight was that USDJPY finally broke down.  To paraphrase Ron Burgundy, this is kind of a big deal.  After a month-long very steep post-election ramp job, and another month of less-steep ramping, this is a trend break that shouldn’t be ignored.2017-01-05-usdjpy-60-0656 Will we get another gasp higher as our analog allows, or is the party finally over?

    continued for members

    (more…)

  • Algos Still Going Strong

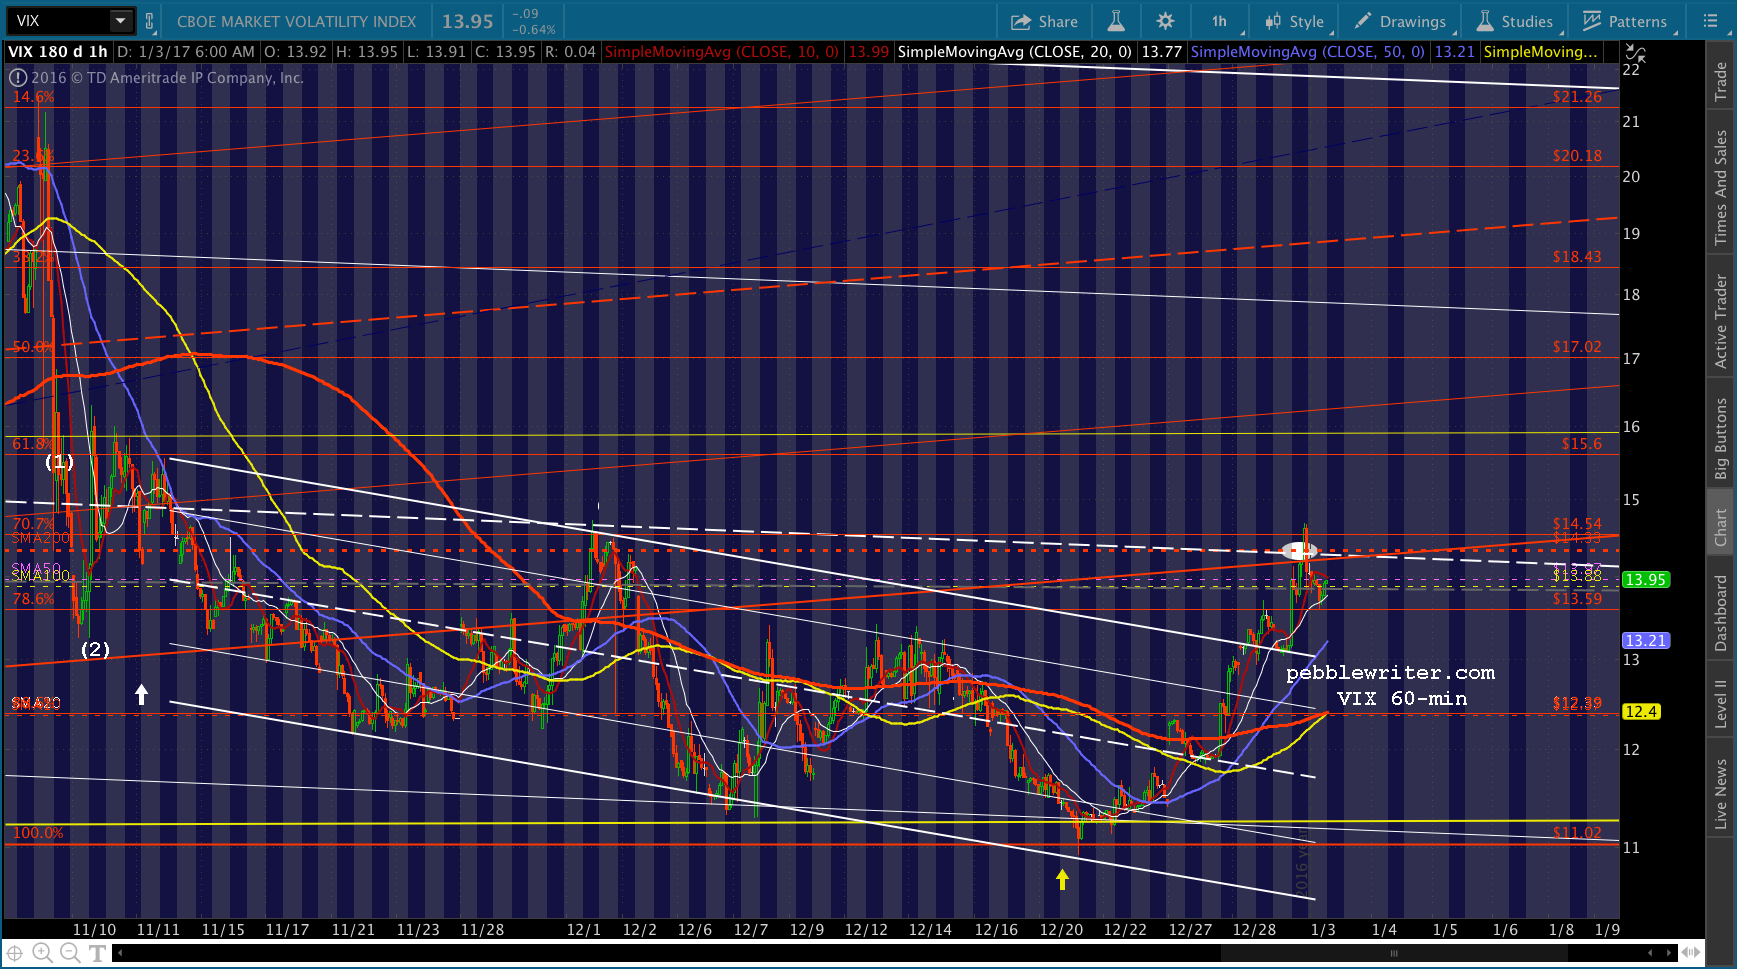
    VIX has been spanked by over 14% since Friday afternoon, aiding a bounce in stocks that breaks plenty of chart pattern rules.  Yesterday, it did more than backtest the falling white channel.  It broke down, back into the channel overnight — all in order to ensure another gap higher today.2017-01-04-vix-60-0615

    Combined with well-timed bounces in USDJPY and CL, we’ve seen backtests develop in SPX that would ordinarily mean a downturn.  It wouldn’t be such a big deal if they weren’t setting up in practically everything I chart.

    continued for members

    (more…)

  • Charts I’m Watching: Jan 3, 2017

    A very Happy New Year to our members this morning!  I wish all of you a prosperous 2017!

    The New Year is off to a bang with oil and USDJPY spiking higher and VIX backing off after tagging our SMA200 target.2017-01-03-vix-60-0615

    In other words, more of the same…so far.

    continued for members(more…)