The EIA reported that crude inventories increased by 4.1 million barrels (+1.5MM expected), gasoline increased by 5.0 million barrels, and distillates increased by 8.4 million barrels. It was an ugly inventory report, made all the worse by: (a) the recent DOE announcement of the sale of 8 million barrels from the Strategic Petroleum Reserve, (b) news that some OPEC members have already been caught cheating, and (c) data showing that US production continues to surge.
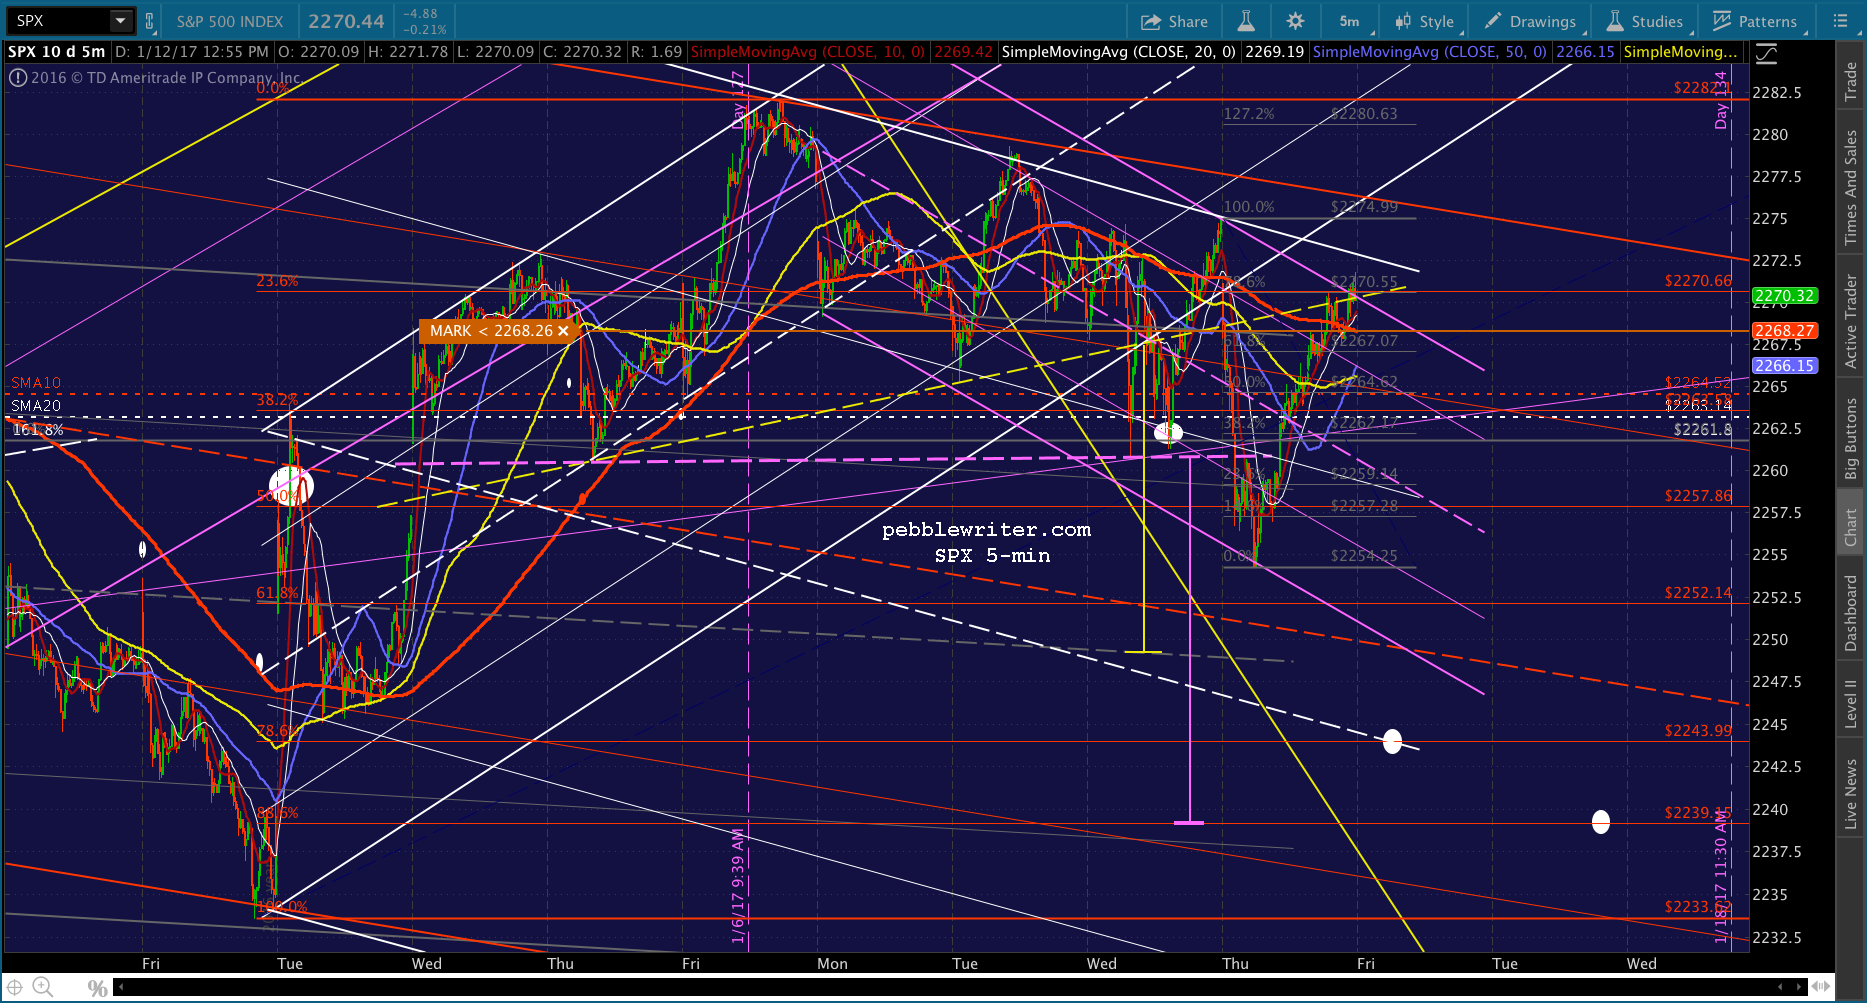
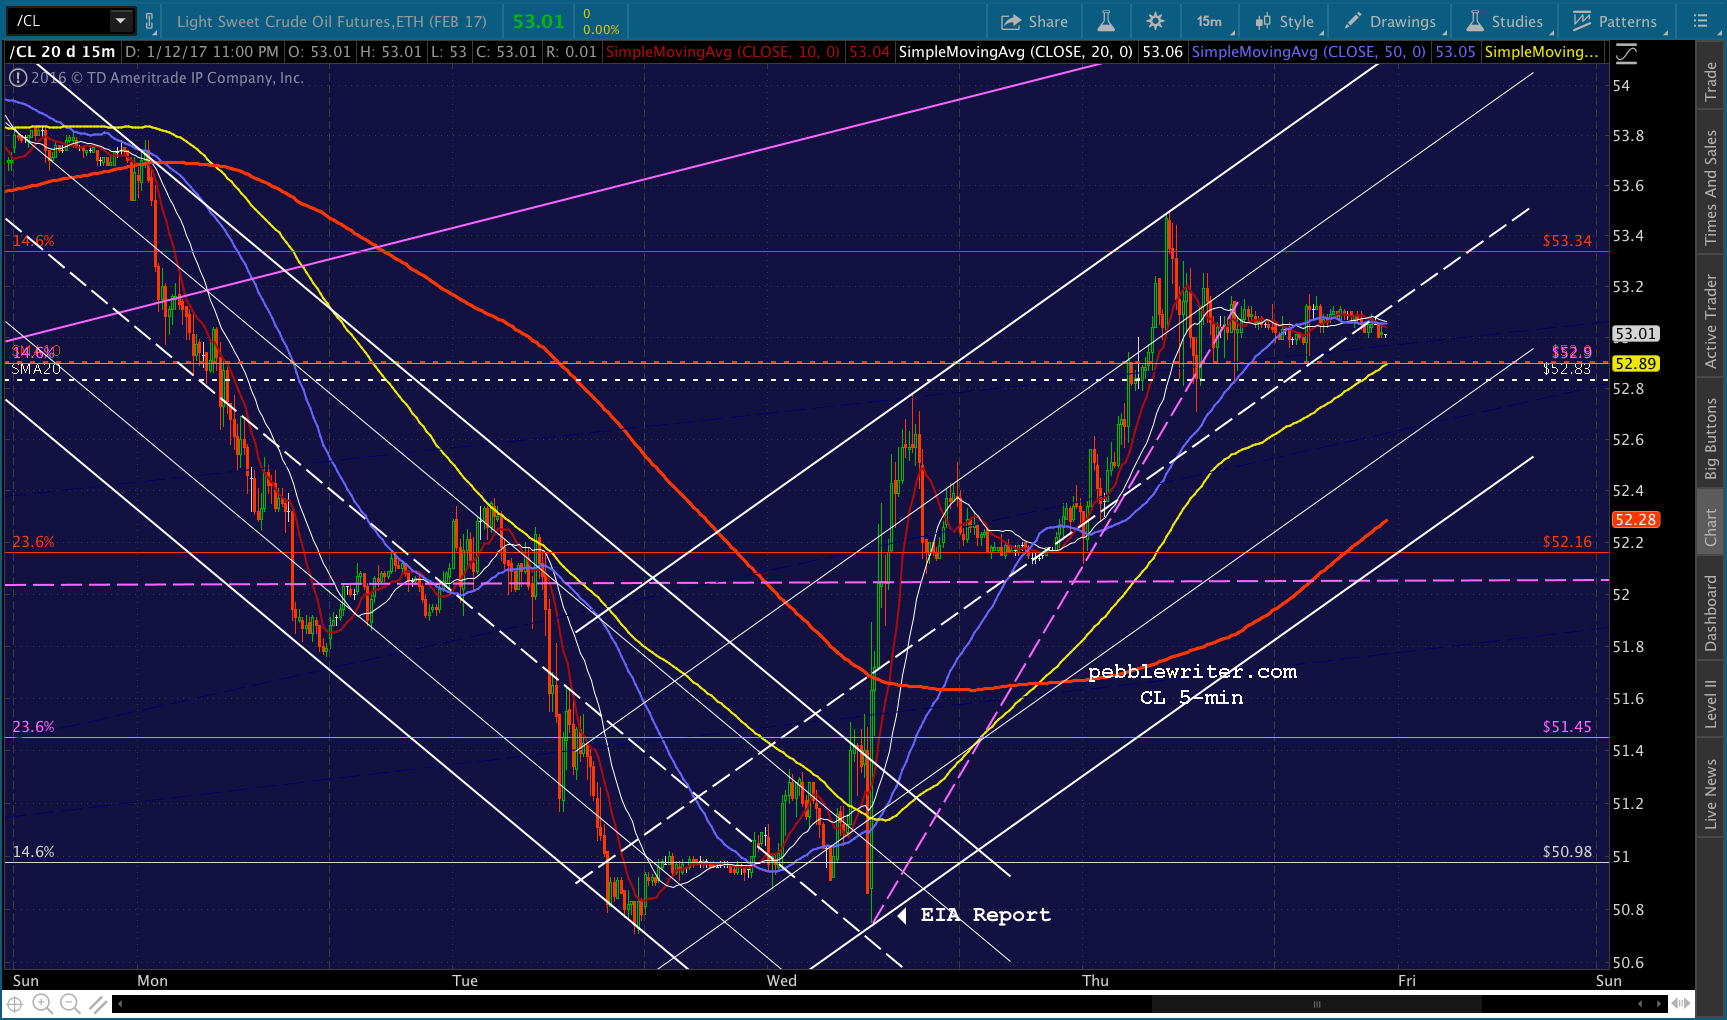
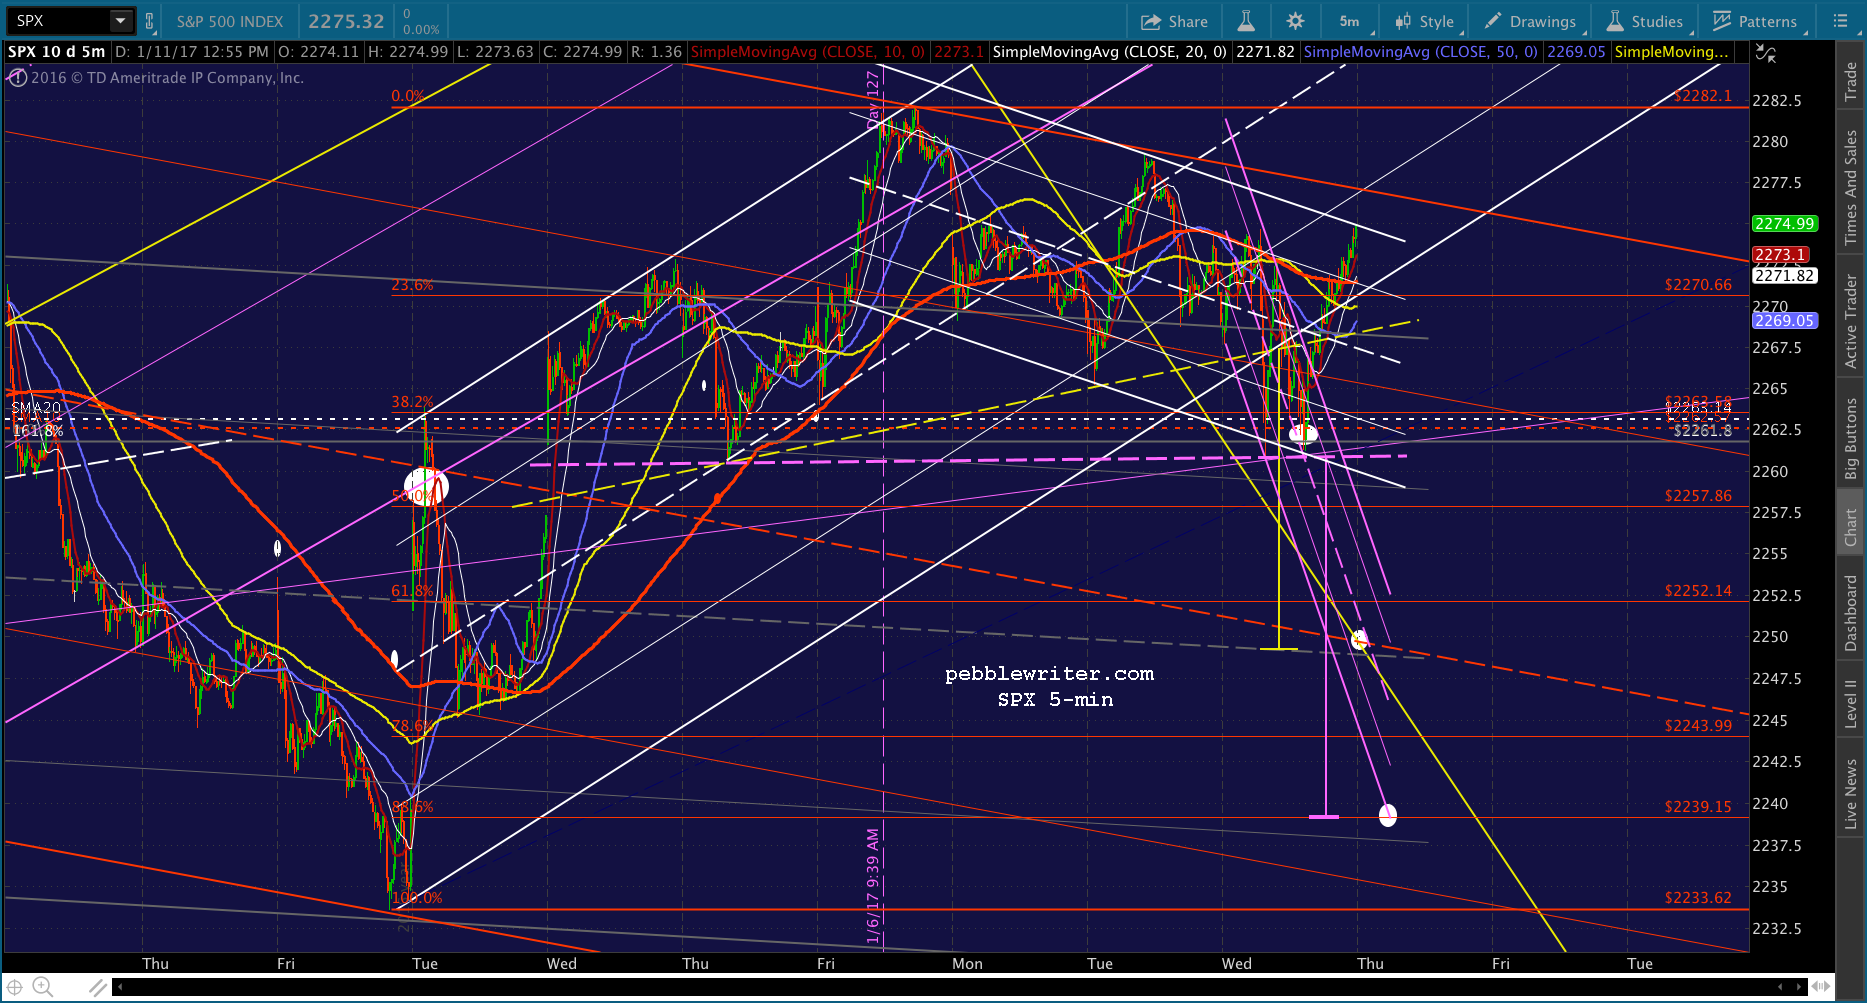
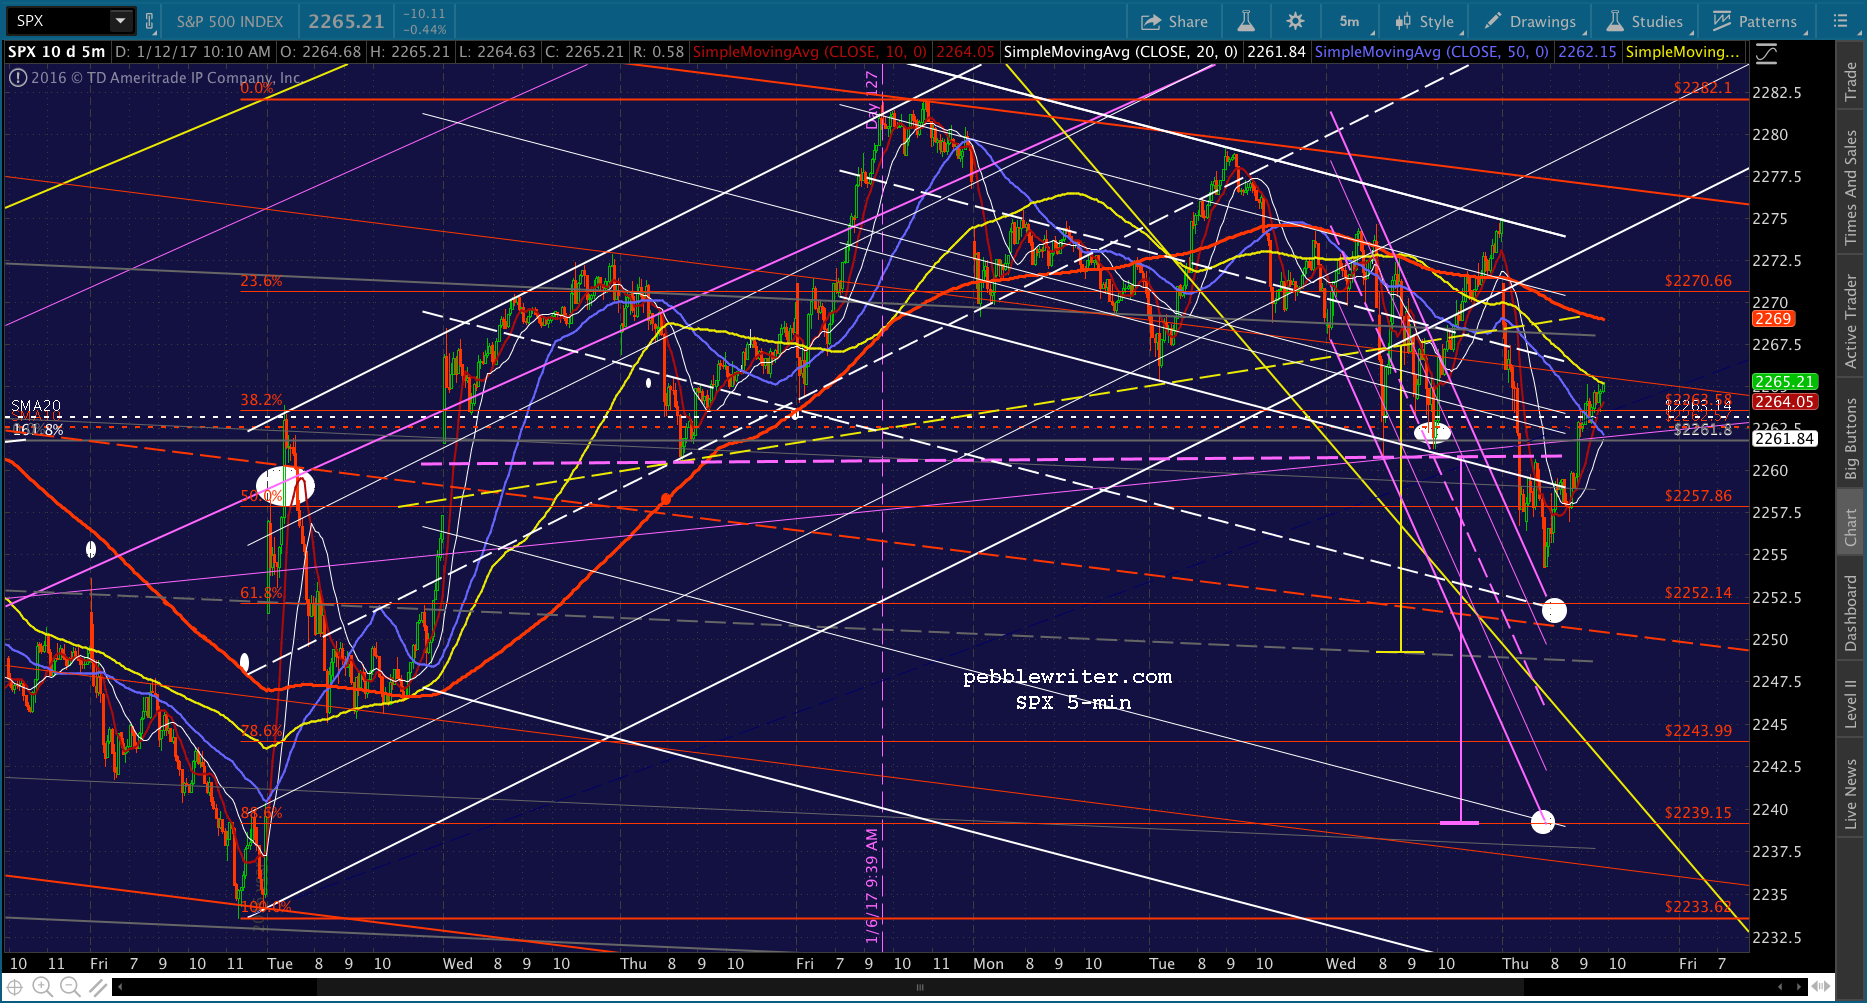
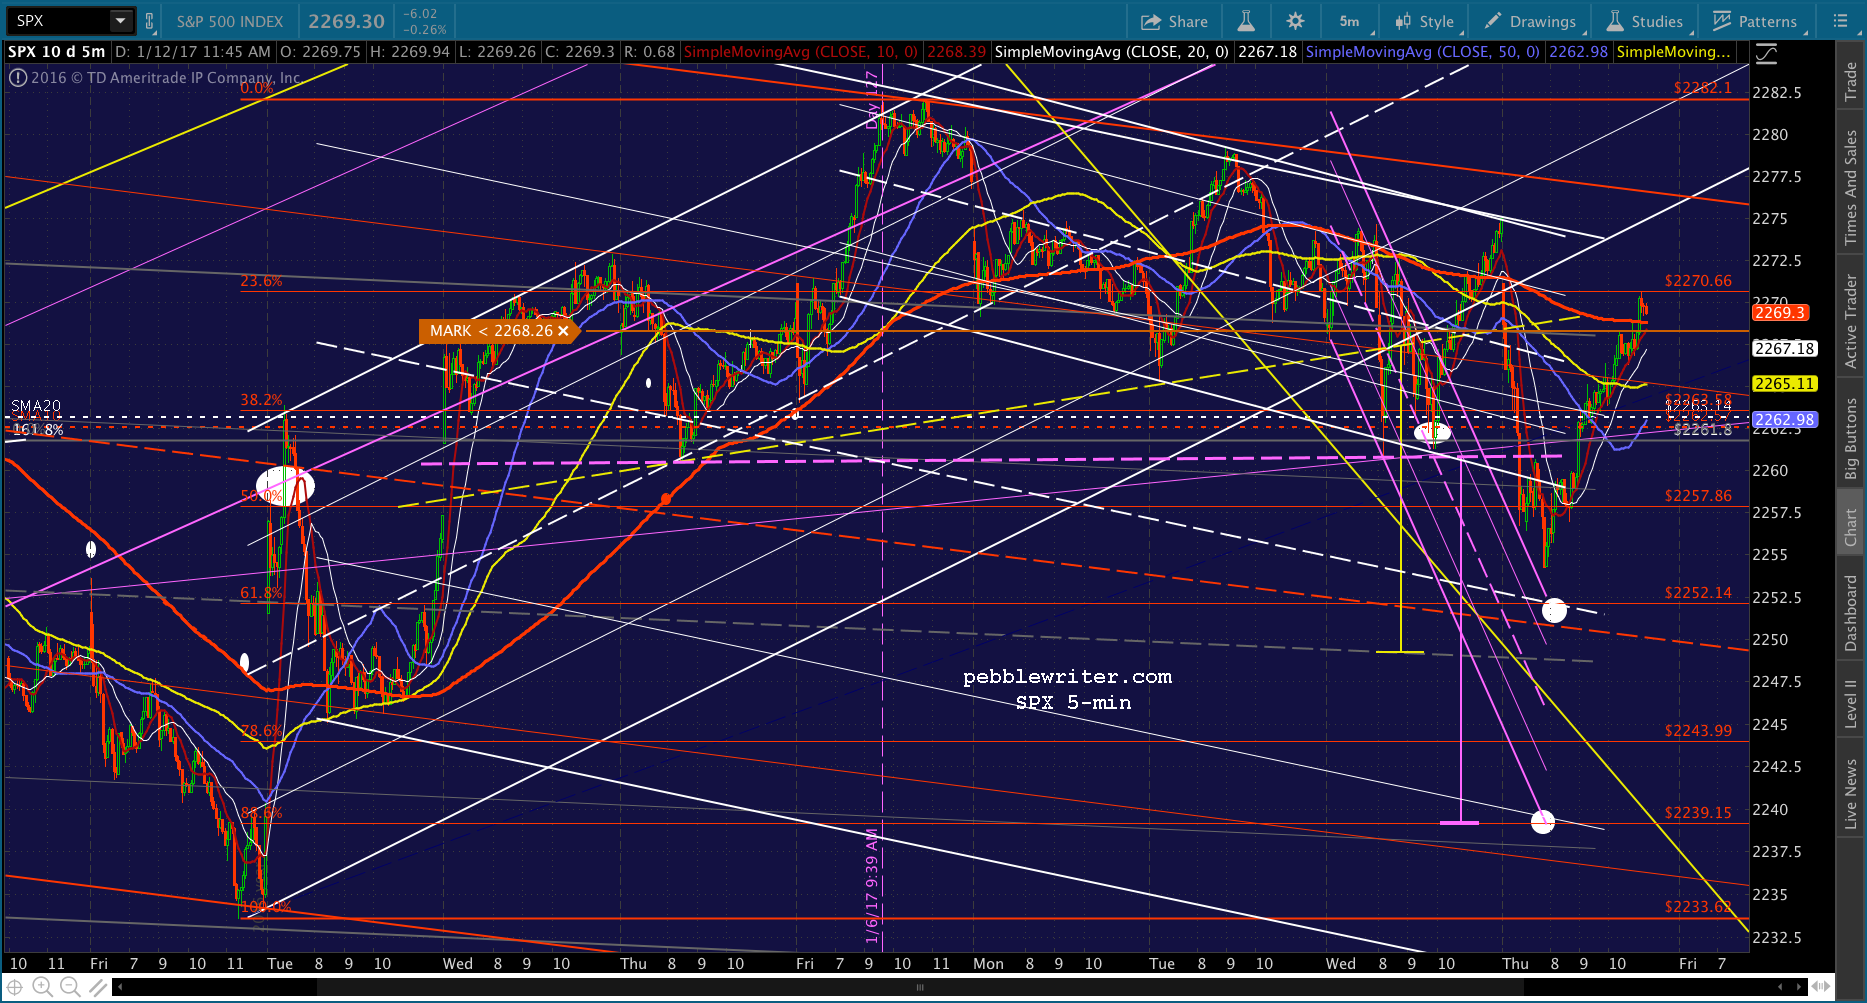
Naturally, oil prices sold off sharply on the EIA data. Or, did they? CL plunged about 0.75 in the first 5-10 minutes, then began a preposterous rally that continues even this morning. After shedding 6.4% since last Friday, CL rallied 5.5% on the worst news in months.  What gives? Could it have anything to do with the bearish Head & Shoulders Pattern that SPX completed when the EIA report was released? SPX bounced at our initial downside target. Yet, we remain short, with our downside targets unchanged.
continued for members...
While the yellow H&S completed and started to pay off, the purple one was completely averted. As we discussed earlier this week, this was nothing but a delaying tactic and a means of head faking traders who might, otherwise, have been tempted to hold short overnight.
We remain short from 2271.81 yesterday afternoon as, by now, the big boys have hedged their positions and are ready for the decline to unfold.
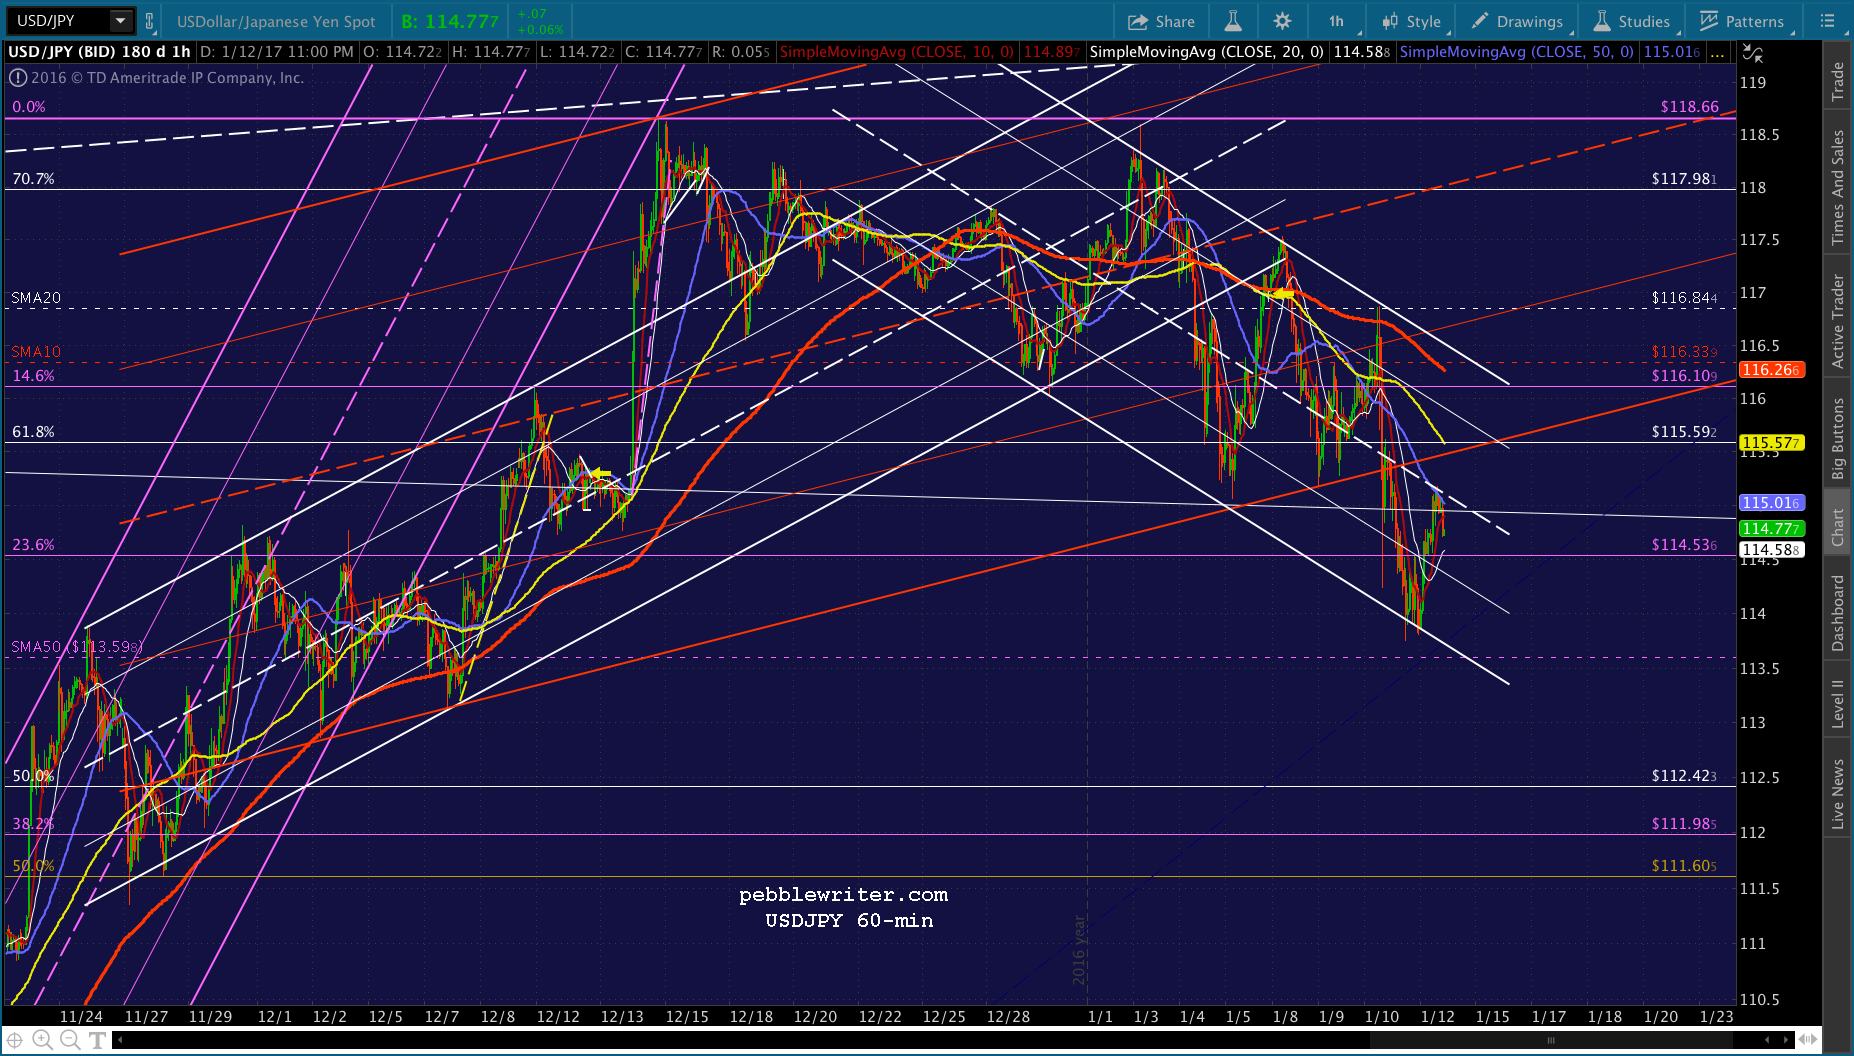
USDJPY rallied into the close, only to (no surprise) dump overnight.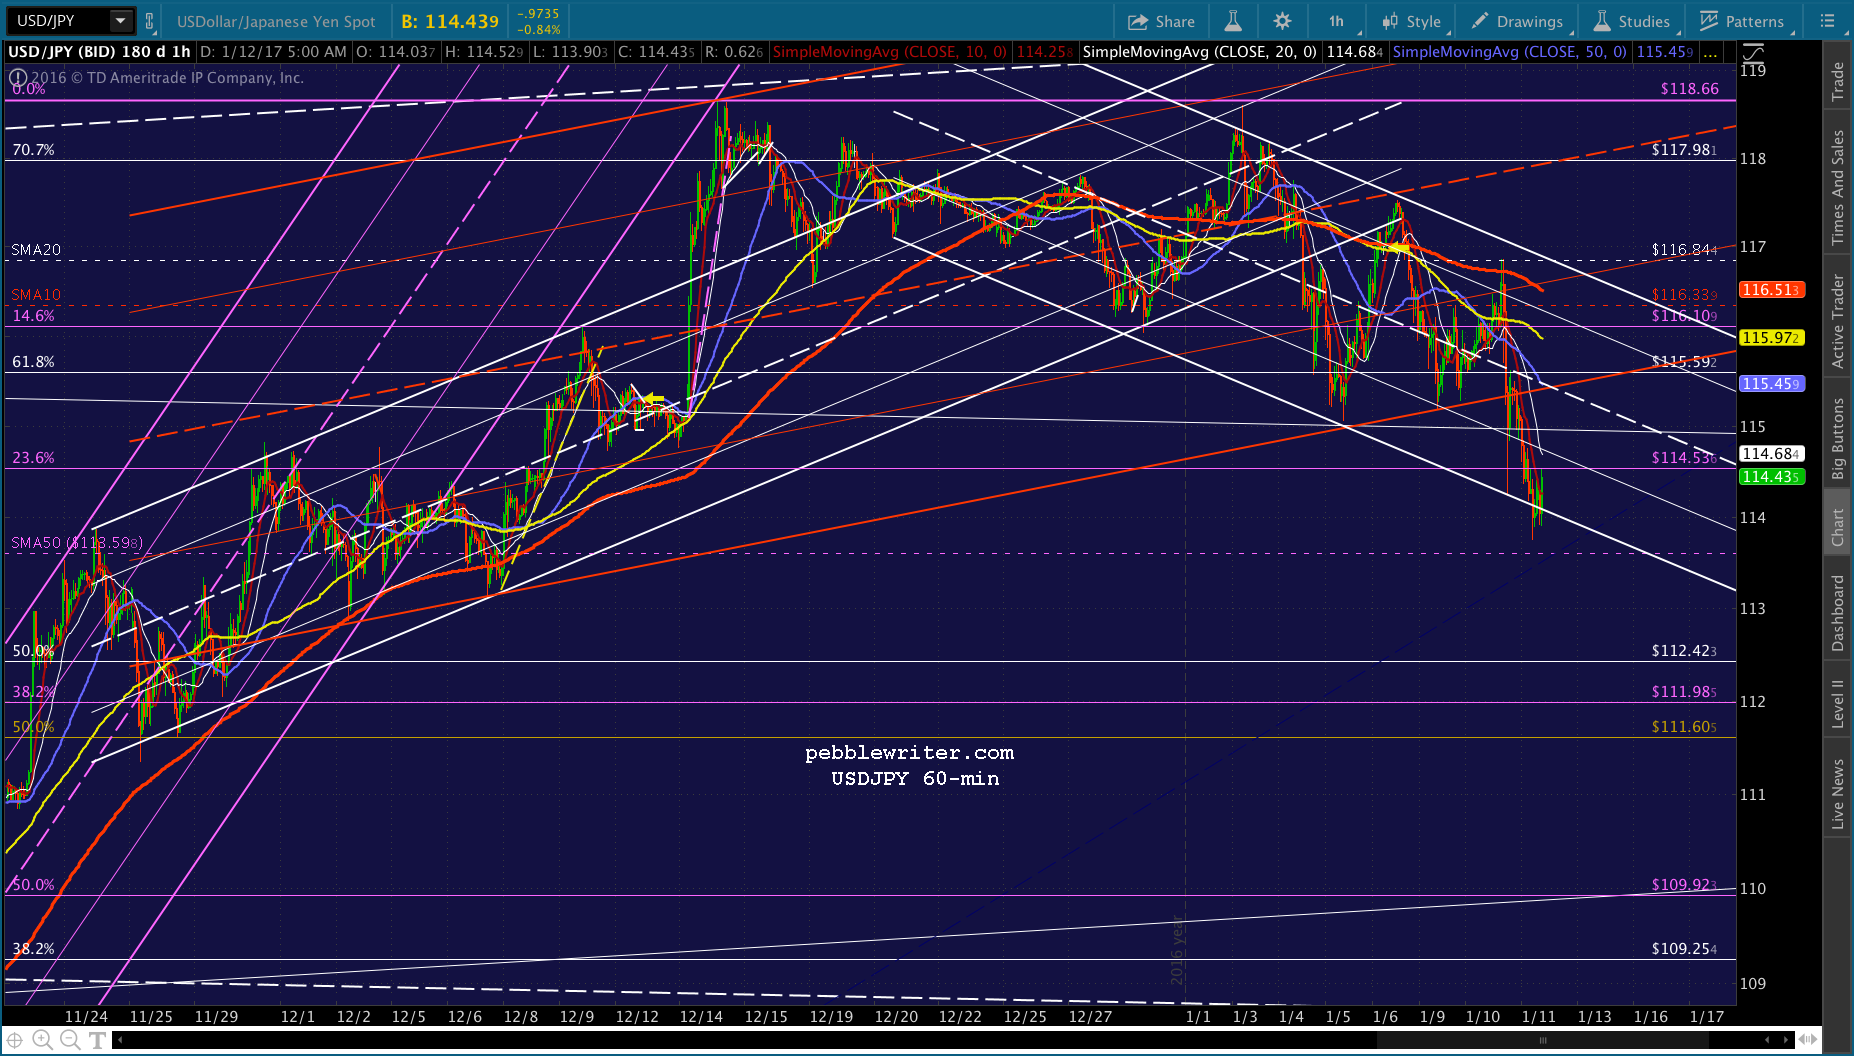
DX is in danger of a real breakdown after backtesting its rising white channel a second time.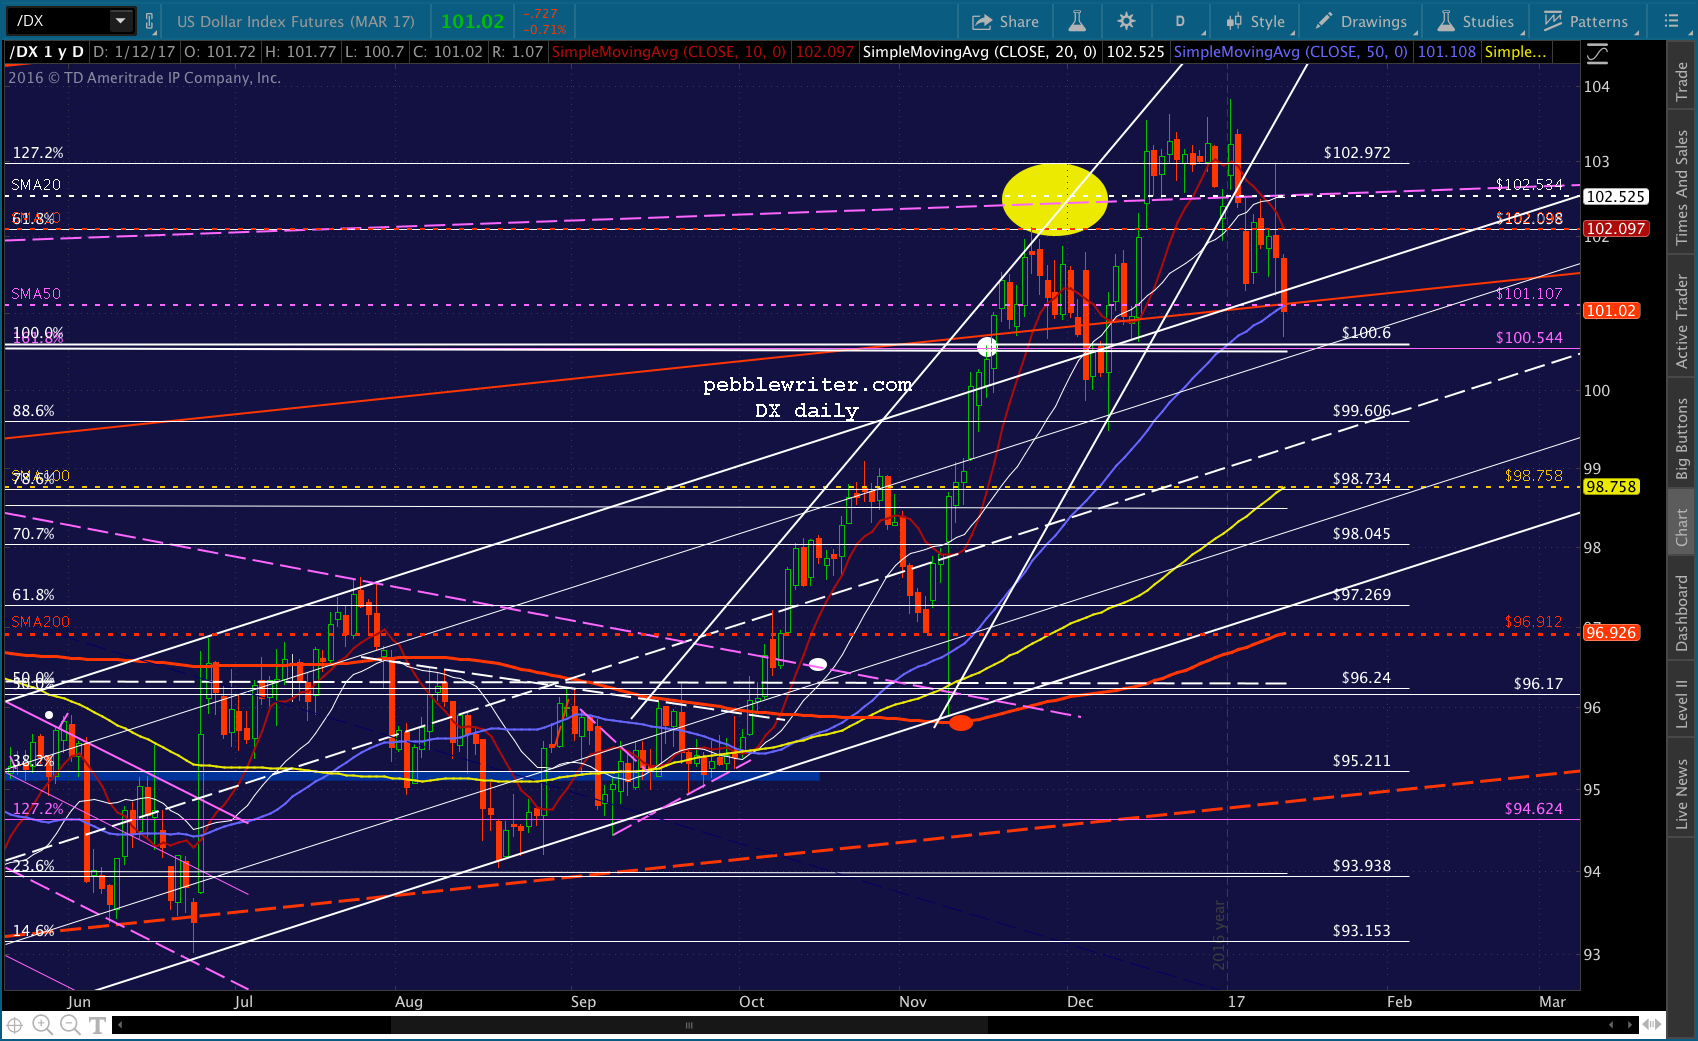
CL itself is kind of in no man’s land, above its SMA10/20 and further to go if it wants to backtest the broken purple channel.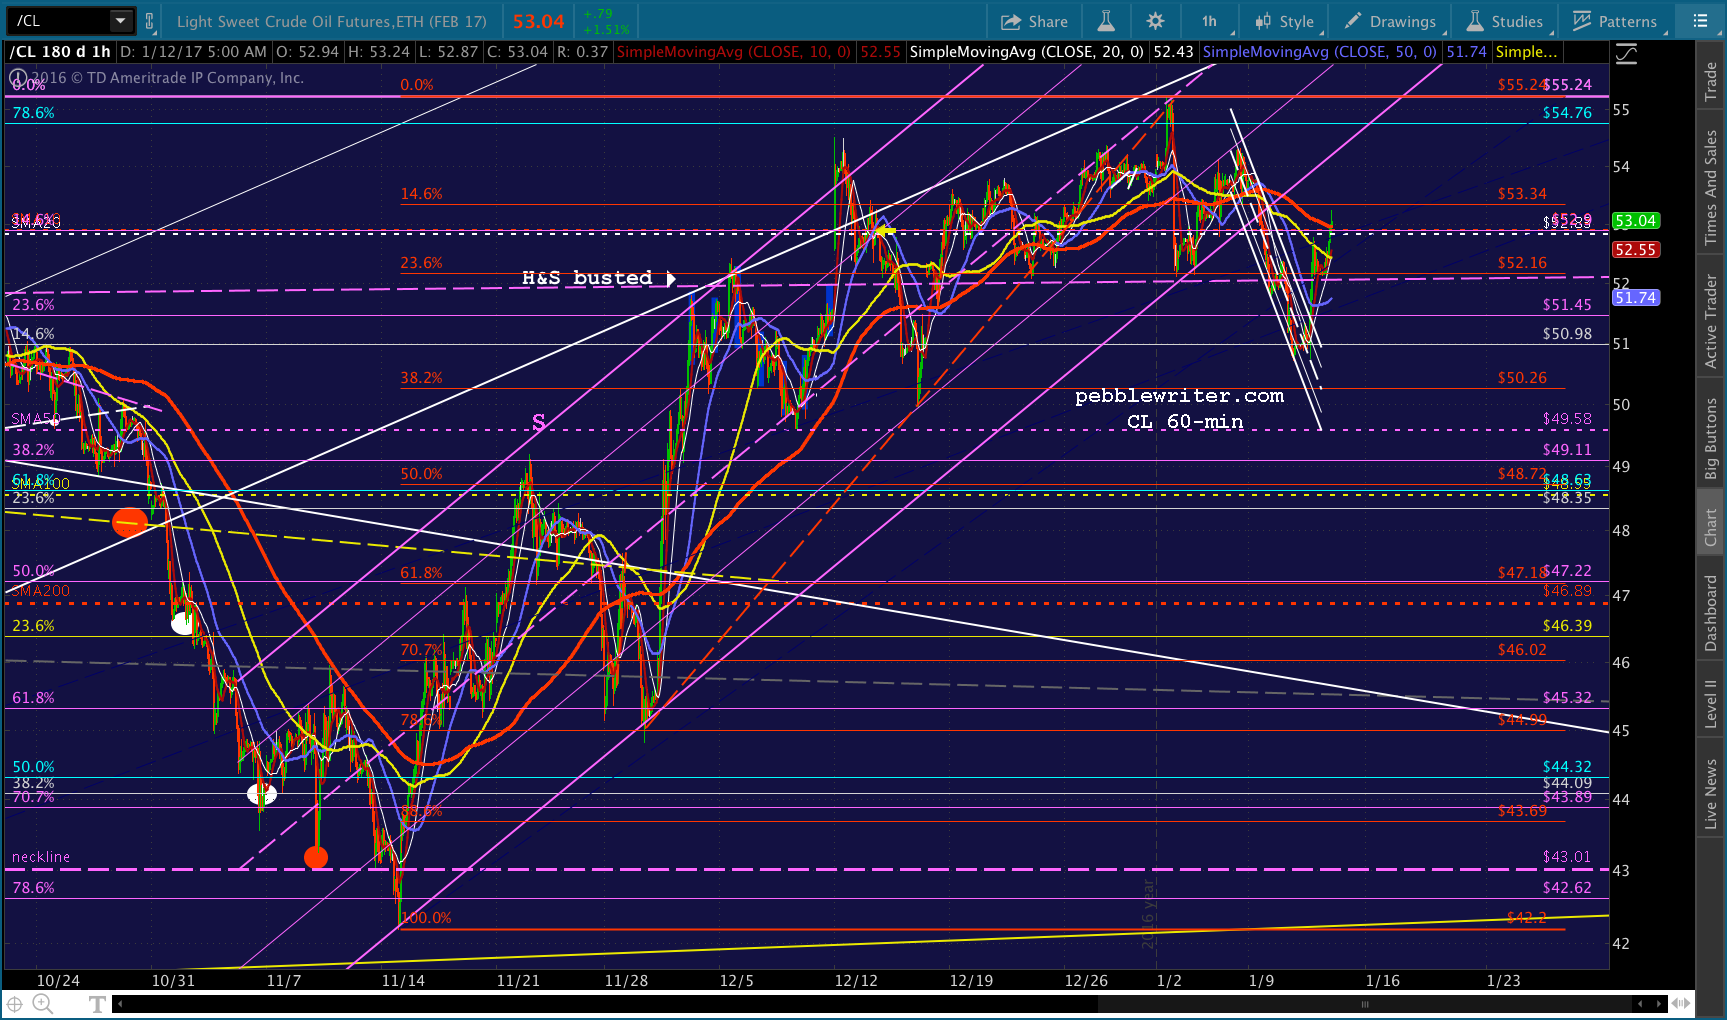
UPDATE: 9:33 AM
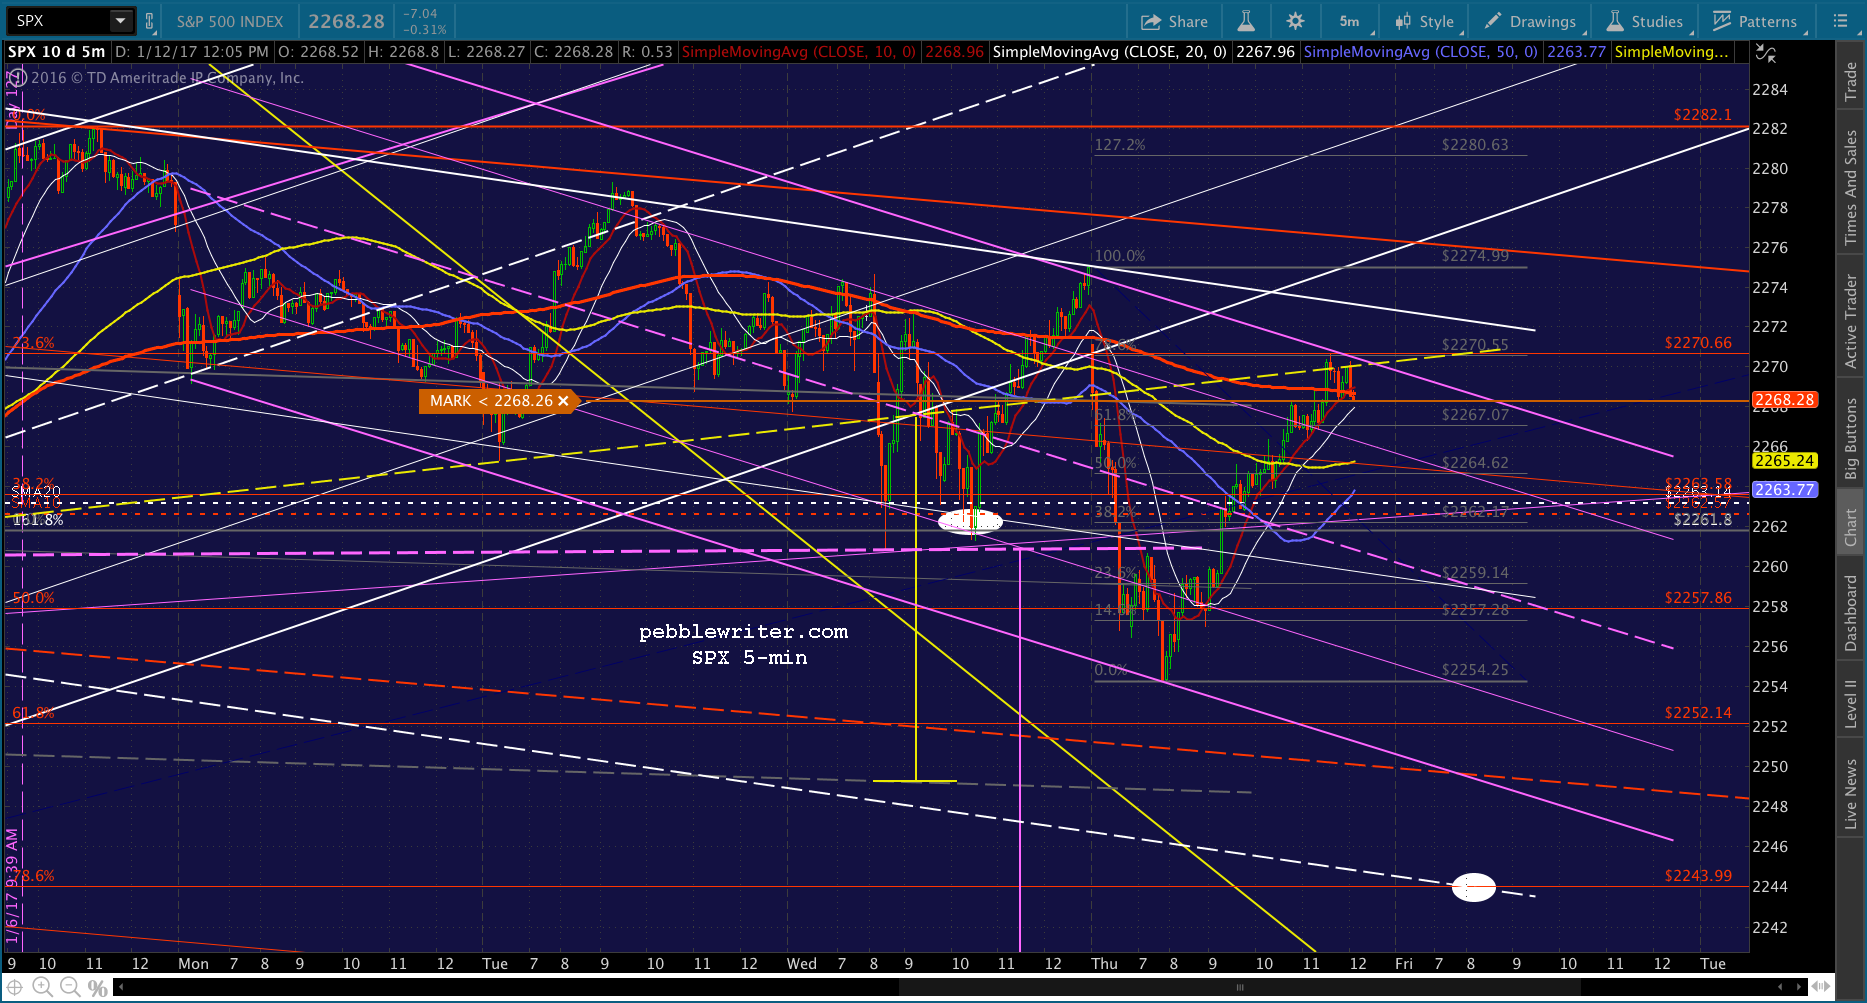
Just reached the yellow neckline — the first potential support.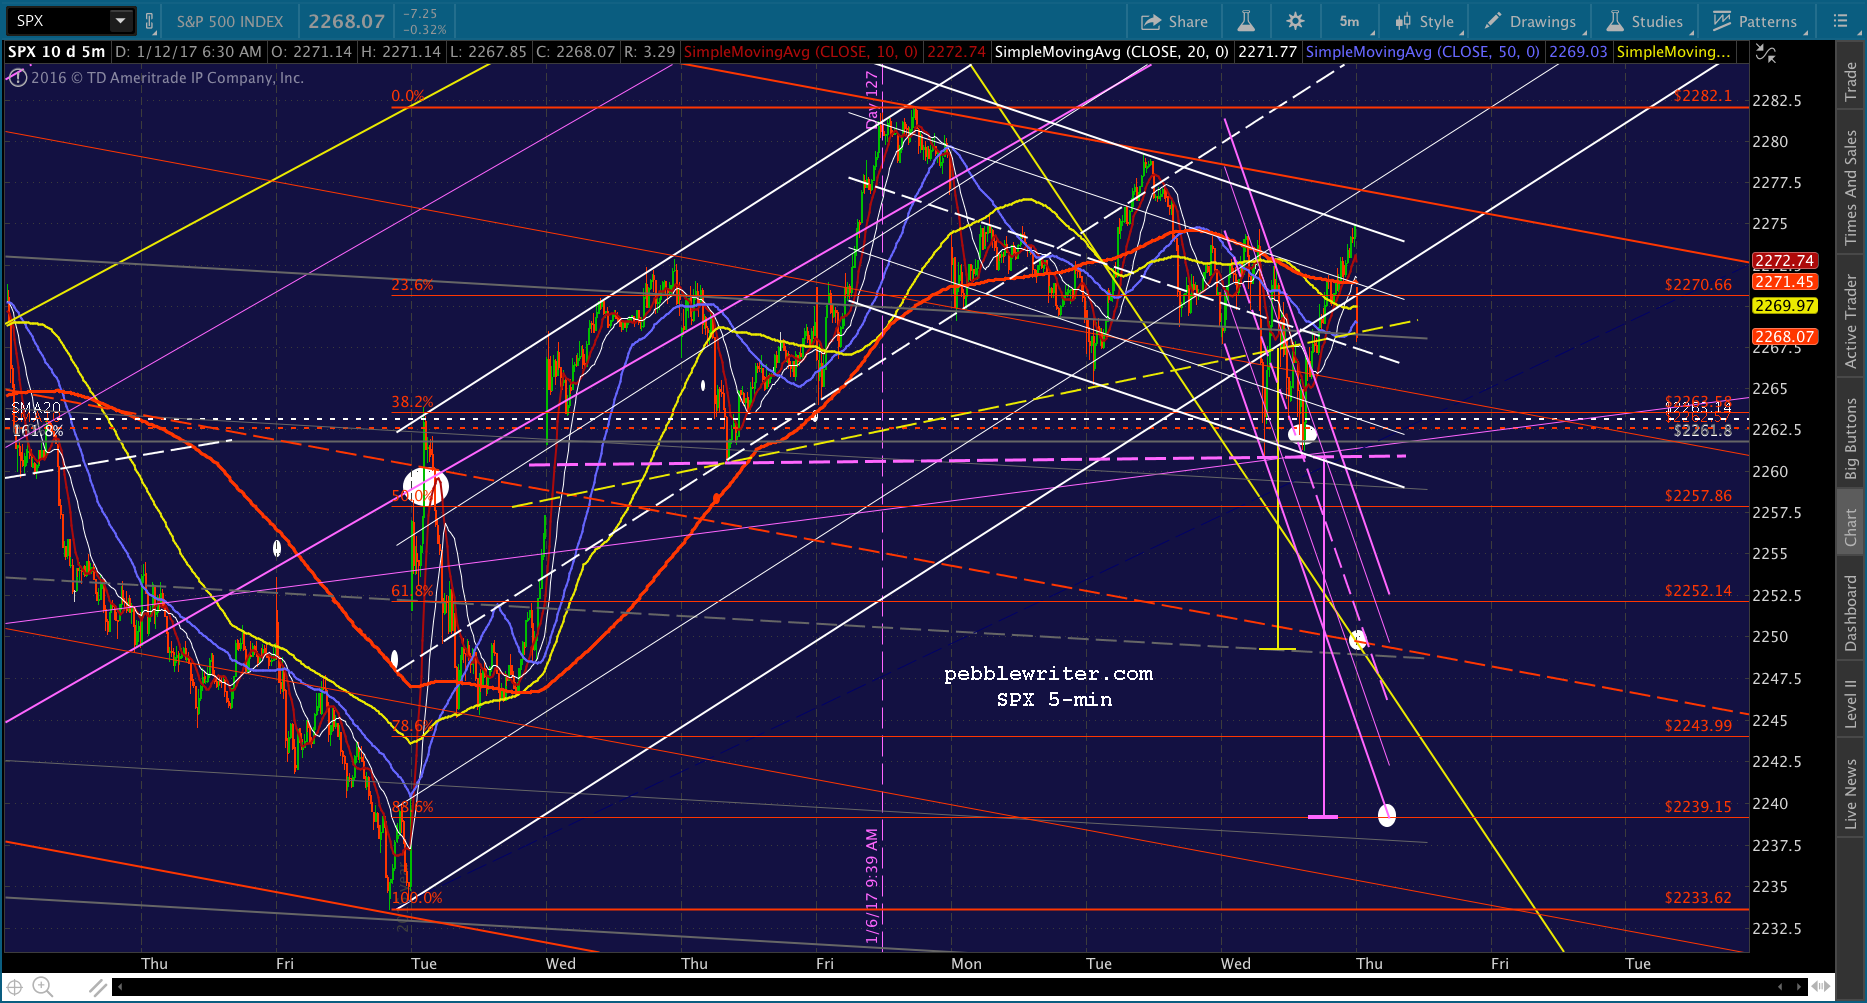
UPDATE: 10:24 AM
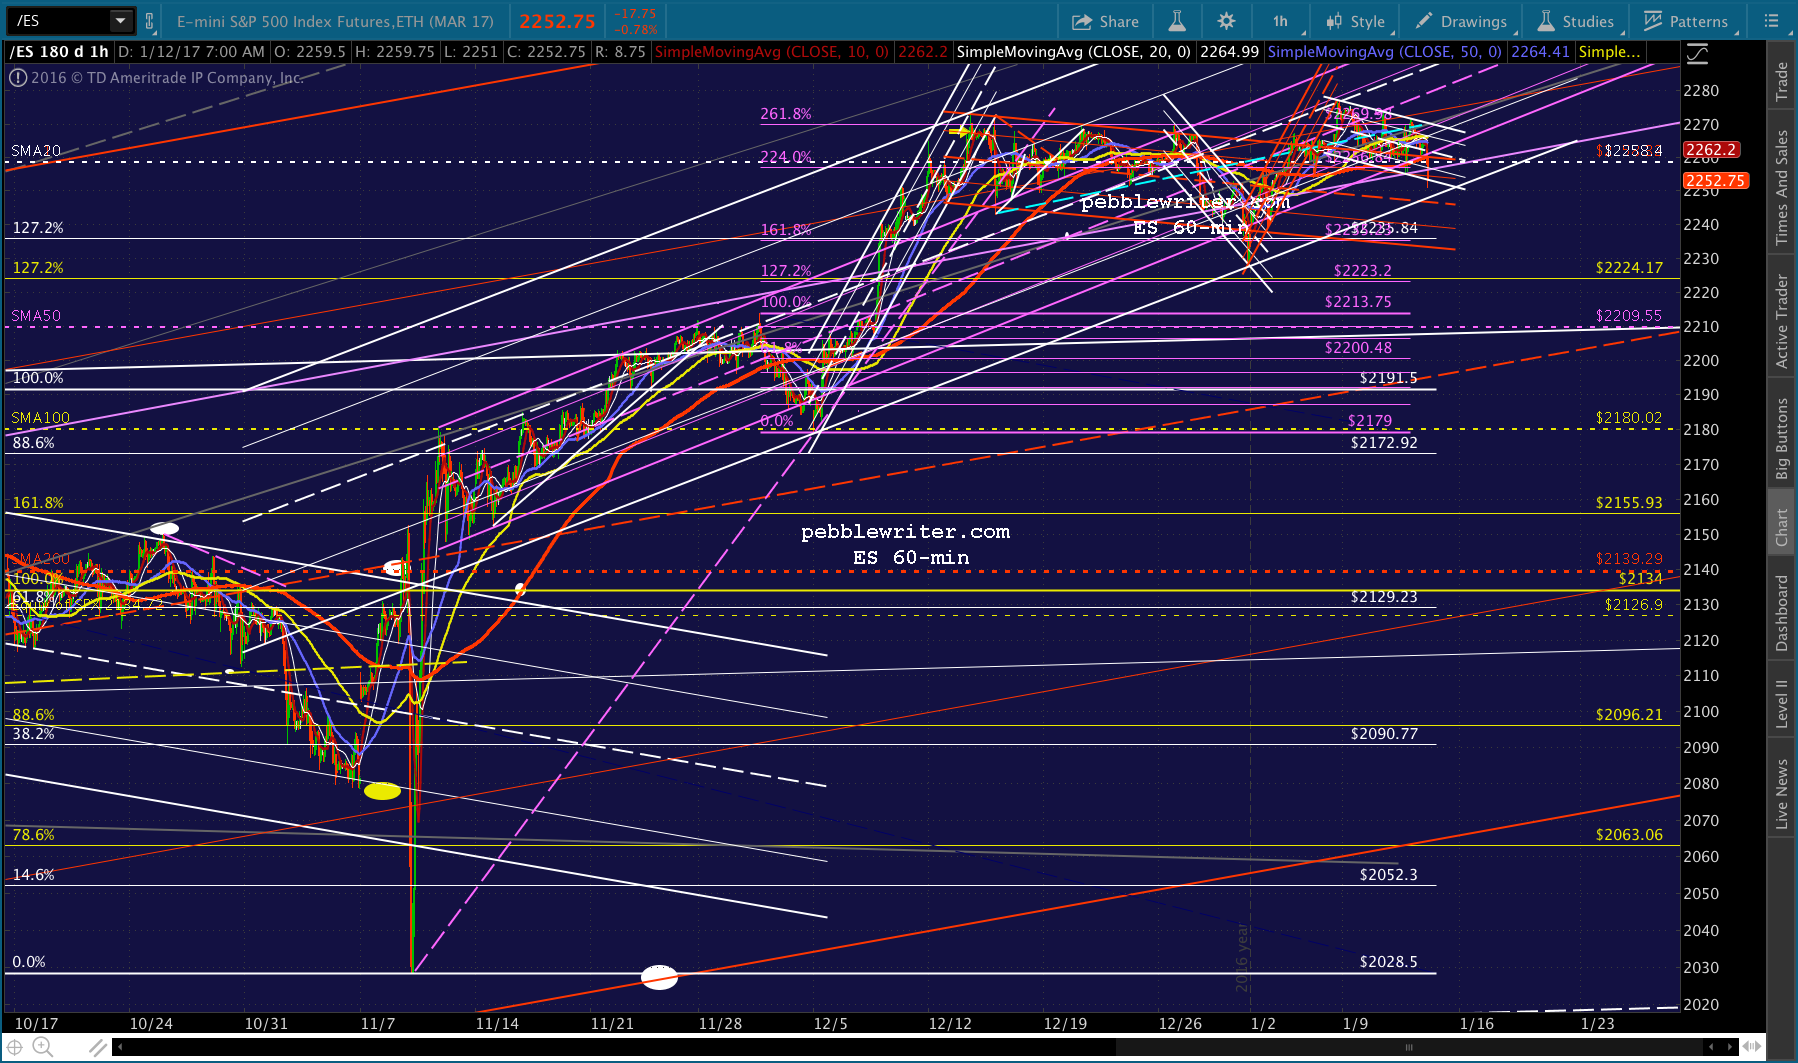
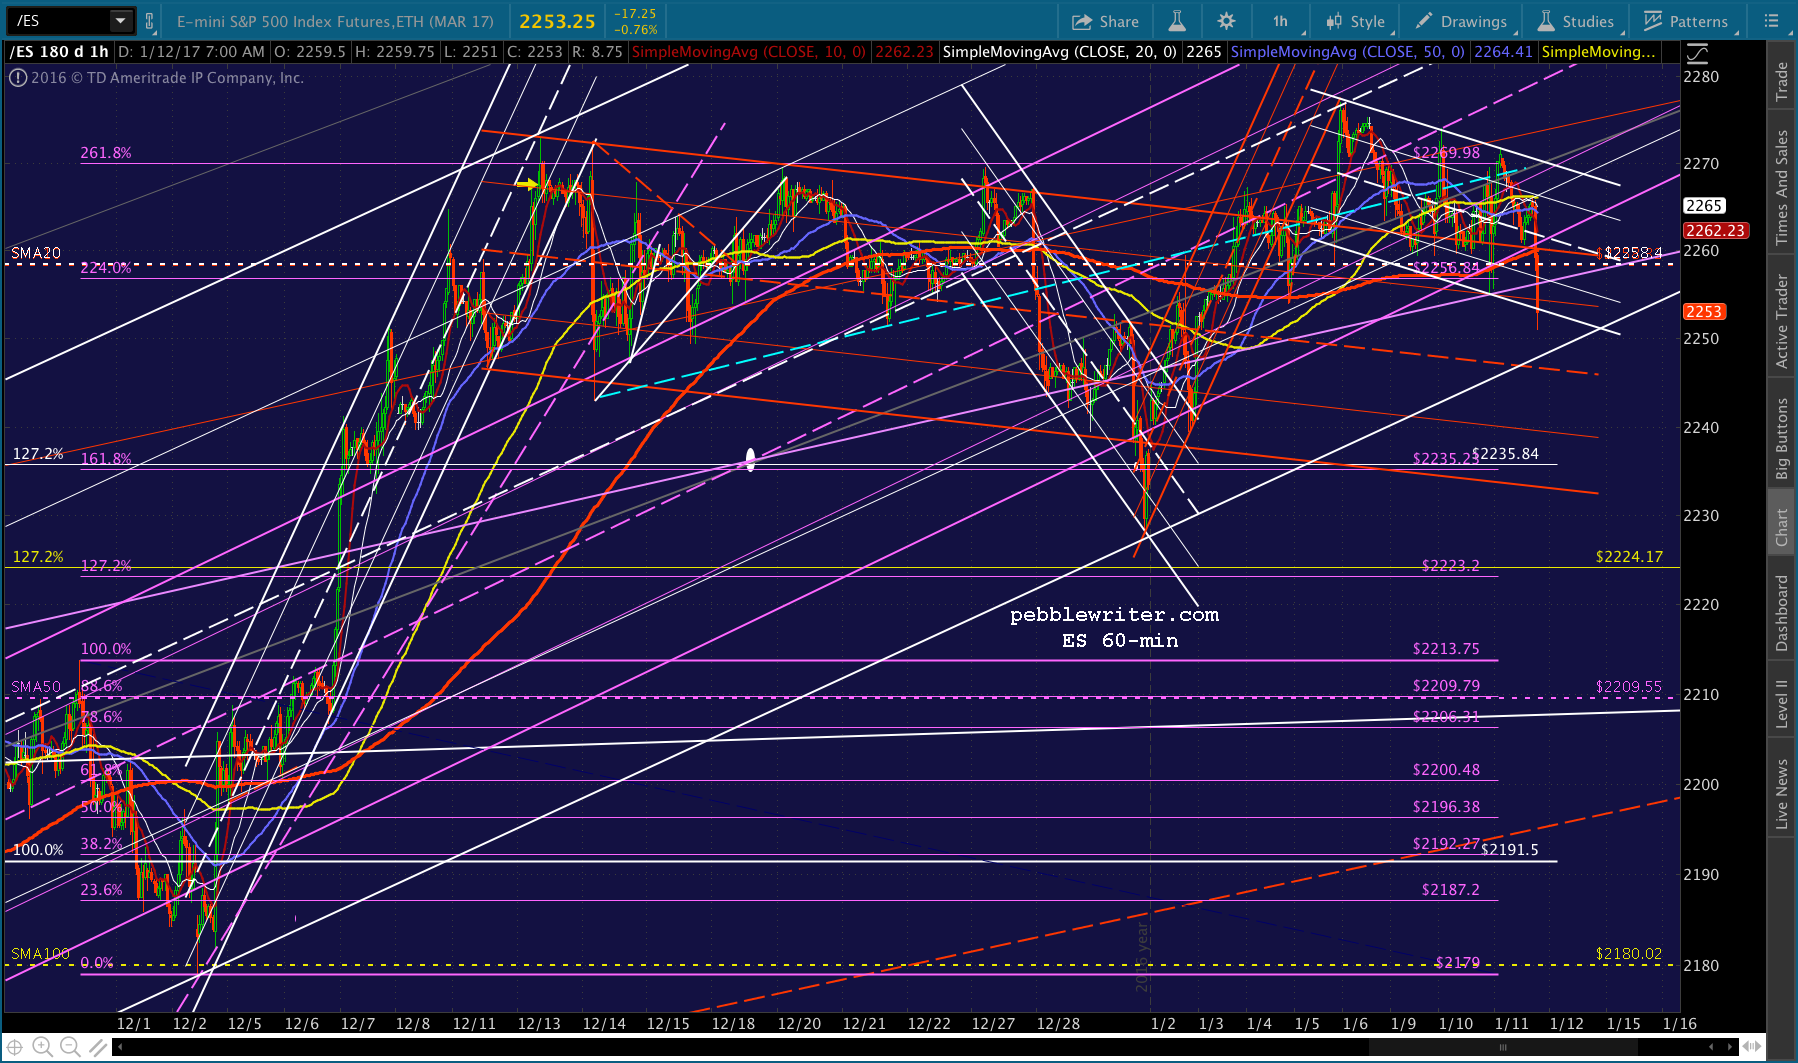
ES is almost at support at 2246.75, while SPX hasn’t quite reached its. We should get a bounce here, though it might be kind of ugly as the two try to reconcile where the reversal should be.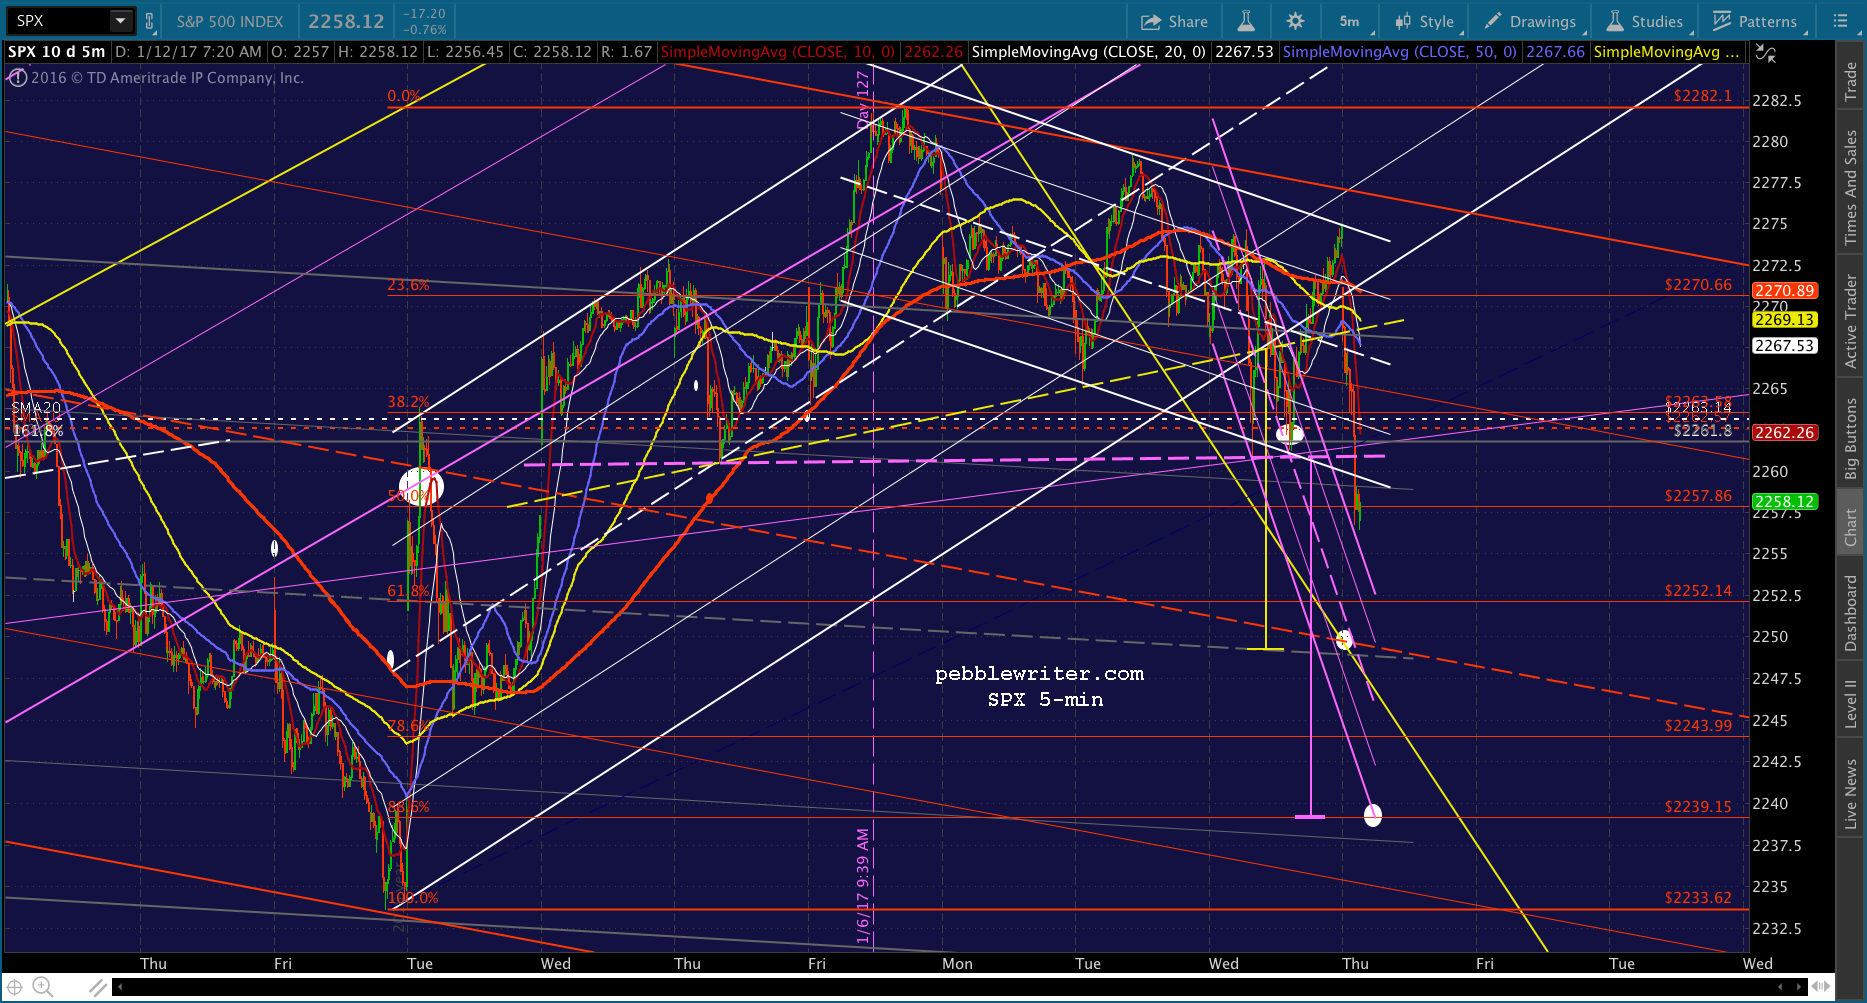
UPDATE: 1:12 PM
The bounce has reached the SMA5 100 and an internal red channel line. This would be a good place for a reversal. I’d revert to short with tight stops if you’ve been playing this bump.
UPDATE: 2:33 PM
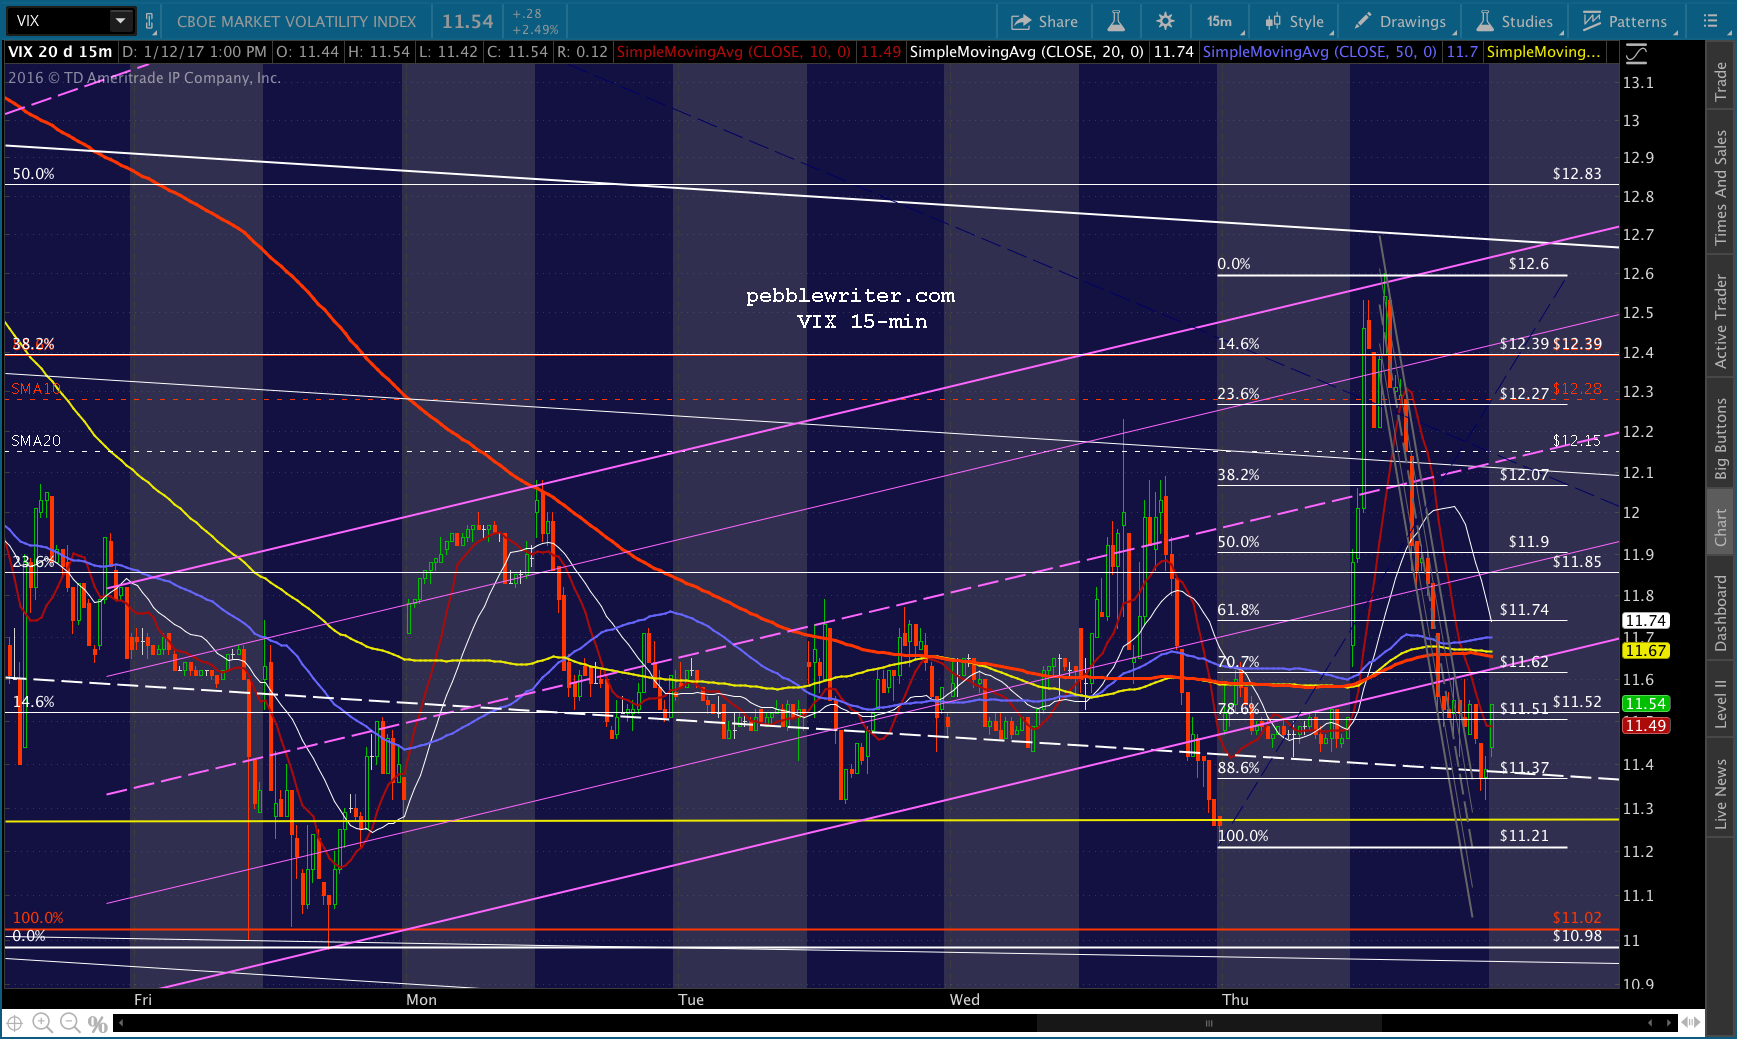
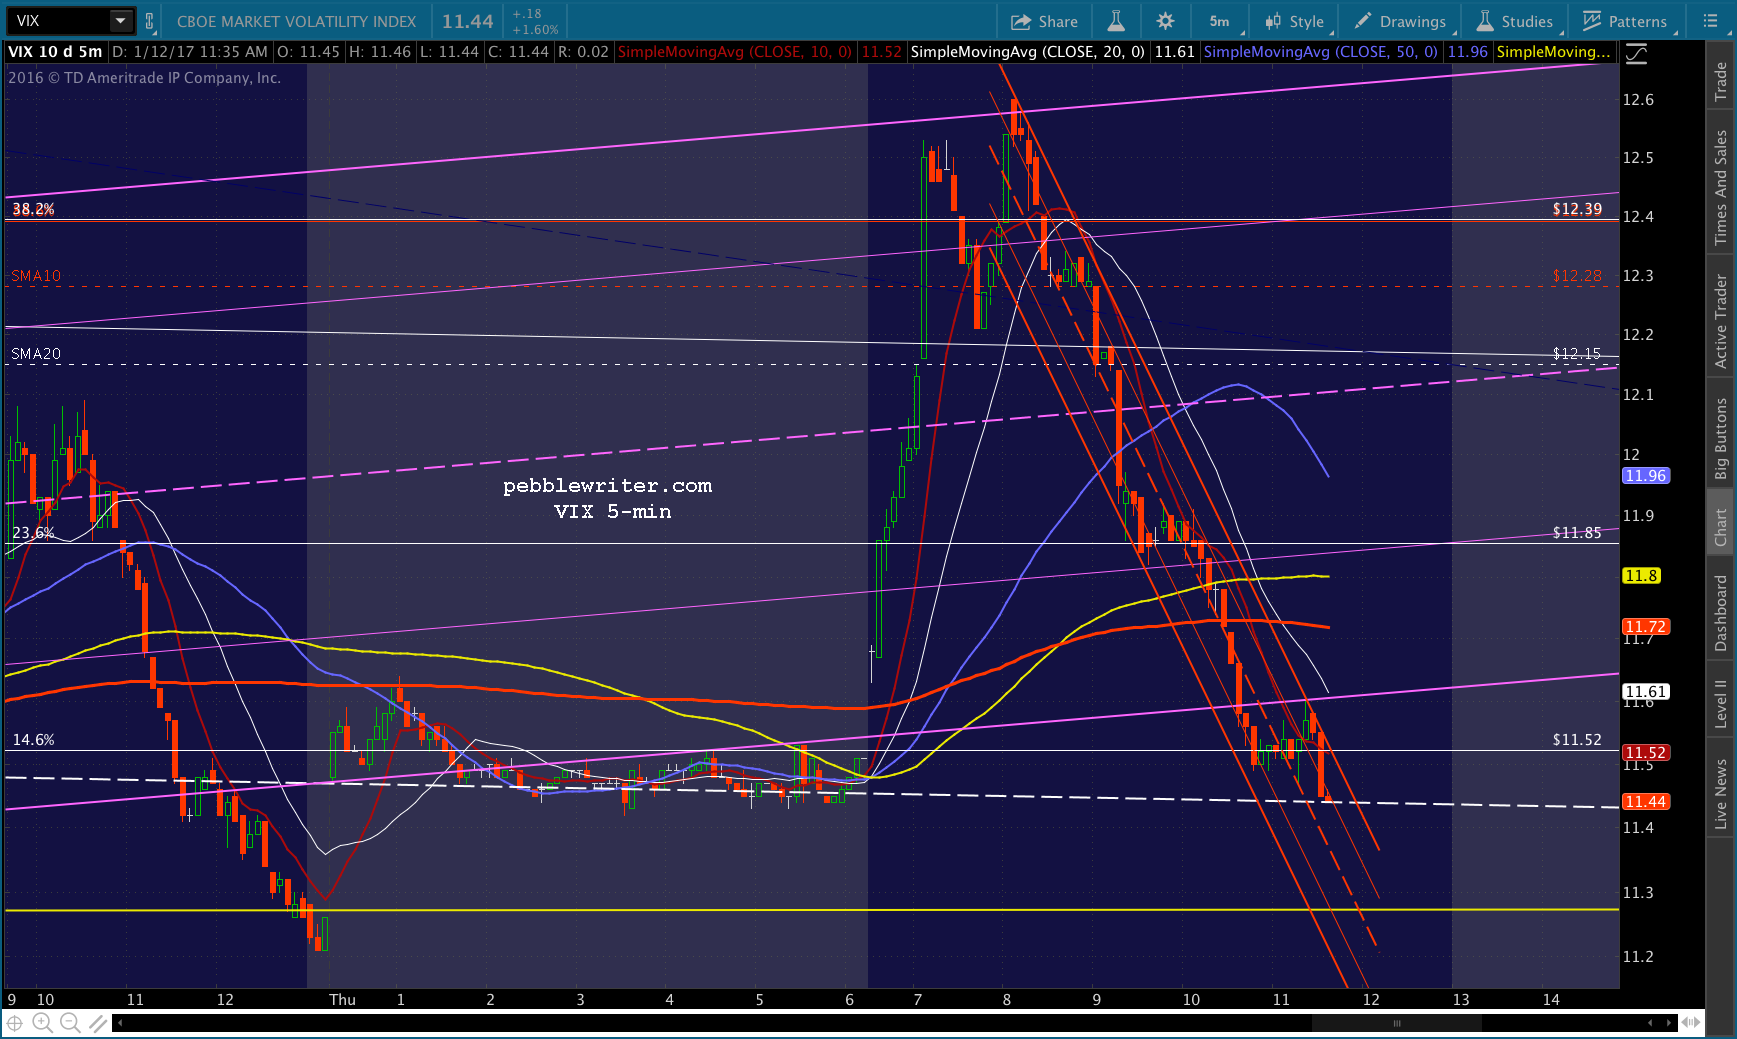
SPX is about to push through the SMA5 200 here on VIX’s continued meltdown. I’d cut the short loose here, and plan on reshorting if/when it reverses. 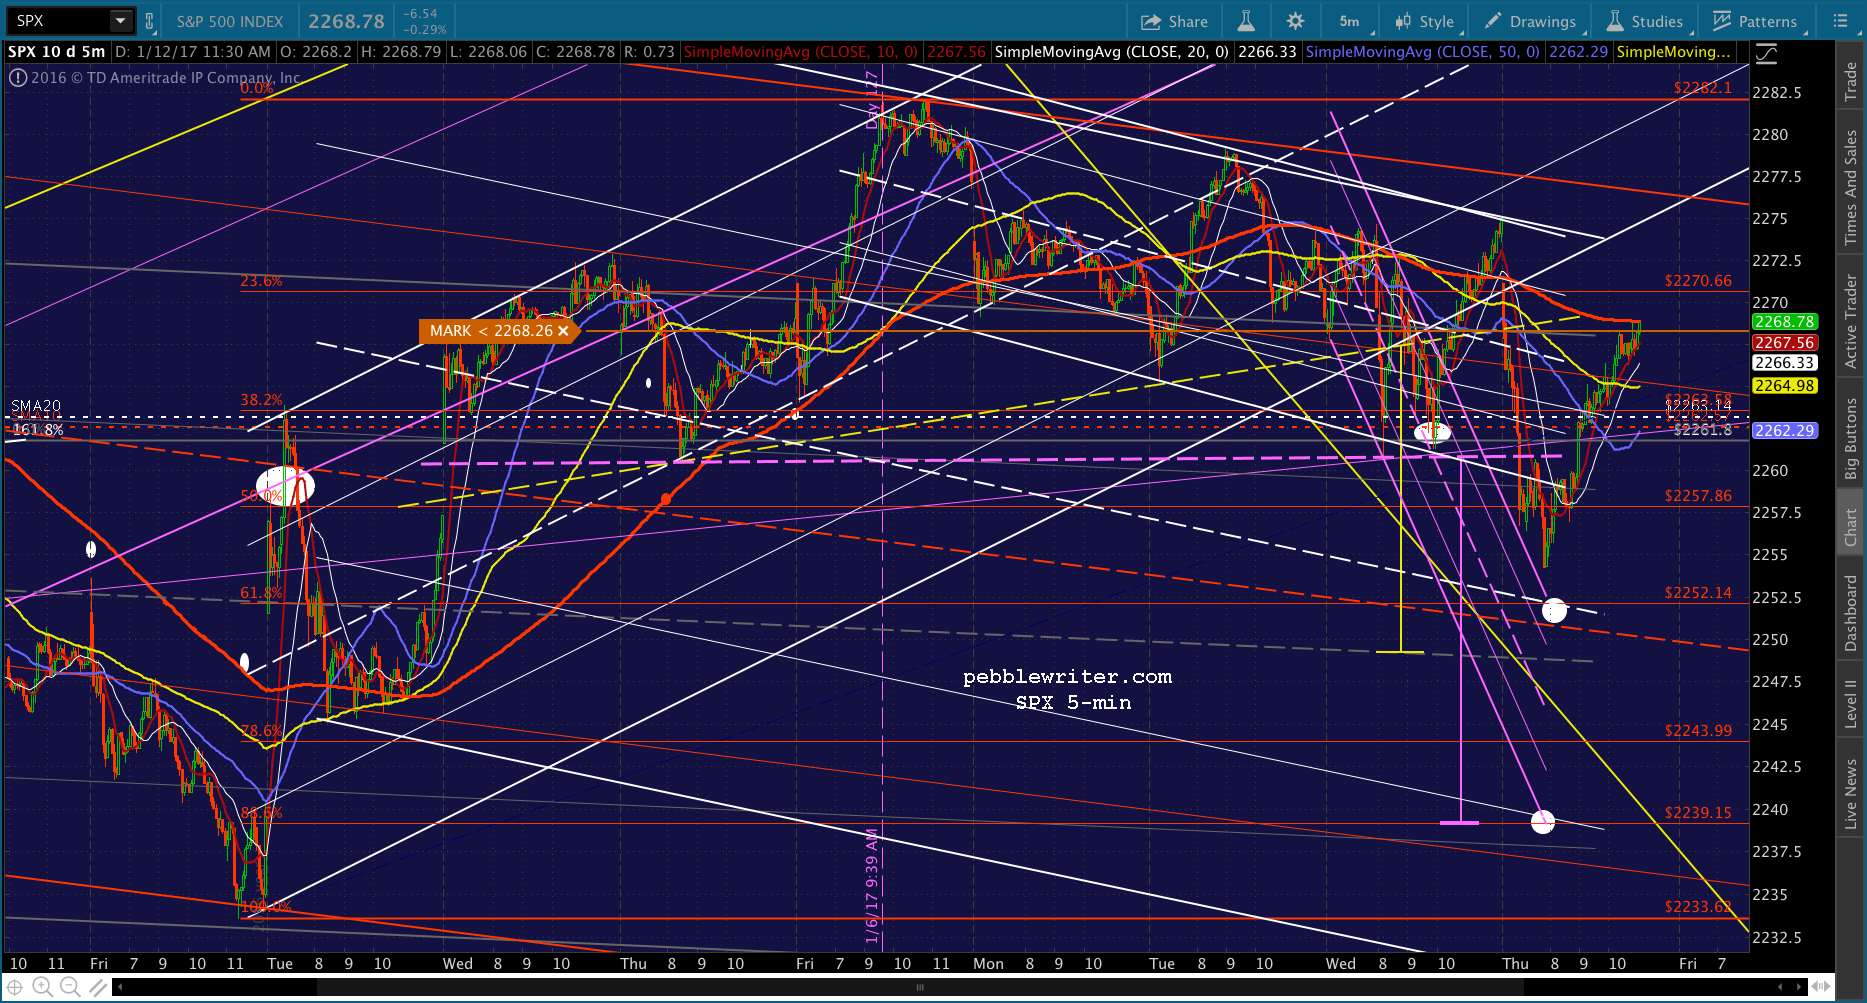
UPDATE: 2:48 PM
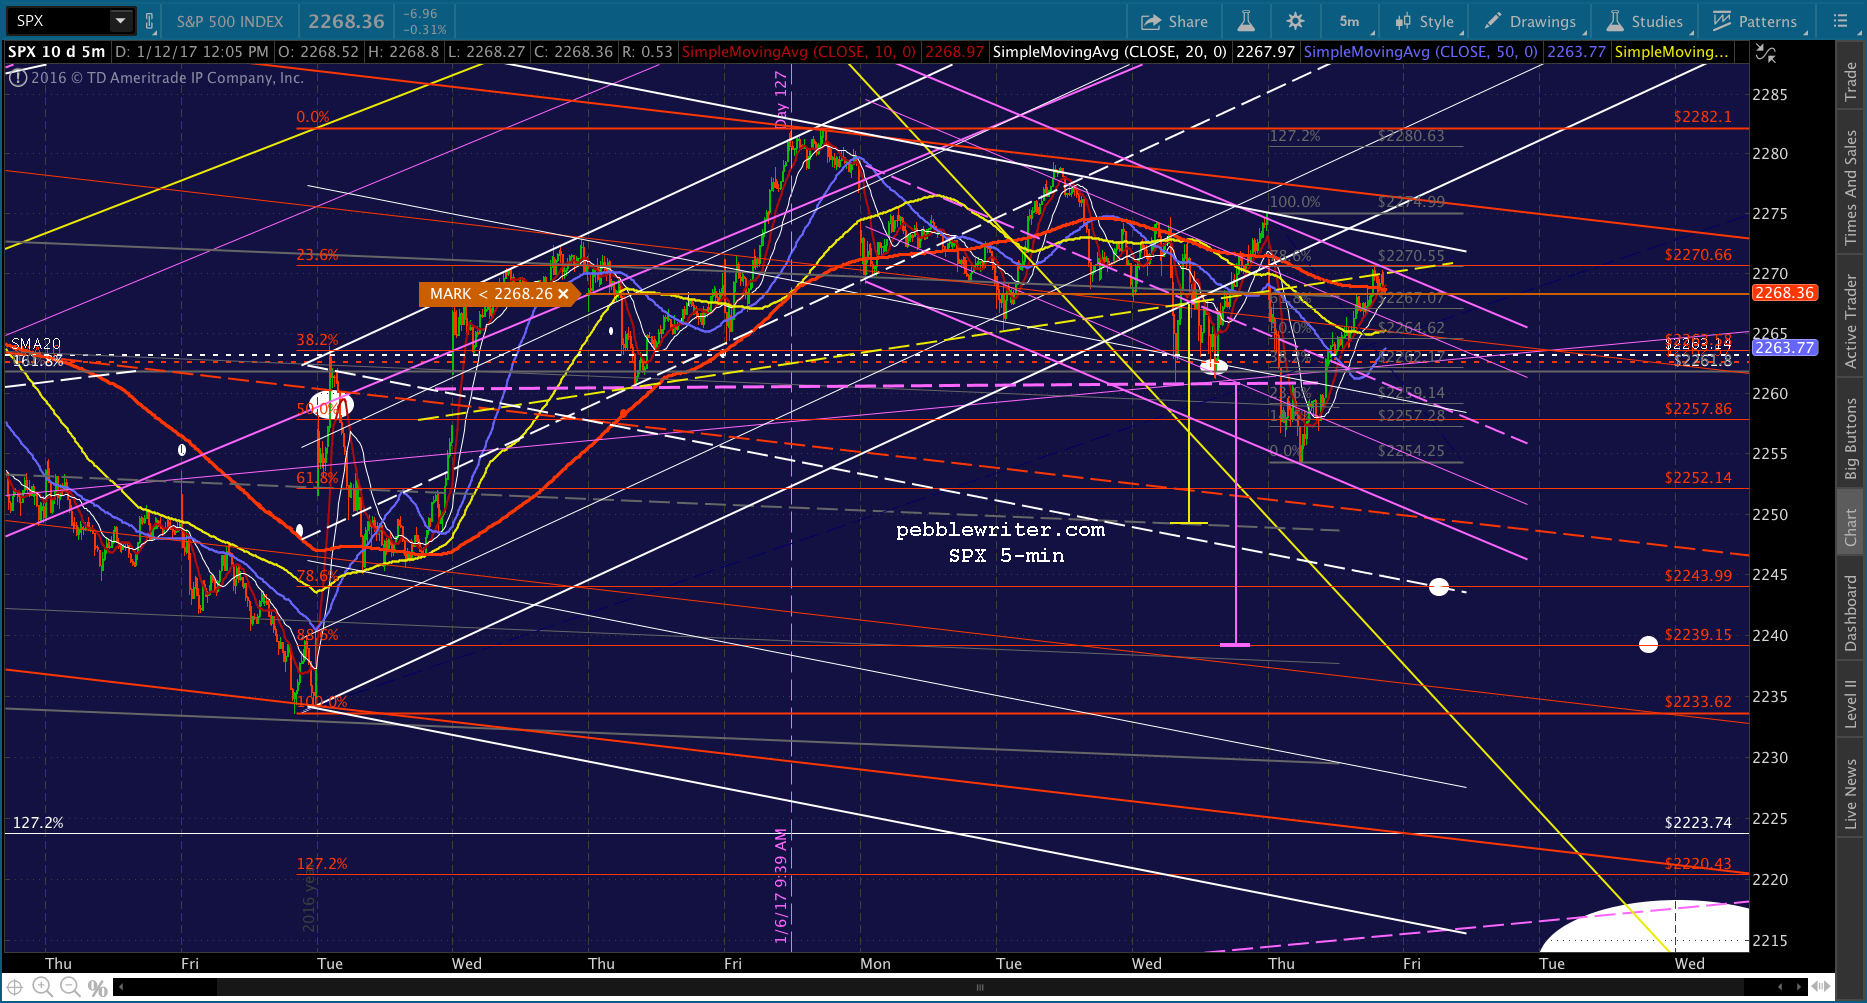
SPX tagged the yellow neckline again, and should drop through the red SMA5 10. I’d revert to short here, but keep in mind that the SMA5 10 will arrive soon and could postpone any decline. A push above 2273 would be troublesome for the short-term bearish case. Though, as we saw yesterday, it might also serve as a head fake to shake out the weak bears ahead of the larger move down I’m expecting.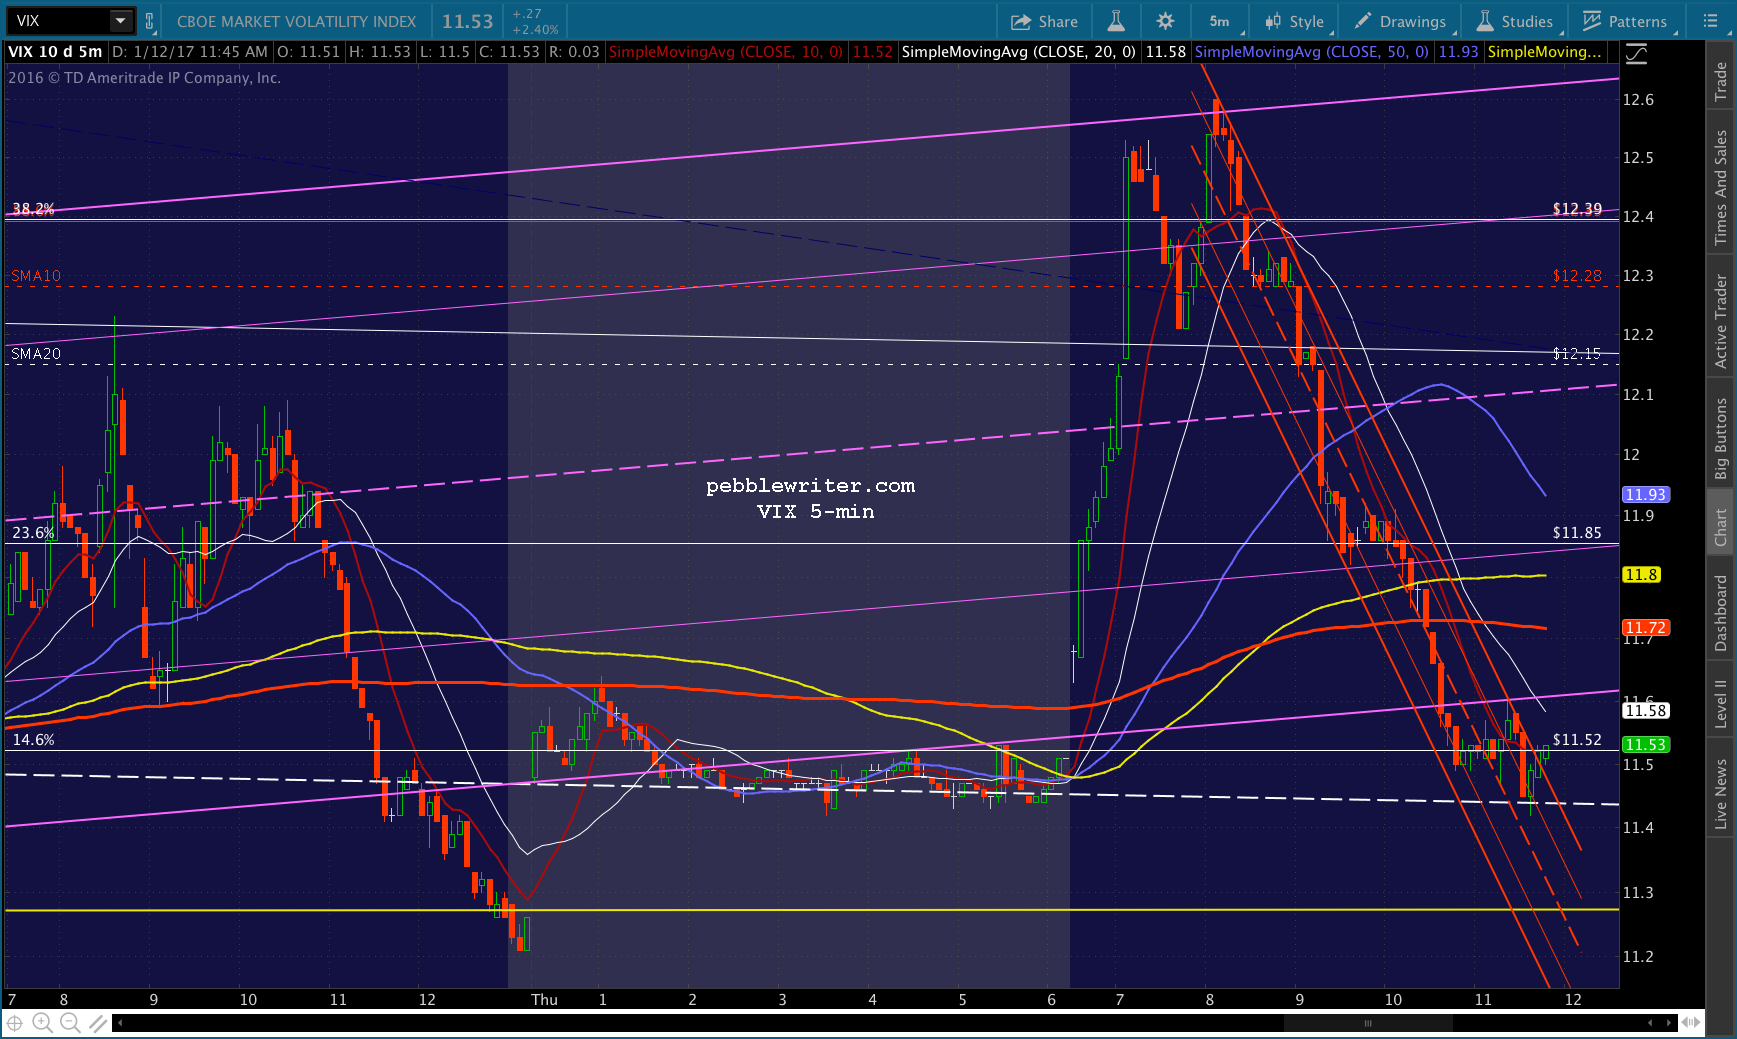
UPDATE: 3:08 PM
We got a reversal off the neckline, but are waiting for the SMA5 10 and 200 to break down. Again, I think this is likely a delaying tactic that will still yield lower prices. Hard to say whether or not SPX will reach 2252.14 today, but if not it should reach it in the morning. The premature bounce at 2254 means the .786 at 2243.99 is potentially more important than the .618. Obviously, it would be a good idea to watch closely for a bounce at either one, especially if you intend to hold short overnight. I need to jump on a conference call for the next hour, but will update the charts later this evening. GLTA.
UPDATE: 11:00 PM