Month: January 2017

  • Next Up: The Fed

    Stocks shed over 1% yesterday, easily reaching our initial two targets and almost our third before being rescued.  it was the biggest drop we’ve seen in quite some time.  A little over an hour into the session, VIX decided it had had quite enough.  It plunged 8.8% from its intraday highs…just because.  And, SPX closed off only 0.6% — still an impressive accomplishment relative to the melt-up we’ve seen over the past several months.

    The BoJ meeting was of no particular import.  The focus was more on the eurozone, and the ECB’s potential reaction to its little inflation problem.  Some are ready to talk taper, while Draghi is likely to continue pounding the table for more stimulus to provide a floor for the ECB’s growing pile of junk.

    The focus will shift, now, to the Fed — which has its own, even bigger inflation problem.  Traders know it, and they’re more than a little worried.

    continued for members(more…)

  • Charts I’m Watching: Jan 30, 2017

    CL is on the verge of rolling over, even as the ramp in USDJPY that helped prop up markets on Thursday and Friday is settling back for at least a backtest. 2017-01-30 USDJPY 60 0615The net result is that we’re finally getting some follow-though to the sell off we anticipated last week.

    Futures are currently off about 8 points, after selling off as much as 10 points overnight. Our downside targets remain essentially unchanged.

    continued for members(more…)

  • Economics: No Free Lunch

    The economic headlines are ugly this morning, with durable goods off 0.4% versus the 3-4% gain expected.  The chief culprit, of course: trade.  Funny how no one wants to buy US goods and services when the dollar is higher than it’s been since 2002 — oh, and we’re launching a trade war against the rest of the world.Screen Shot 2017-01-27 at 6.24.21 AM

    The last time exports stumbled this badly was the second quarter of 2010, which was also in the wake of a rapid run up in the USD.

    2017-01-27 DX wkly 0600

    This certainly reinforces our stagflation case, as both higher oil prices and higher USD, which have been used so effectively to prop up stocks, have painted the Fed into an ever tighter corner.

    Let’s see…  That leaves body-slamming VIX as the sole means of averting a strong sell-off today.  Prepare for it to reach new lows in 3-2-1…

    continued for members(more…)

  • Charts I’m Watching: Jan 26, 2017

    Today will be a continuation of yesterday’s Big Picture update, with a focus on the continuing relevancy of our analog from last August.

    continued for members(more…)

  • The Big Picture: Jan 25, 2017

    Yesterday, I laid out the primary drivers of the rally that’s gripped stocks since election night: USDJPY, VIX and CL.  As luck would have it, we were immediately rewarded with an affirmation of those dynamics:  SPX rallied another 15 points on a 1% USDJPY gain, a 1.7% CL gain, and VIX being smashed by 4.25% — all intraday, of course.

    The “magic” continued overnight, with VIX breaking down another 2.5% to lows not seen since July 2014.  It’s enough to send futures up another 11 points.  2017-01-25 VIX v ES 60 0625

    Is it sustainable?  Today, we’ll focus on the big picture and the continuing effectiveness of our analog.

    continued for members… (more…)

  • Central Banks and the “Markets”

    Once in a while, the normally pro-status quo Wall Street Journal surprises me and publishes an article questioning the underlying health of the market.

    In BOJ Helps Tokyo Stocks to Soar, it published an internal study indicating that 97% of the days the Bank of Japan invested money in stocks were days that the market either opened lower, or reversed to close lower after initially opening higher.  As we noted at the time [see: The Yen Carry Trade Explained], this practice, alone, was responsible for most of equities’ gains between 2011 and 2015.

    Screen Shot 2017-01-24 at 6.46.52 AM

    In yesterday’s Central Banks Embrace Risk in Era of Low Rates, the authors cite a study by Invesco Ltd revealing that 80% of central banks plan to expand their purchases of equities in the coming year.

    Screen Shot 2017-01-24 at 6.43.27 AM

    The bankers’ rationale is that rates are too low in order for them to earn reasonable returns on their excess funds. To those of us who study equity prices day in and day out, that explanation is plainly disingenuous.

    As we’ve noted countless times in the past, central banks are increasingly in the business of both directly and indirectly propping up and driving stock prices higher.  It has been obvious since late 2008, and has never been more obvious than in the past several several months.

    The sudden 138-pt rebound off the 124-pt election night plunge has been credited to a sudden appreciation for all things Trump.  And, maybe the man’s policies will ultimately be good for business.  However, the charts clearly show that the bulk of the gains came from a sharp spike in USDJPY, an unprecedented takedown of VIX futures and timely pops in the price of CL.

    2017-01-24 ES v USDJPY 60

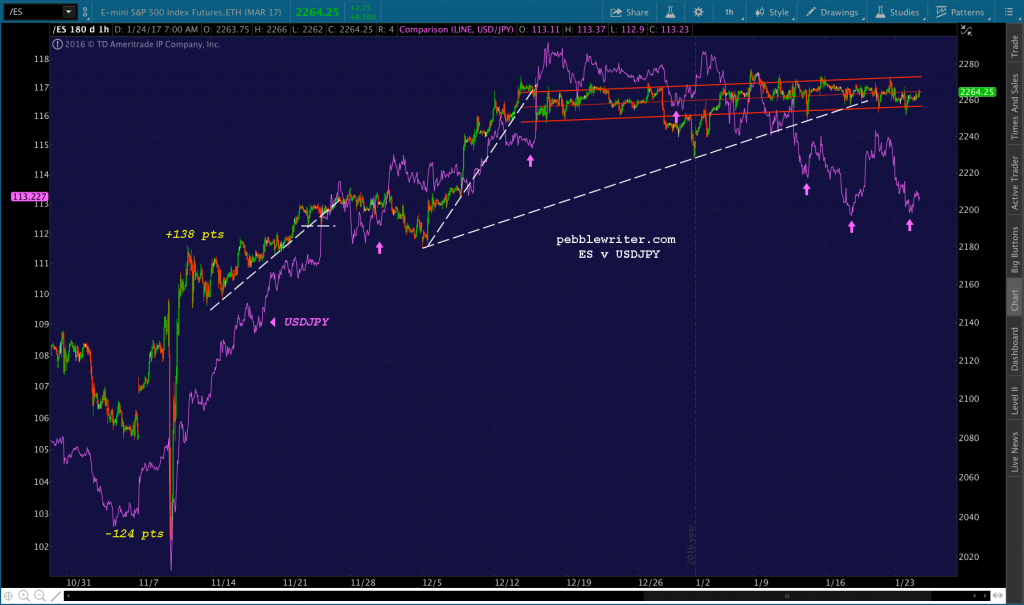
    The 17% rally in USDJPY (yen devaluation) between Nov 8 and Dec 15 was punctuated by many smaller spikes (purple arrows) that were timed to support ES every time it threatened to break trend (dashed lines.)  These spikes have continued, in maintenance mode, even though USDJPY has topped out.

    If anything, VIX’s role has been even more critical to maintaining a rally.  Once a reliable indicator of risk in the markets, VIX is now just another tool used by central banks to rescue stocks and build on rallies [see: VIX, Just Another Tool.]

    On election night, while ES was plunging 5.7%, VIX fell precipitously.  It shed 38% in less than 24 hours, and 53% by Dec 21.  Most importantly, it broke down from a rising channel that had established by the last time VIX was beat up (in order to save stocks following the Brexit vote.)2017-01-24 VIX v ES 0800

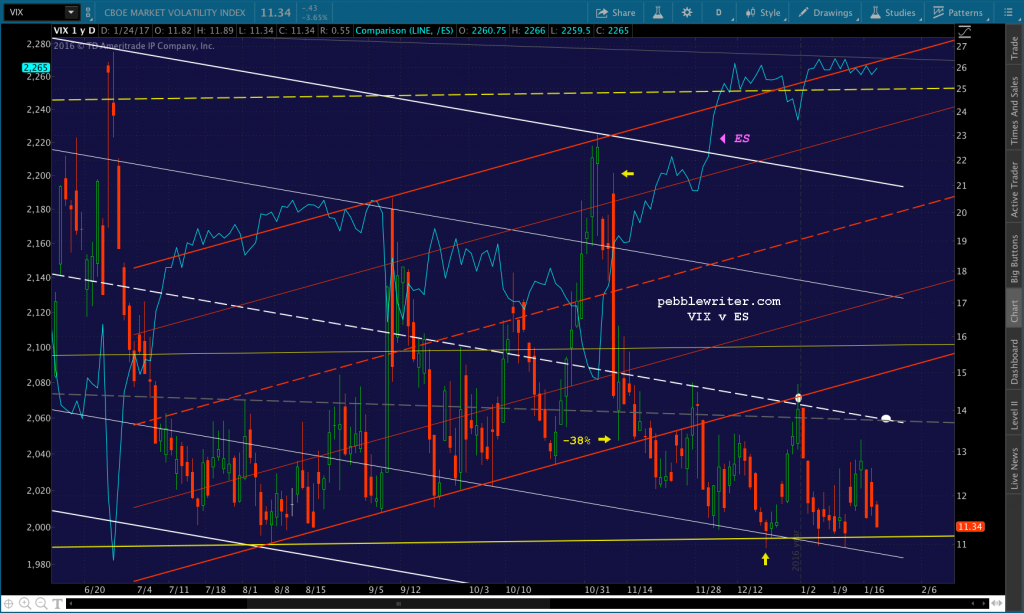
    As I write this, VIX is currently off 3.4% in order to maintain stocks in the green after the latest round of decidedly negative economic news (Dec home sales off 2.8%, even after seasonal adjustment and the usual NAR spin.)

    As has occurred repeatedly over the past six weeks, we’re left to wonder whether a a channel dating back to 2014 will break down.  But, it’s the little hits that VIX takes all day, and especially overnight, that drive the algos which drive the “markets.”2017-01-24 VIX v ES 3yr

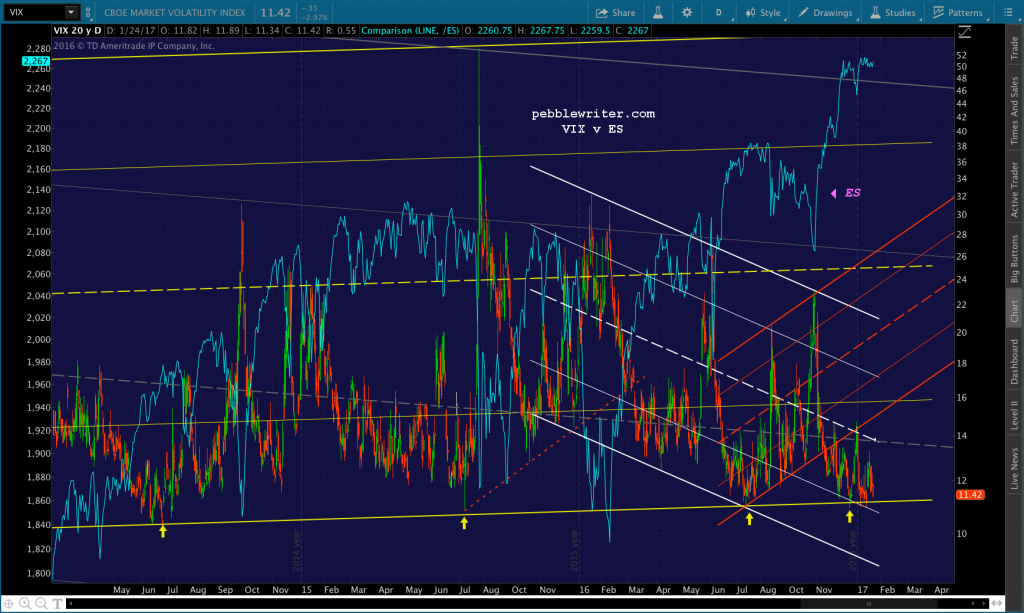
    As I wrote yesterday, it’s very difficult to get much downside going if all it takes to prevent it is some 23-year old MIT grad, sitting in a windowless room somewhere, mashing on the SHORT VIX button over and over again until prices stabilize.

    The last tool responsible for post-election rally is the price of oil.  I know it seems counterintuitive, as higher oil prices bust budgets for consumers and businesses alike.  They are also already contributing to higher inflation — which is a factor in driving interest rates higher during a period when all-time low interest rates have been instrumental in inflating asset prices in the first place.

    But, rising oil prices proved vital to stocks’ recovery in early 2016.  And, they continue to provide important support at key points in time.  Today, for instance, they are up 1.25%, working in conjunction with VIX shorting to drive SPX higher.

    An unbridled rally in USDJPY or plunge in VIX has little immediate impact on most consumers or businesses.  But, since inflation is currently a real threat to bull markets, using oil to drive markets higher requires a deft hand.

    More often than not, CL spikes when markets are opening or when intraday resistance is met.  As soon as the save/assist is accomplished, it frequently returns to whatever the prevailing trend was.  The return trip almost always occurs in the low-volume after hours, when prices are more easily propped up.2017-01-25 ES v CL 60b

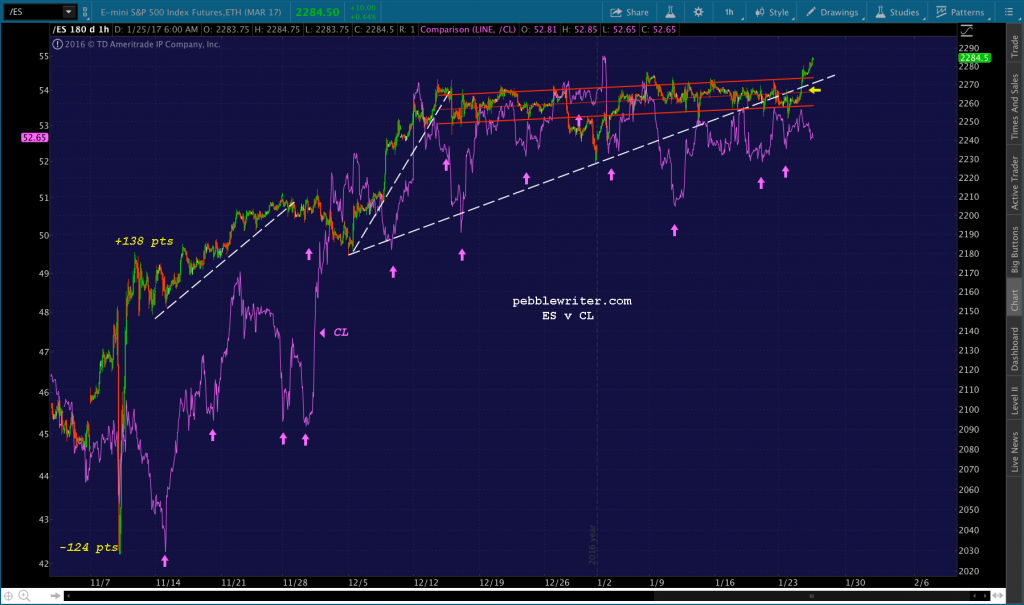
    It’s usually a safe bet that when SPX is rallying on USDJPY strength or VIX-bashing, CL will be resetting for the next time it’s needed.  Again, remaining at higher levels has real and negative repercussions that would ultimately inhibit an ongoing rally — unless it’s one which is built on a reflation theme.

    And, that’s where the rubber meets the road, isn’t it?

    Official government sources report low unemployment, robust job growth, rising asset prices, etc.  And, corporate buybacks and historically low interest rates enable most companies to report steadily increasing EPS.

    Yet, real income still languishes below 2000 levels, even for the top 5%.

    Screen Shot 2017-01-24 at 10.10.55 AM

    Real per-capita retail sales, even using the government’s questionable inflation data, has yet to reach 2006 levels.Screen Shot 2017-01-24 at 10.40.13 AM

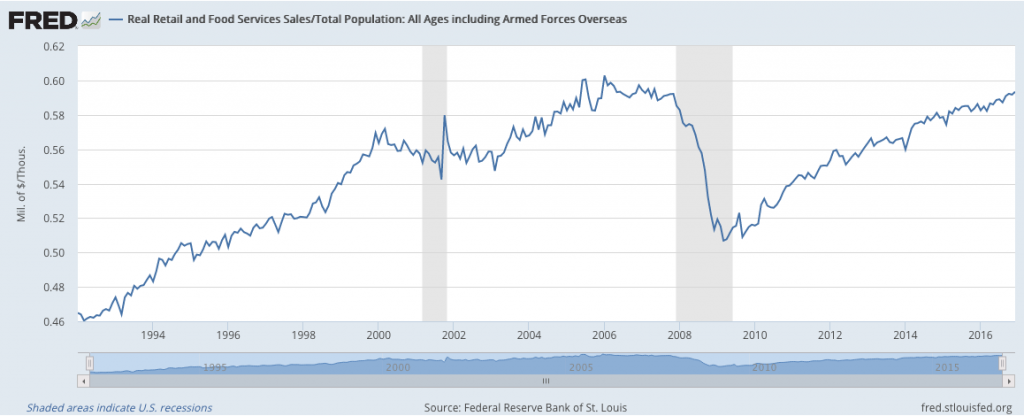
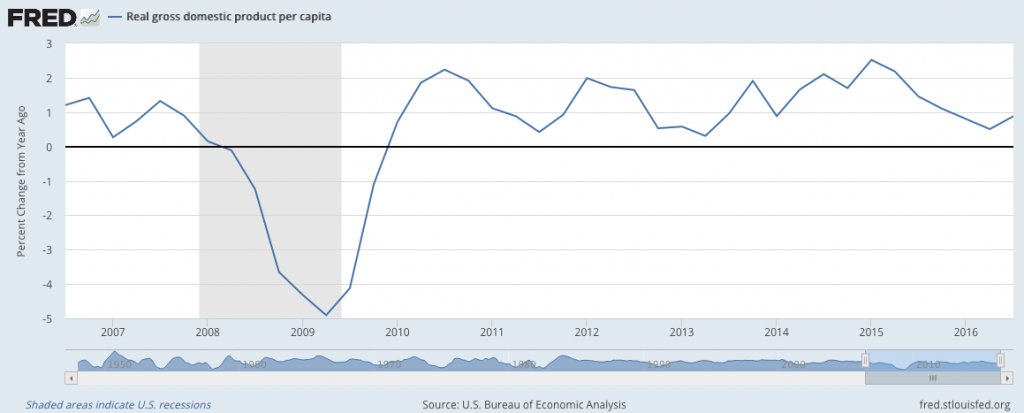
    And, real per-capital GDP growth has retreated back below 1%.

    Screen Shot 2017-01-24 at 12.13.05 PM

    Comparing real household income to our ever-expanding debt, and it’s pretty clear we will run into a severe imbalance between income and debt service — especially if Trump follows through on his promise to lower taxes.Screen Shot 2017-01-24 at 12.18.55 PM

    Contrast the above with lethargic corporate revenue growth…

    Screen Shot 2017-01-24 at 12.24.13 PM

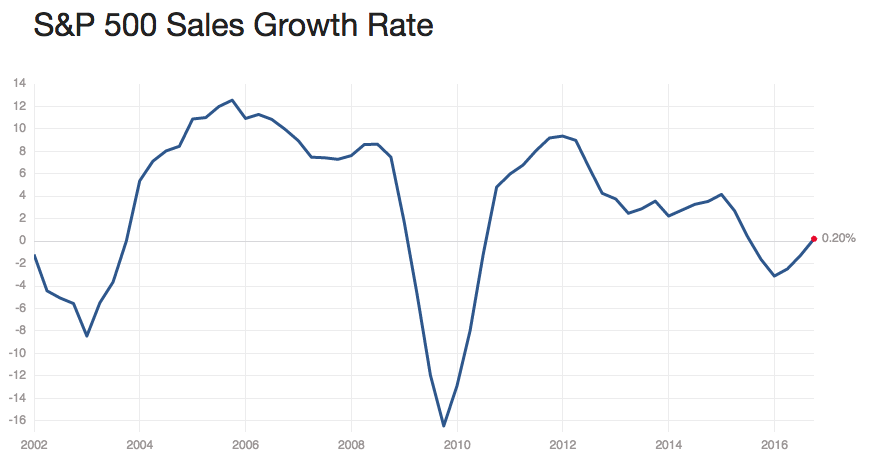
    …and, it’s more than a bit alarming that PE ratios are higher than at any time in US history except for just prior to the 1929 and 2000 crashes (we recently topped the 2007 figure.)

    Screen Shot 2017-01-24 at 12.24.48 PM

    Are stock prices sustainable in the face of all the above?

    Since I began writing this article at 4am this morning, S&P 500 futures have gained nearly 1% and SPX, itself, just set a new all-time high.  Why?  VIX is currently off by 4.25%, USDJPY has gained over 1% and CL added 1.7%.

    I sat next to a writer/producer friend at our daughters’ basketball game last night.  He asked me about the market, and I replied that its recent behavior is more closely related to his business than mine.

    A narrative was formed, back in 2008, that enough easy money would paper over the unraveling precipitated by the Great Financial Crisis.  For the most part, it worked pretty well.  When low interest rates didn’t work, The Powers That Be moved on to zero interest rates and, finally, on to negative interest rates.

    They allowed banks and other financials to extend and pretend — shifting focus from enormous balance sheet problems that, in many cases, still exist both here and abroad.  They let many of the same players who created the GFC not only continue in business, but looked the other way as old bubbles were re-inflated and new ones were formed.

    Central bankers are praying that the narrative will take — that investors will ignore such charts as those above and focus, instead, on the bright, shiny new administration and its promise for the future.  If only asset values can climb high enough, so the story line goes, there’s bound to be a trickle down effect that will benefit all — or, at least, allow the bankers to get out whole.

    Or, maybe, they have no other cards to play besides depressing the yen and VIX and inflating oil prices.  Perhaps, in the confusion, folks won’t notice the yawning gap between nominal and real rates of return that will surely decimate their pensions and imperil their children’s futures.

    We’ll review, tomorrow, what options central bankers have.  What would it take to keep all the plates spinning? What does it mean for those of us trying to anticipate and capitalize on price trends?

    Stay tuned.


  • Breaking Out or Down?

    Short VIX ButtonIt’s been a lousy environment for trading the last 5-6 weeks.  Although SPX closed Friday exactly where our Jan 27 (Day 141) target was set, there have been very few dips since early December that provided in much in the way of trading opportunities — unless you enjoy mindless, intraday dip-buying.

    Those who trade after-hours have had things a little better.  But, even the eminis chart shows that a long series of CL- and VIX-driven prop jobs dating back to Dec 9 have kept ES bouncing around in a very narrow range [see: VIX – Just Another Tool.]

    2017-01-23 ES 60 0605

    Friday was more of the same, as the initial gap higher was driven entirely by a nonsensical spike in CL (which quickly faded as soon as the inaugural address began) and was saved from a negative close by VIX being slammed by over 6% in the final hour.

    It’s obviously very difficult to get much downside going if all it takes to prevent it is some 23-year old MIT grad, sitting in a windowless room somewhere, mashing on the SHORT VIX button over and over again until prices stabilize.

    continuing(more…)

  • Goldman’s Slick Trick

    As a chartist and technical analyst, I spend an inordinate amount of time thinking about how and why prices get where they’re going.  Like most who forecast markets every day, I gave up on the random walk hypothesis a long time ago.  It’s simply not consistent with the evidence splayed across my monitors every single day.  Goldman Sachs’ recent breakout is a great case in point.

     *  *  *  *  *

    Two months ago, I noted that Goldman Sachs had reached a pivotal price point.  From Crunch Time, posted on Nov 17.

    Goldman is at a critical point in its chart where it must either break out or break down.  You might think, them being Masters of The Universe and everything, the stock had done at least as well as the S&P 500.

    Not so.  After all this time, it climbed briefly above its .786 retrace even as SPX was approaching its 1.618 extension [our long-held upside target at 2138, which SPX essentially tagged on May 21, 2015.  See: The Last Big Butterfly.]

    2016-11-17-gs-wkly-1238If we look at a close-up since those 2015 highs, we can see that GS only recently started making a big comeback [after plummeting 37%.]

    But, in so doing, it has merely backtested a TL from the 2009 lows and completed a Bat Pattern.  In other words, it’s at stiff resistance right now.  And, at roughly 7.5%, it’s the single biggest component of the Dow.2016-11-17-gs-v-spx-daily-1241

    Because GS is the single biggest component of the Dow, its ability to break out was essential to the Dow’s own breakout attempt.

    I had posted this chart the day before in The Dow Makes Like SPX — Matters.  It aptly illustrates how the Dow — after four failed attempts to break out of its megaphone pattern and rising red channel — was mounting yet another attempt, but running into resistance at the 1.618 extension of 18,974.

    For newbs, 18,974 is derived by adding 1.618 times the Dow’s drop between 2007 and 2009 to its 2009 lows: a variety of a Butterfly Pattern which, as was the case with SPX, can provide an excellent shorting opportunity.2016-11-16 DJI wkly 0620

    When SPX reached its 1.618 extension [see: The Last Big Butterfly] it fell 15.2% (DJIA fell 16.2% at the same time.)

    If stocks fell 15-16% again after DJIA reached its 1.618 extension 18 months later, investors might well have run for the hills.  Thus, GS’s role — as leader of the Dow — was even more important.

    On Nov 14, GS first reached what I considered strong, triple resistance: the .886 Fib level (white) at 209.59, the falling white TL and the rising white channel top.  It sat at that price level for two weeks, waiting for its SMA10 to catch up – an indication that there were as many sellers as buyers at 205-210.  Fortunately, Goldman didn’t have to look far for more buyers.

    2017-01-20 GS MAs and vol

    Leading up to Nov 8, daily volume had averaged 2.5 – 3.0 million shares.  The stock had bumped along on top of its rising SMA10 until Nov 3-4, when it briefly fell below.  On Nov 9, the day after the US election, volume spiked from 2.6 to 7.8 million shares and GS spiked 10 points (5.8%) through its .618 Fib level.  The following day, it spiked another 12 points on 11.3 million shares.

    Of course, stocks in general were soaring on truly massive manipulation in VIX, USDJPY and, later, CL, which wiped out the initial correction after the election results become obvious  [for more, see VIX: Just Another Tool.]  But, as mentioned above, they needed a reason to break out, not just rise to another reversal point.

    As luck would have it, Goldman has a stock repurchase plan that offers the corporation a great deal of discretion as to when it repurchases shares.  I don’t have access to the plan documents, but Goldman was kind enough to share this information in its 4th quarter earnings press release.

    During the year, the firm repurchased 36.6 million shares of its common stock… including 7.6 million shares during the fourth quarter at an average cost per share of $197.80.

    The first day in the 4th quarter that GS even reached 197.80 was Nov 10 (the purple arrow below), the day that volume spiked to 11.3 million shares as the stock’s 40% spike was gaining momentum.2017-01-20 GS daily 0625

    Unless I miss my guess, we’ll learn in next quarter’s presser that purchases continued the following week in order make sure GS stayed ahead of the curve until up past the next resistance: the .886 Fib level at 227.52.  It slipped through with little fanfare (the yellow arrow) on Dec 5 — again, on elevated volume — and, is returning to rebrand that former resistance as support.

    Were Goldman’s actions somehow shady or inappropriate?  Nope.  They owe it to their shareholders to get the stock as high as legally possible. The fact that they effectively used tools at their disposal to break through resistance is a testament to their keen understanding of the way markets work and the way investors think.

    Happily for the top officers and directors of the corporation, stock options were exercisable around Nov 15-16 — a couple of days after the stock repurchase plan helped goose the stock price by 20%.

    For folks such as former President/COO Gary Cohn, who is the new director of the National Economic Council and Trump’s assistant for economic policy, it amounted to an extra $6 million on options exercised in that quarter alone.  Beats the hell out of a gold watch.

    Given the sheer number of former Goldman execs who are going to work for Donald “Drain the Swamp” Trump, I suspect there will be many more such paydays ahead for his former colleagues.

    For the rest of us, the muppets trying to keep up with all the creative ways in which the market is rigged “shareholder value” is being created, GS offers some valuable lessons.  The stock market isn’t really a “market” anymore.  Those who ignore this fact will underperform.  Those who recognize it, and create new ways to manipulate prices, will continue to reap outsized rewards.


  • What Now, VIX?

    VIX has been playing cat and mouse with traders for months, now.  We’ve seen numerous head-fakes — breakouts which might have signaled sell-offs, that were quickly slammed back down below overhead resistance.

    As I wrote last month [VIX: Just Another Tool], this has become the norm for this once reliable indicator of risk in the markets.  So, traders could be forgiven for believing this latest breakout is just another ruse.2017-01-19 VIX v ES 60 0600

    Today marks the 11th session in a row where ES has opened and/or closed within 2 points of where its SMA10 now resides (2266.70.)  Aside from a brief dip that was quickly corrected by the last VIX smackdown (Dec 30 – Jan 6), it has gone essentially nowhere.  Perhaps it’s time for a little excitement. 2017-01-19 ES daily 0635

    continued for members(more…)

  • Tick Tock

    Between gas, rent and health care, official CPI rose 0.3% in December and 2.1% from a year ago.  It’s the highest since June 2014, and just a tad below the 2012 highs.  Of course, the official CPI data are as legit as employment data — which is to say “Not!”  For more, see John Williams’ explanation on his excellent Shadow Government Statistics.

    Even these deliberately deflated data illustrate a growing problem with the financial status quo: higher inflation begets higher interest rates, which will have a chilling effect on profitability, valuations and – dare we say it? – the fiscal soundness of every over-indebted corporate, government, and private entity on the planet.

    Global Debt Growth 2017-0111

    The twin remedies for higher stocks prices — the falling yen and higher oil prices — are running out of maneuvering room.  The plates might still be spinning, but the clock is ticking.

    continued for members(more…)