Today will be a continuation of yesterday’s Big Picture update, with a focus on the continuing relevancy of our analog from last August.
continued for members…
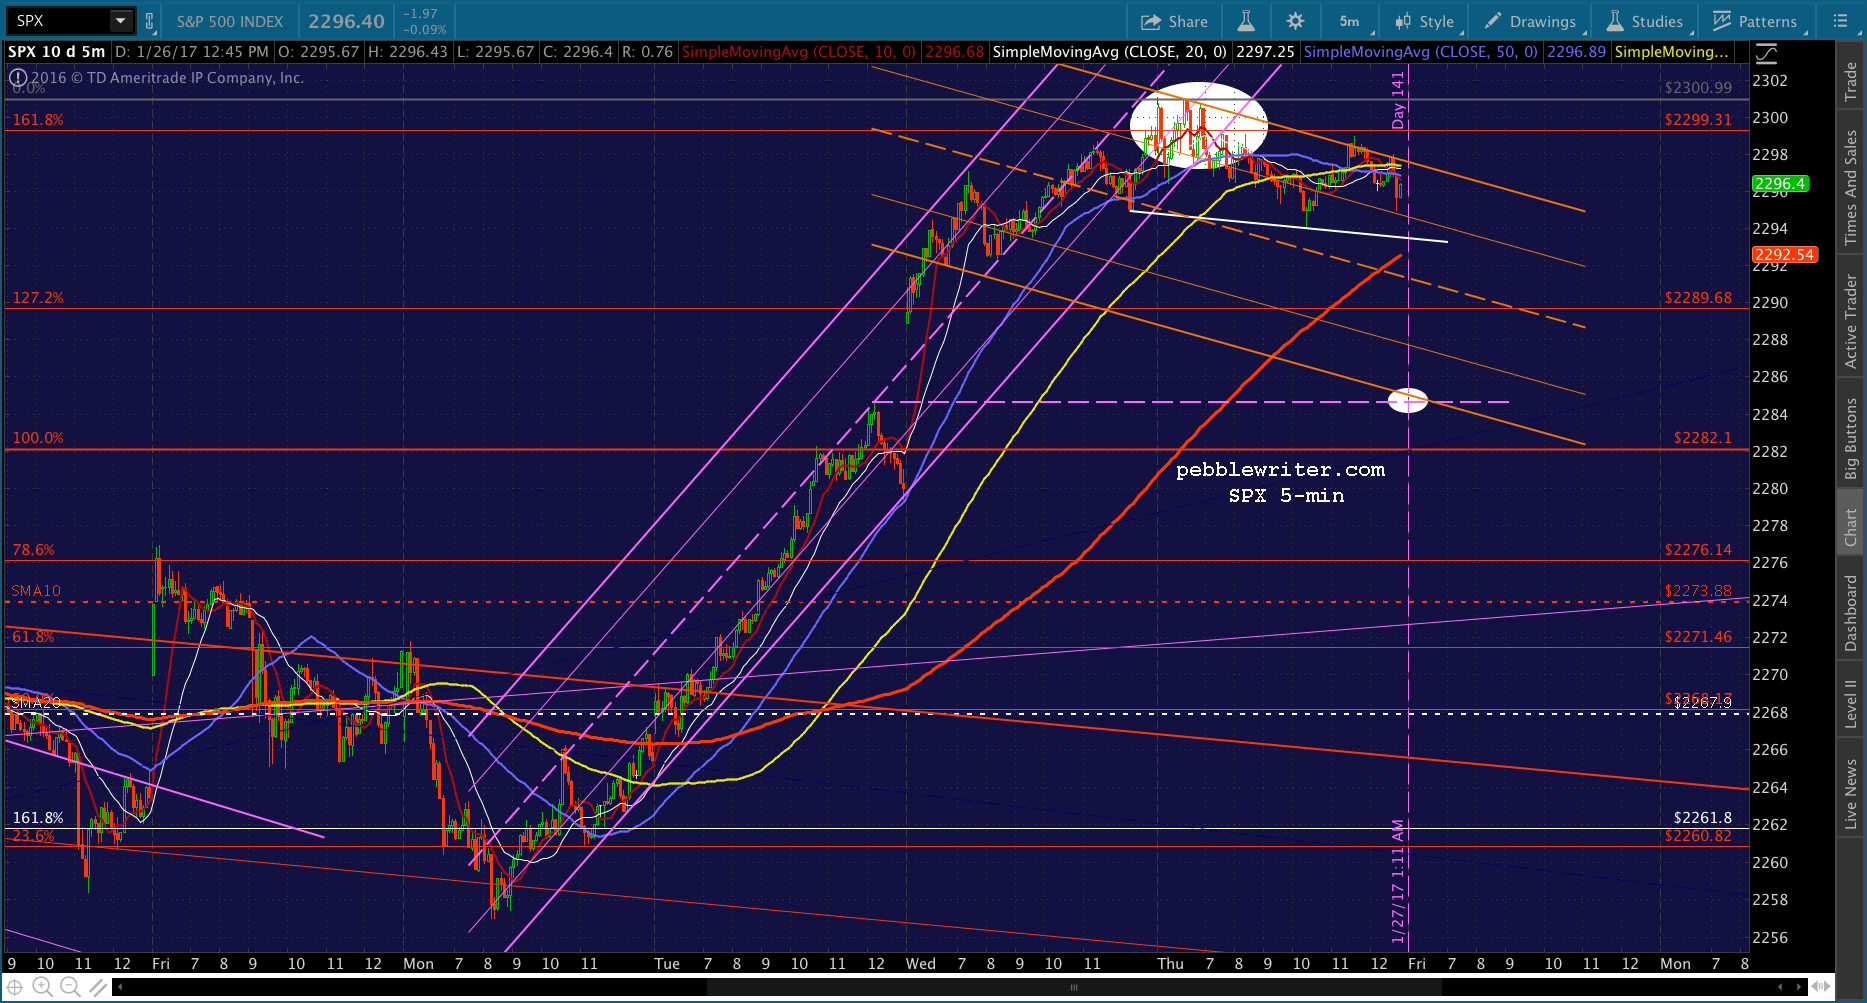
The futures are currently flat. As mentioned last night, SPX has reached a small-scale Fib 1.618 extension at 2299.31 which would put a damper on things ahead of the idealized Jan 27 (ideal) interim high.
There’s a gap to fill at 2284.63, which would make a nice downside target if we can stay in the red. The SMA10 is at 2273.88 and rising, which would serve as a secondary target. Obviously, a sustained push through 2300 would be good enough reason to switch to long for the ride to 2330ish.
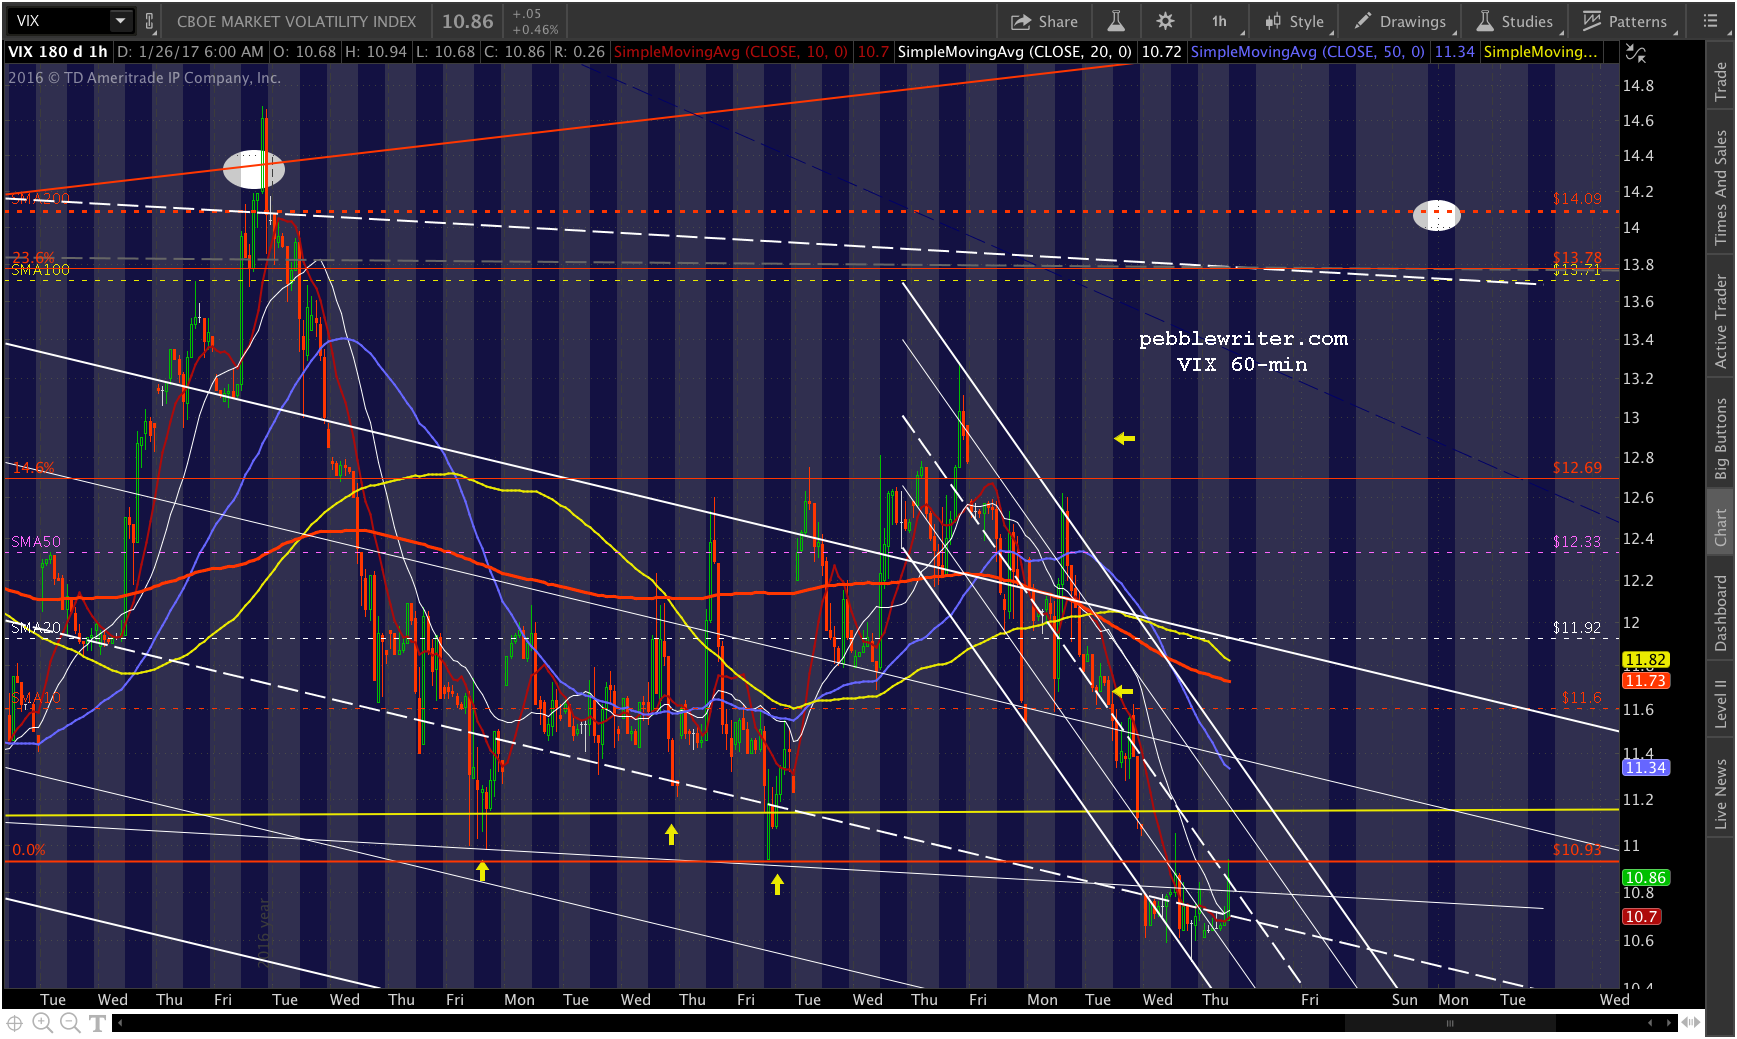
 It will boil down to the algos, which are currently getting a boost from CL even as VIX is edging higher. Perhaps they’ll let a little air out of the current overbought conditions.
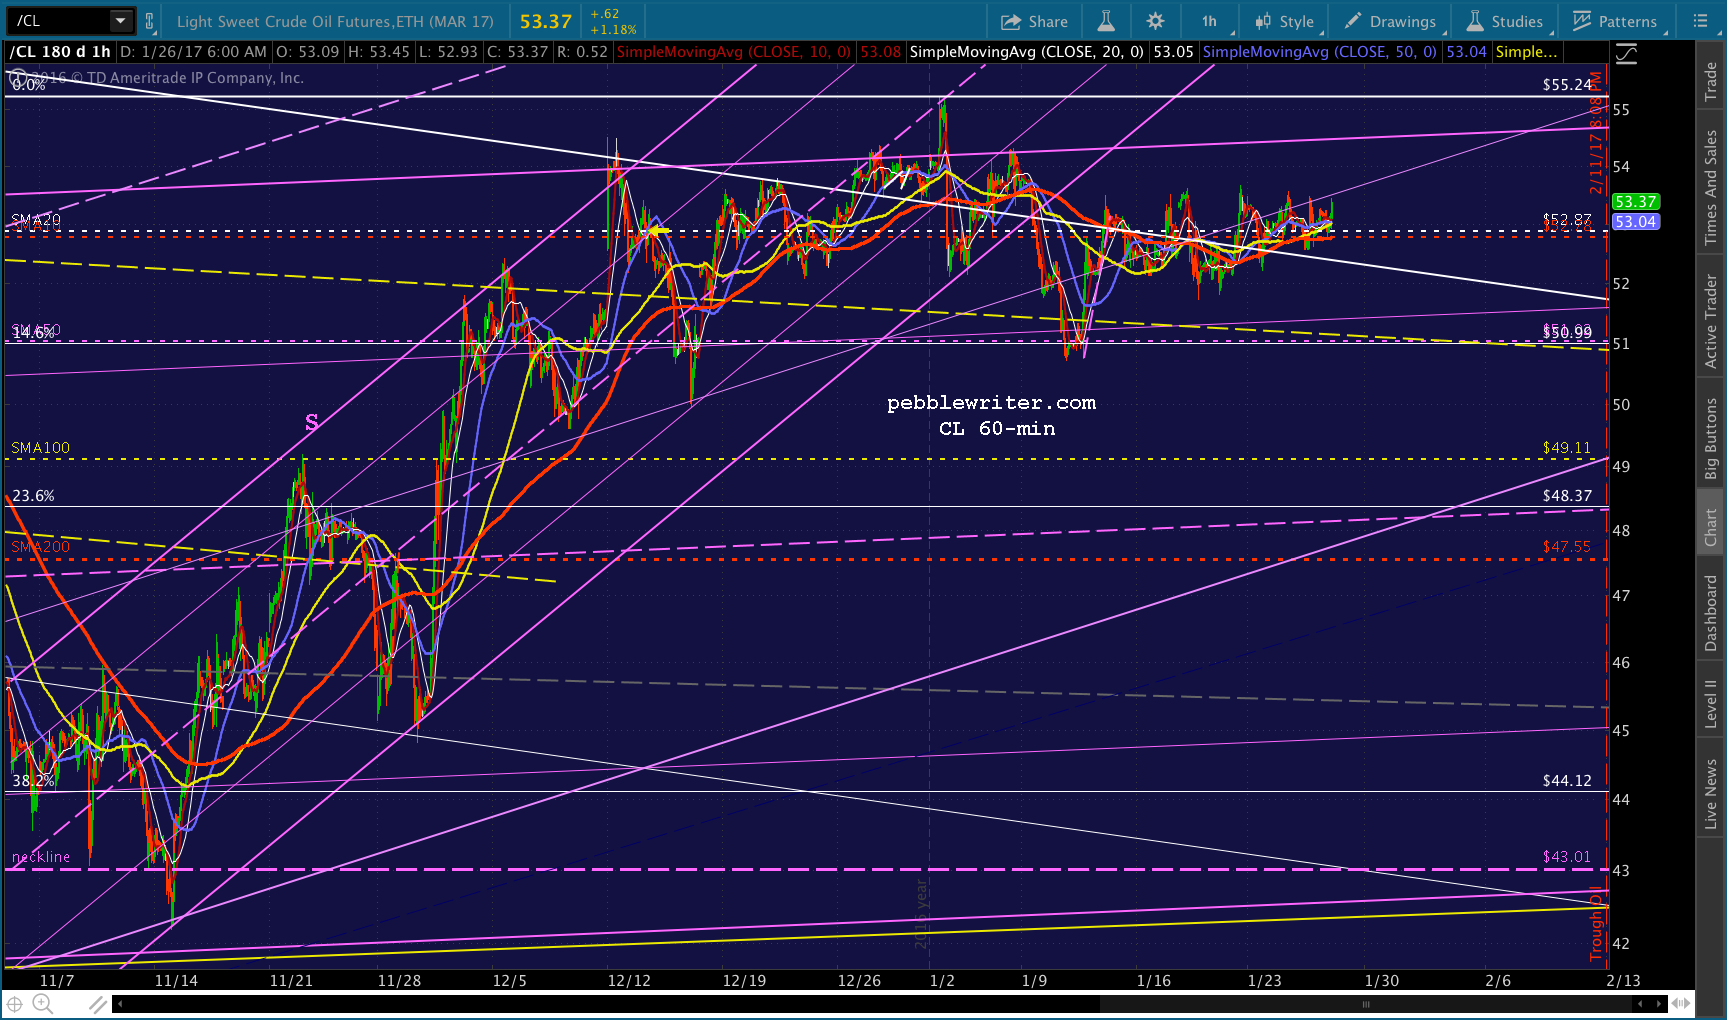
 Re the Big Picture, I’ll start by sharing my gut feeling about what’s to come, and then add whatever charts and flu-compromised reasoning I can muster.
First, the lack of any meaningful pullbacks since Nov 8 says a lot about what to expect. It is vitally important to TPTB to break out past the 1.618 at 2138, once and for all.
They almost lost it after Brexit (should have) but pushed back above by slashing VIX by 60% and following up with an 8% spike in USDJPY. When they tried to let USDJPY settle back to a reasonable range, they ran into the US election.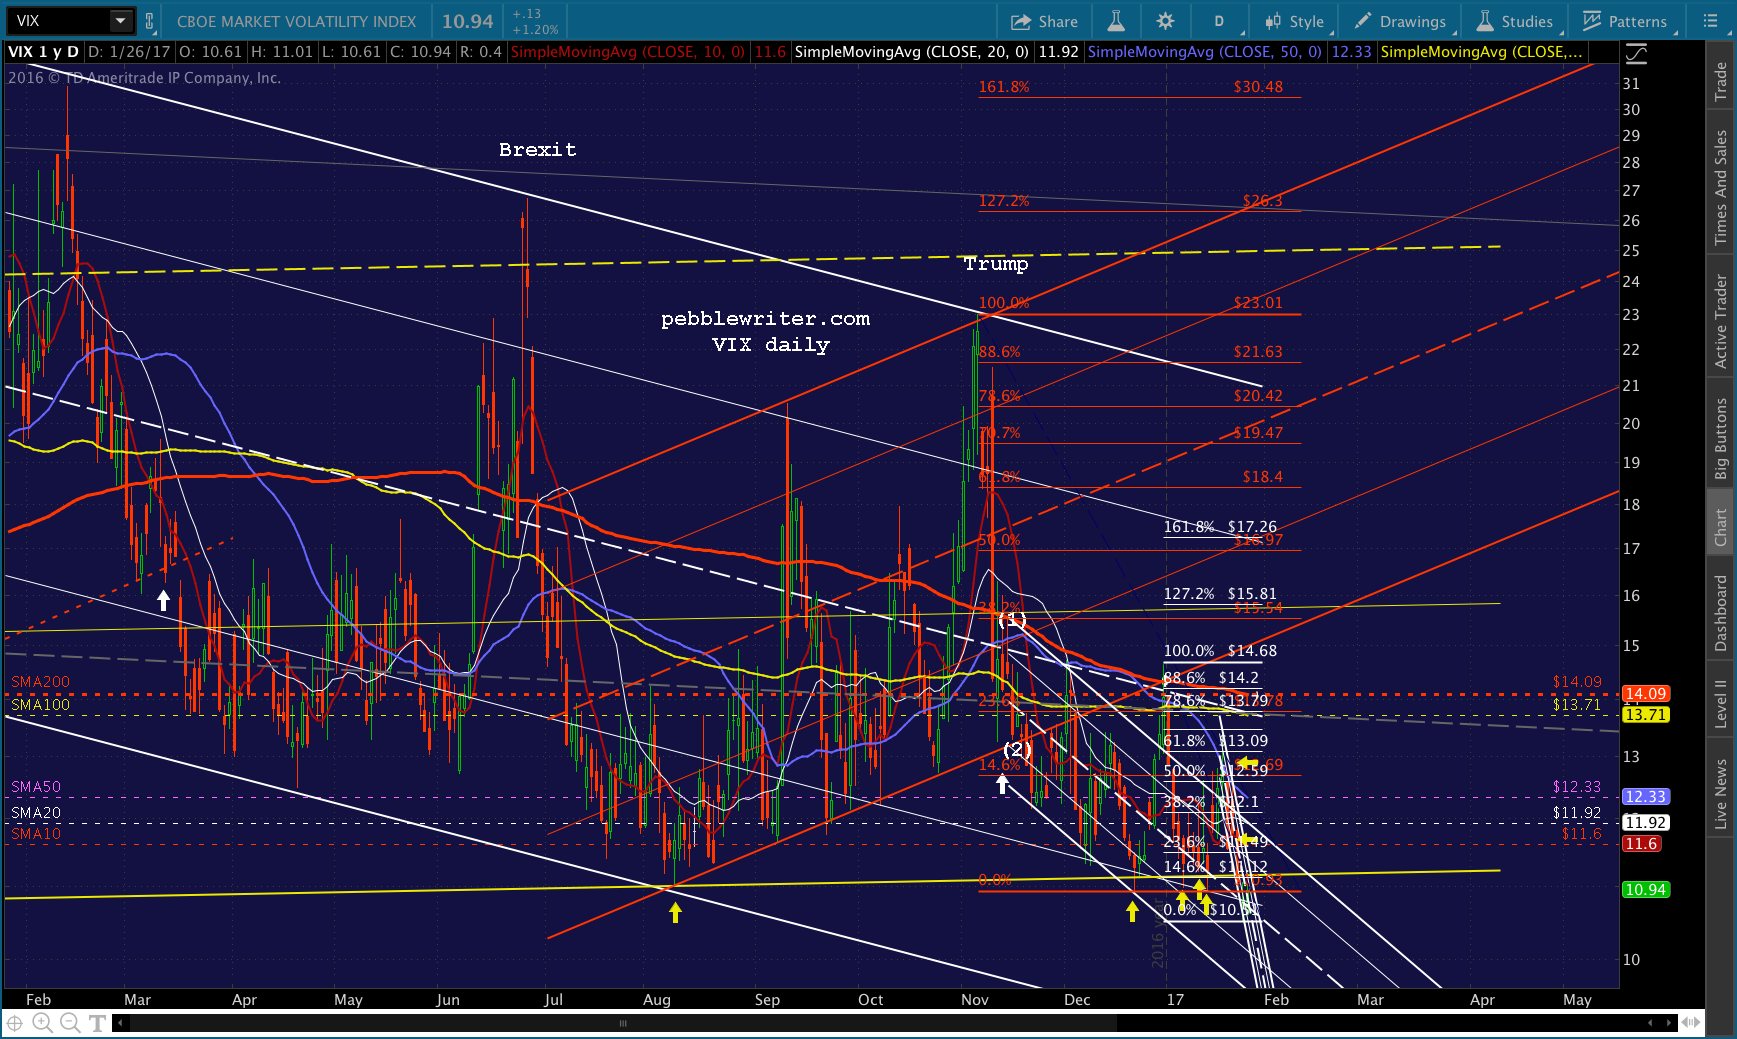 Again, a crisis was averted — this time by crushing VIX 55% and ramping USDJPY by 17%. It was enough to rally SPX by 10.4%, crushing shorts and attracting momentum players who were willing to buy into the Trump rally narrative (as long as things were going their way.)
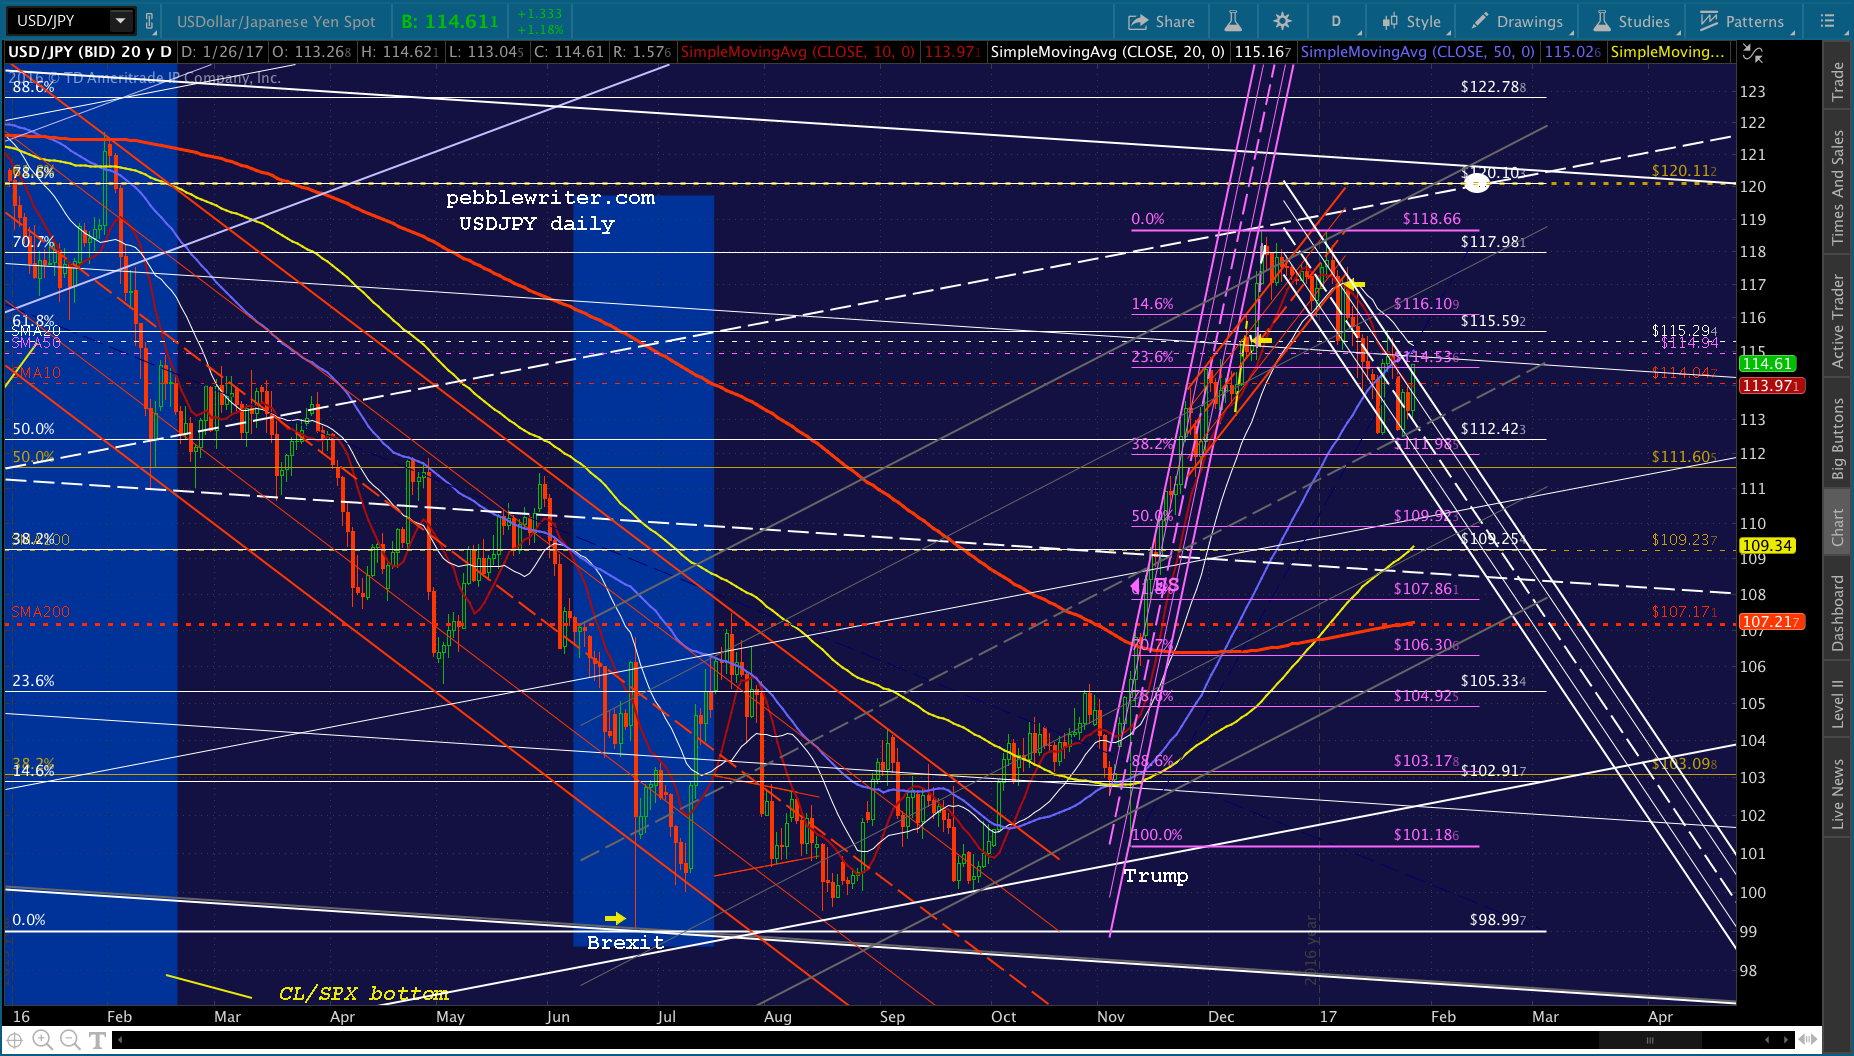 Oil, which really does need to get back into the 30s if the Fed doesn’t want big headline inflation numbers, was been cycled higher repeatedly since our Oct 11 top call, despite continually bearish inventory reports and even the Saudi’s trying to talk it back down. As I write this, it’s added 2.15% — just to try to keep SPX in the green.
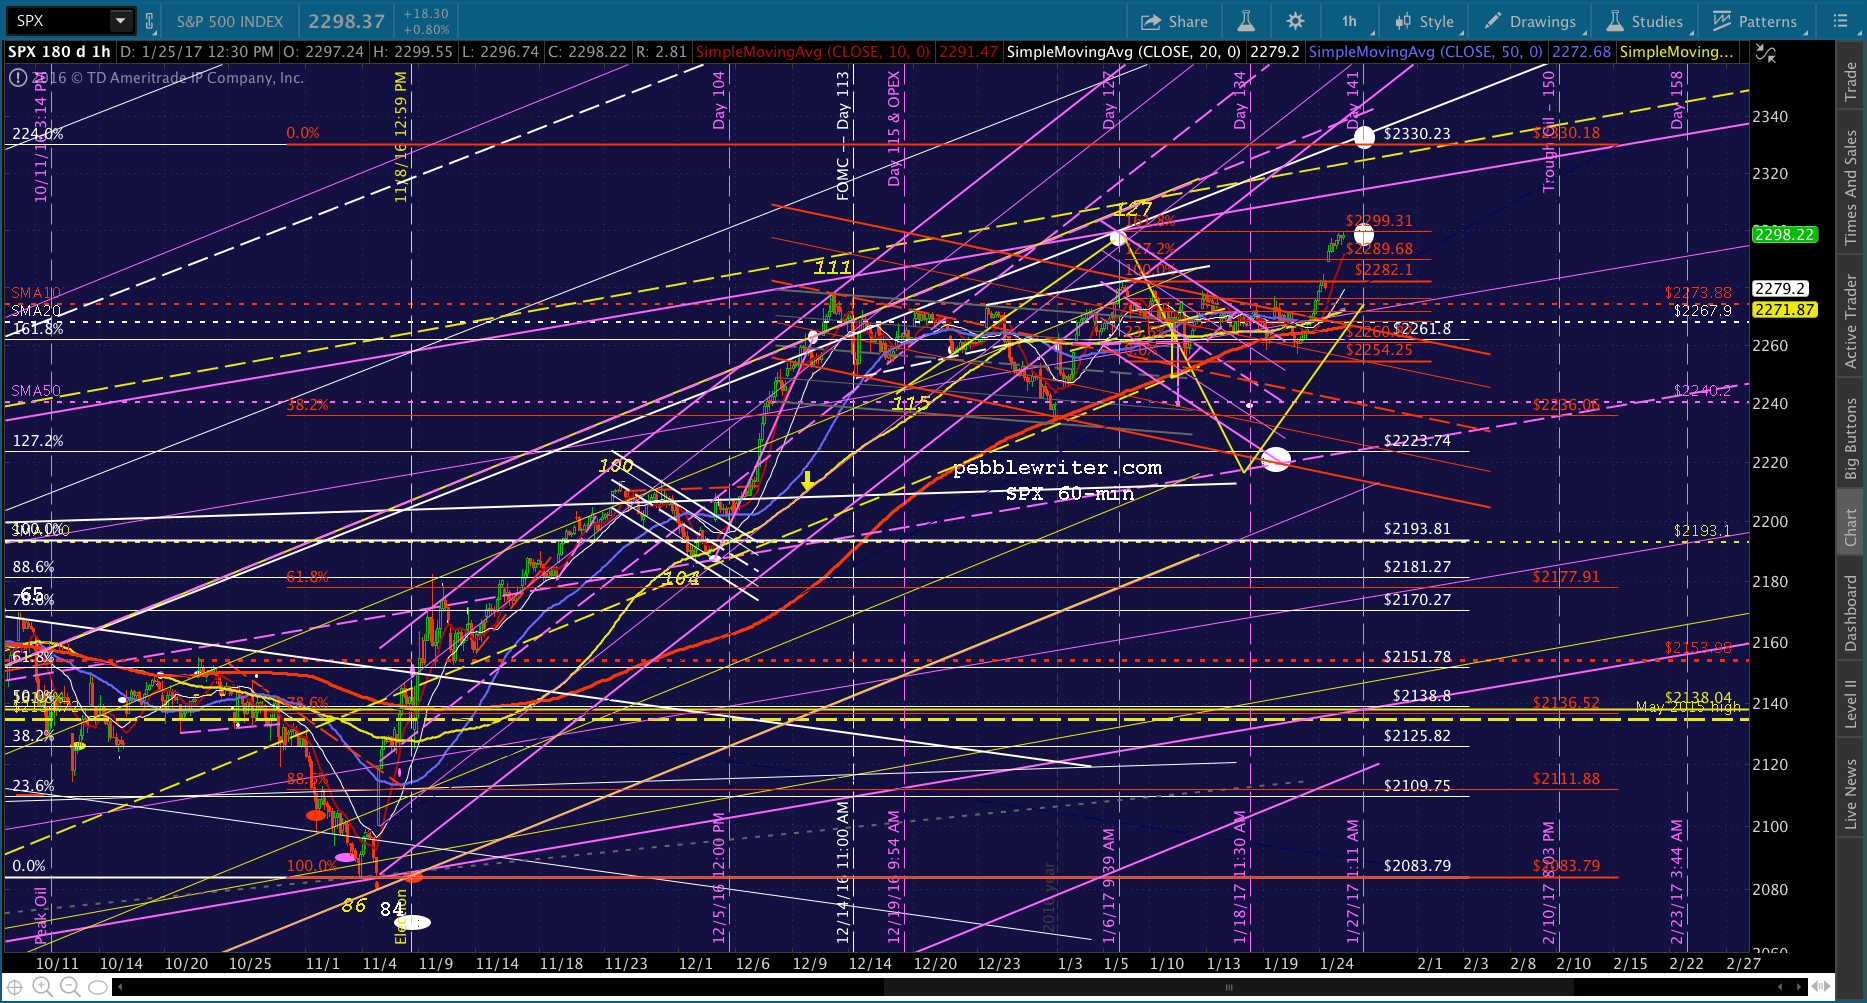
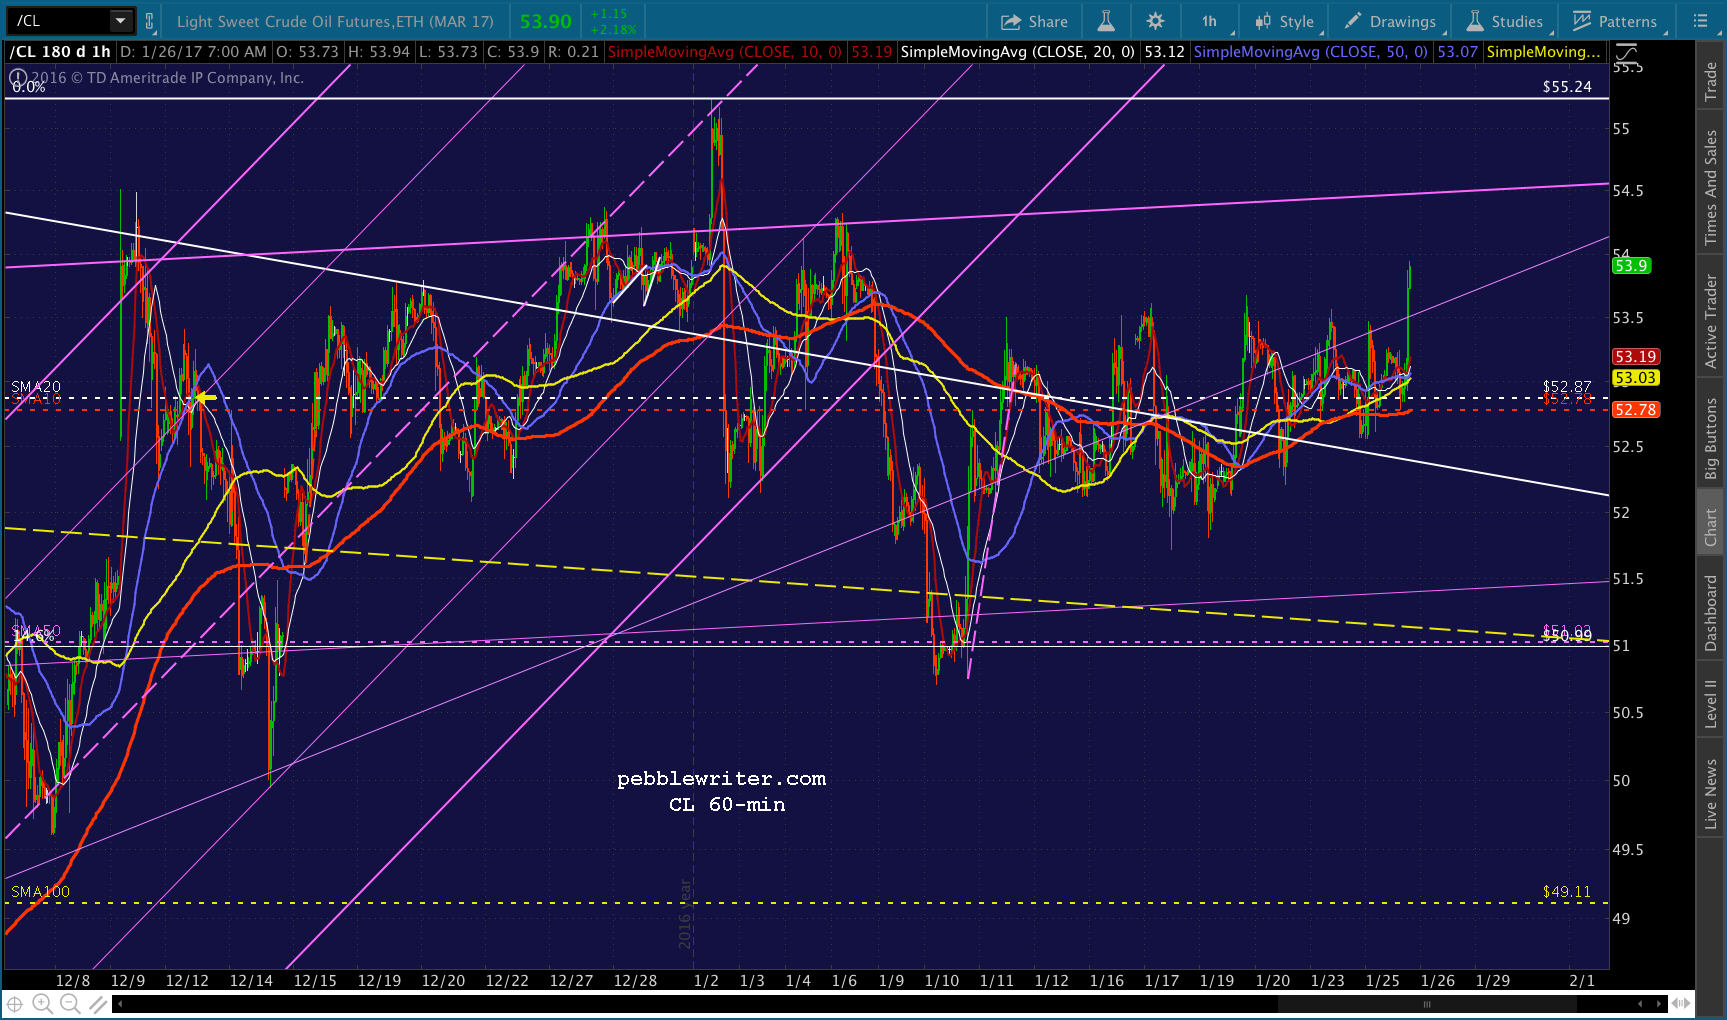 As I first wrote all those months ago, following the 2007 top was good idea to a point — that point, of course, being when SPX made a lower high on Day 141 and subsequently broke down.
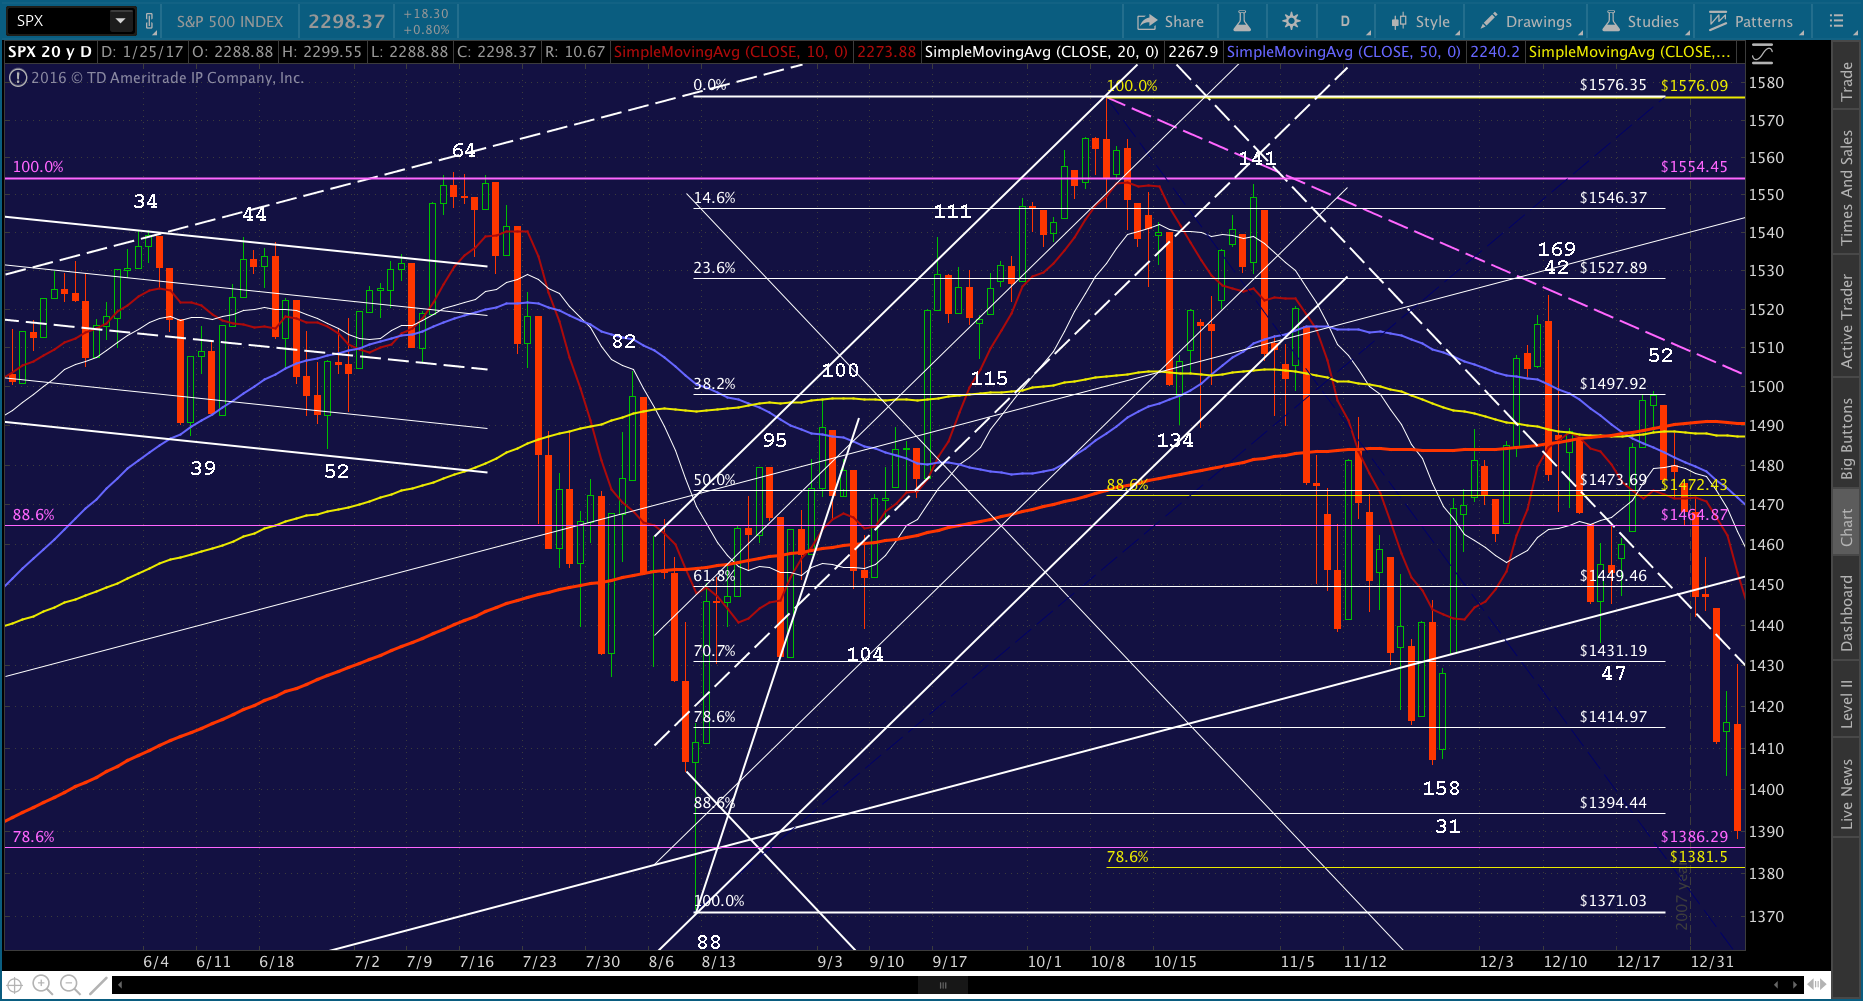 This time, Day 141 was a higher high — a good start. And, the SMA200 is now at 2155 — sufficiently above 2138 that even an overshoot could be contained. From 2300, 2138 would represent a 7% drop, and 2155 would represent a 6.3% drop.
But, to me, the 2193 area would make a better line in the sand. It was the level at which SPX topped out post-Brexit, and it was backtested after the post-election breakout. The SMA100 is there right now — about 4.7% below current prices.
A key question is whether to let the backtest happen naturally or to engineer it. If there is no backtest, the next leg(s) up will be shakier. Investors will be more nervous. And, it might limit stocks’ ability to make strong gains.
On the other hand, a backtest that comes too soon or drops further than anticipated runs the risk of undoing too much of the rally or, even worse, ending it.
I just had a nice, long conversation with a guy at the BLS, which collects the data used in calculating CPI, PPI, PCE, etc. Apparently, oil/gas expenditures are collected throughout the month rather than a snapshot on any given date. It’s not necessarily a monthly average, but it’s usually pretty close.
Accordingly, the PCE figures released on Jan 31 and CPI/PPI figures released on Feb 14-15 will reflect the data collected during the month in January. This means we’re likely to get a bump up in the headline inflation number that could force the FOMC’s hand when it announces its latest policy on Feb 1. It’s too late to reduce gas prices enough to matter for this Fed meeting.
Since gas expenses are about 4.2% of the CPI, the 30% increase in gasoline costs since last year could produce a sizable bump in the official CPI number… say 1.26% yoy all by itself. No wonder gas prices have been suppressed relative to crude.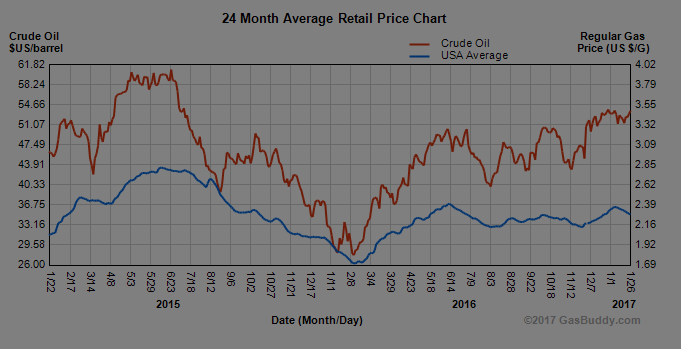
At 2.1% yoy, inflation was already a problem for the FOMC. It will be considerably worse with the next report which includes January prices. And, unless gas prices absolutely crash in February, it will be much, much worse.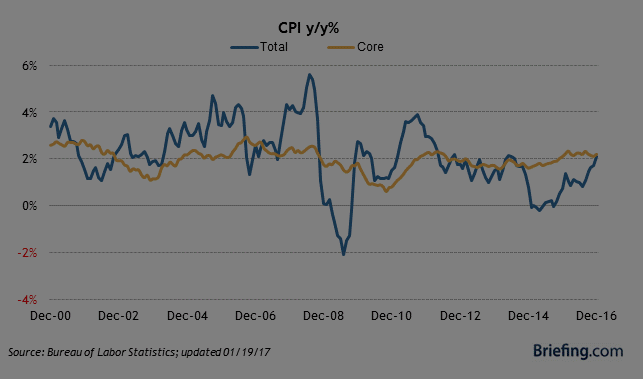 Rent is the other bugaboo, but I don’t see that there’s much TPTB can do about it other than continue to misreport the actual impact as they already do by using owner’s equivalent rent rather than actual rent expenses.
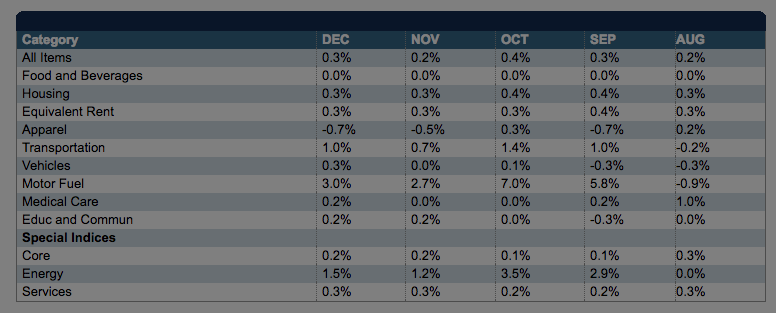 Like other central banks, the Fed has been incredibly fortunate to have extremely low interest rates for the past 8-9 years. ZIPR is the one ingredient that overinflated markets can’t do without.
From a fundamental standpoint, it inflates the present value of future cash flows (supposedly how investment assets are valued), enables more positive financial leverage, and pushes investors into bond/fixed income alternatives.
In general, higher interest rates are not good for markets. The strong exception is when higher rates come about as a result of higher inflation. In that case, we can still get high or at least positive nominal returns even though the real rates of return are impacted.
I believe this is probably the most likely scenario going forward.
UPDATE: 3:45 PM
Quick check on the markets with 15 minutes to go… VIX has done a good job of keeping SPX close to even on the day. There’s a path to 2284.63. With the SMA10 probably registering around 2276-77 tomorrow, I’d still consider it a good possibility. But, it’s not likely to happen today.
As always, only hold short overnight if you can hedge or stomach the possibility of a gap higher, up through resistance at 2299.31.