

Yesterday, I laid out the primary drivers of the rally that’s gripped stocks since election night: USDJPY, VIX and CL. As luck would have it, we were immediately rewarded with an affirmation of those dynamics: SPX rallied another 15 points on a 1% USDJPY gain, a 1.7% CL gain, and VIX being smashed by 4.25% — all intraday, of course.
The “magic” continued overnight, with VIX breaking down another 2.5% to lows not seen since July 2014. It’s enough to send futures up another 11 points. 
Is it sustainable? Today, we’ll focus on the big picture and the continuing effectiveness of our analog.
continued for members…
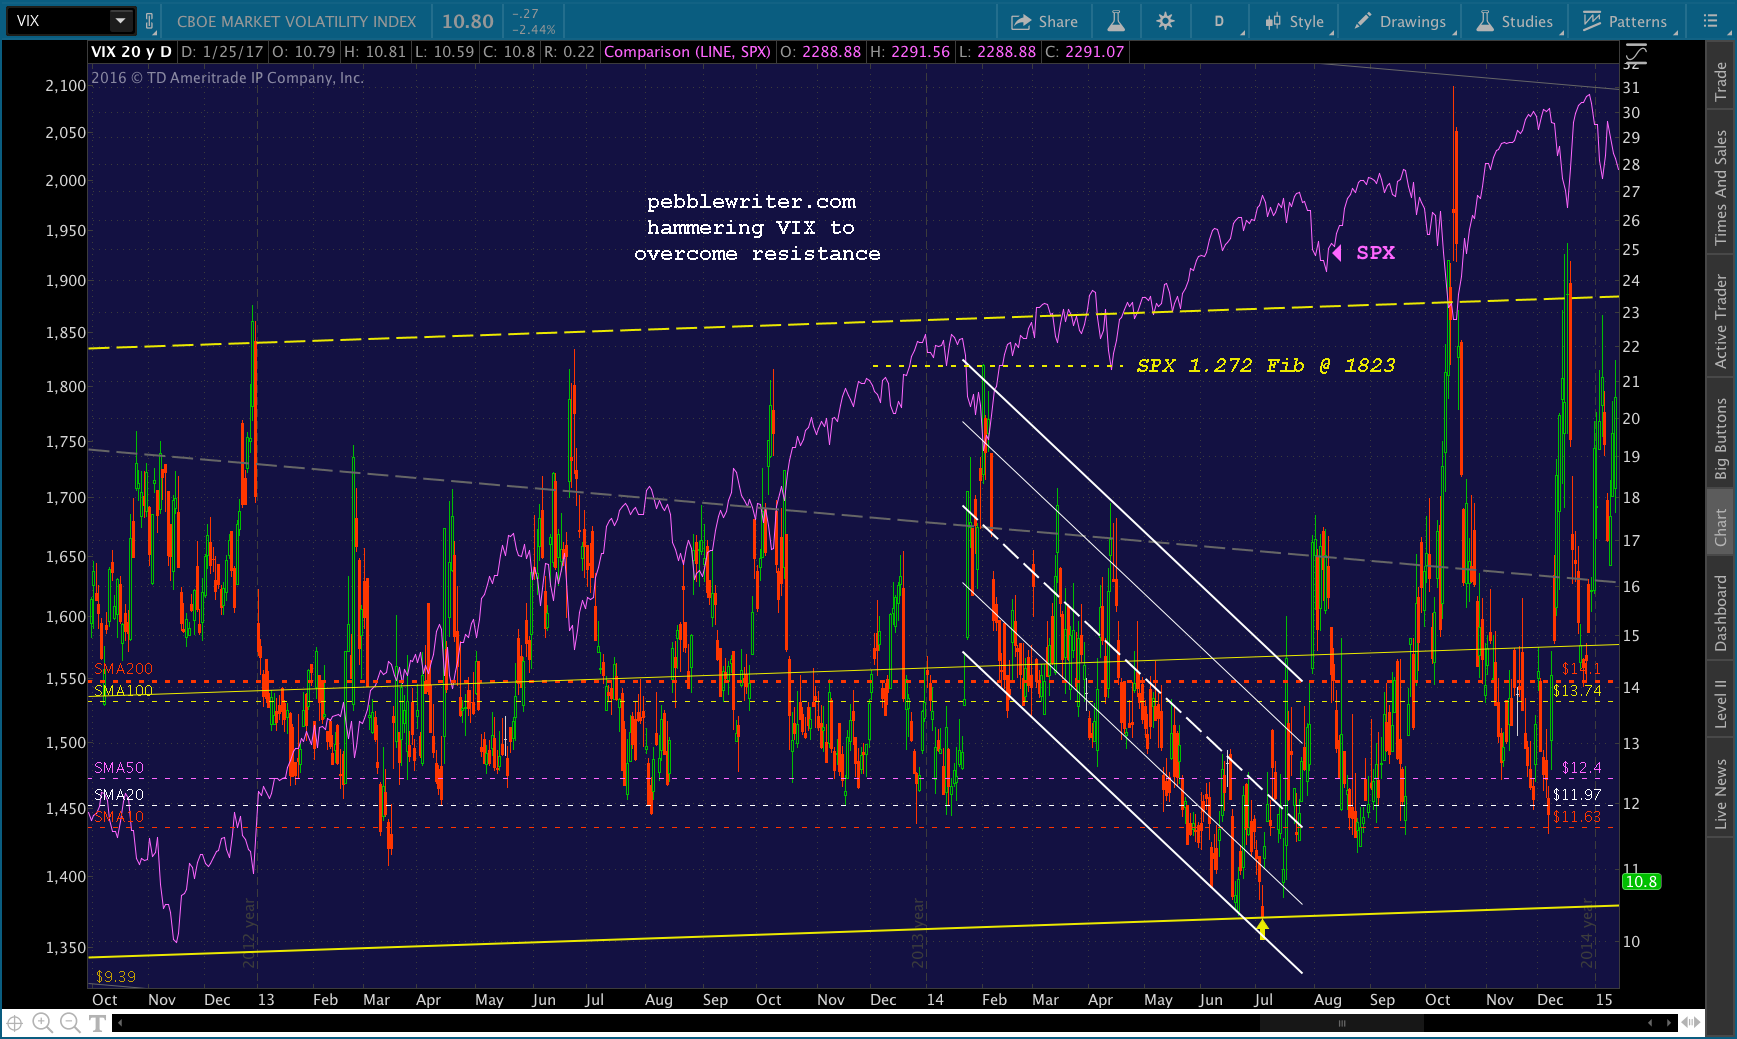
VIX’s actions will officially bust the downward facing red harmonic grid — which will make a significant dip to test the channel lines the analog suggested much less likely.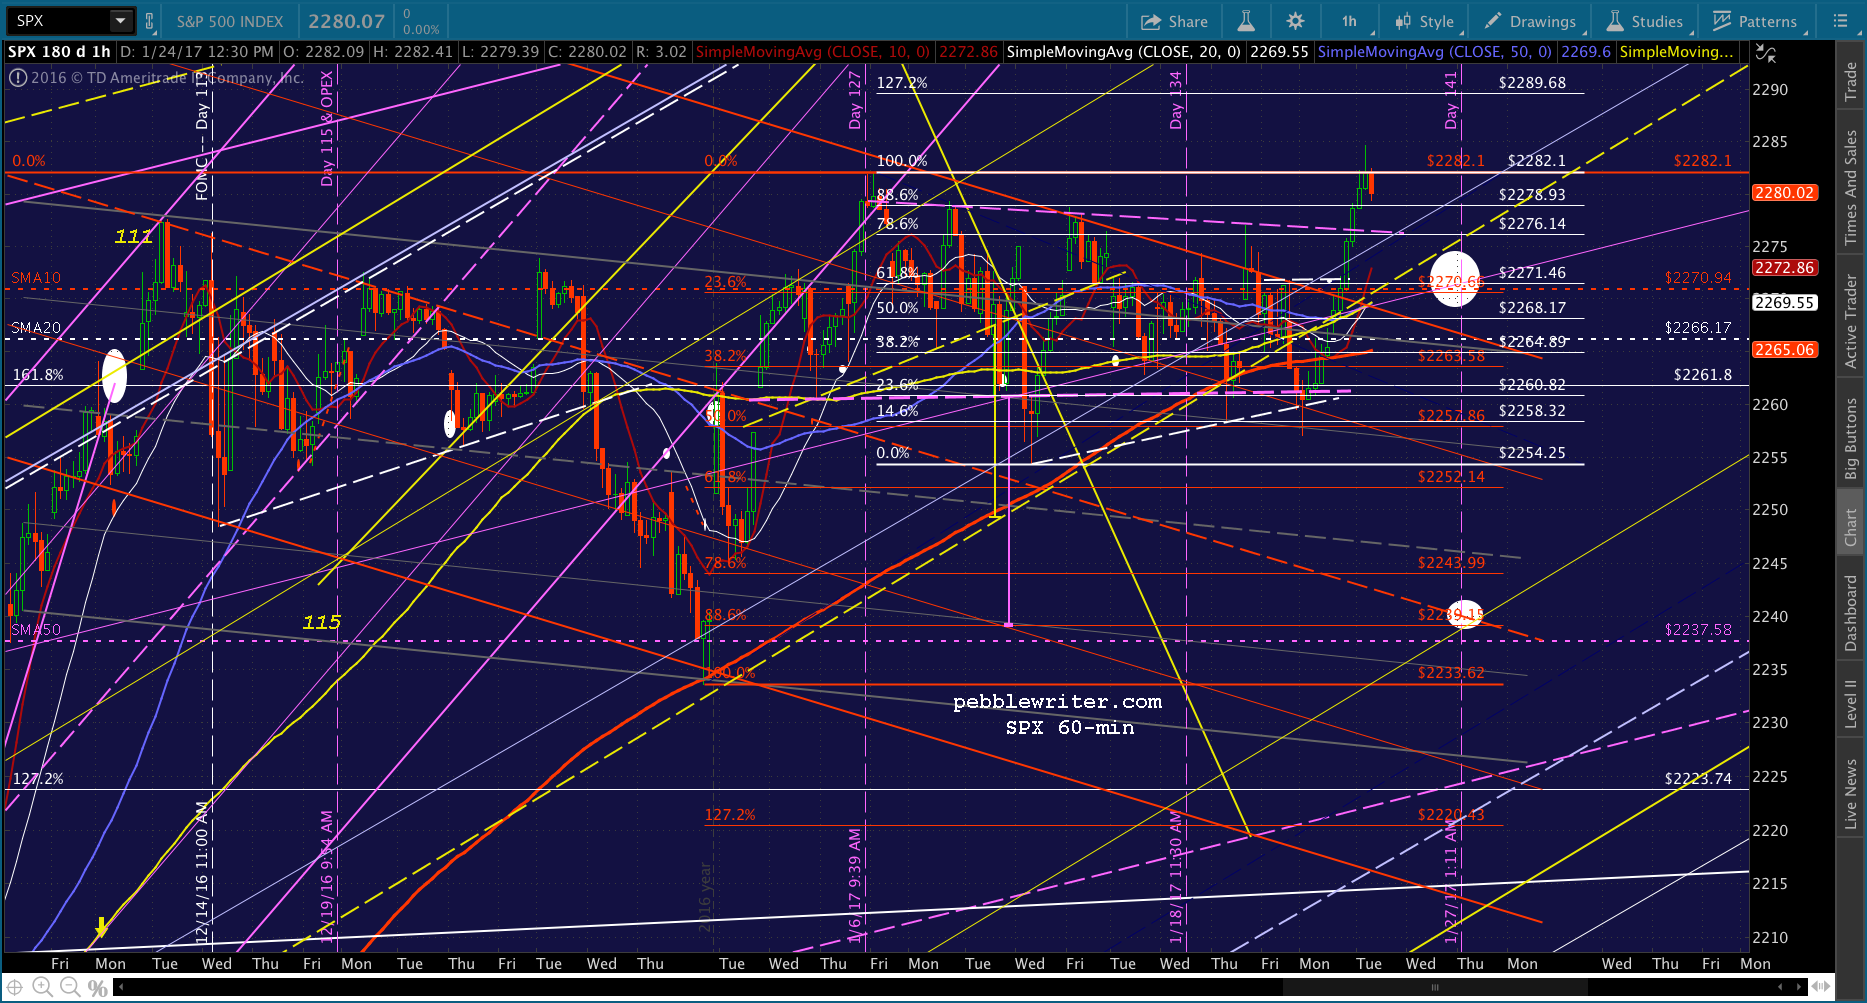 I want to focus a bit more on VIX. As we discussed yesterday, it’s the only unfettered algo driver at the moment. A cheaper yen or more expensive CL have repercussions that central bankers would rather avoid.
At 10.59, VIX hasn’t been lower since Jul 3 2014 when it reached 10.28 in the culmination of a similar move to get SPX up past critical resistance — the 1.272 extension (@ 1823) of the 2007-2009 crash. SPX should have reversed at 1823 at year-end 2013, but didn’t — partly because VIX was smashed from 16.75 to 11.69 (30%) over the low-volume Christmas holidays.
There are two such important price levels in 2017: SPX’s 1.618 extension 2138, which was broken through on Jul 12 2016, and DOW 20,000.
As in 2014, the 1.618 required several defenses.
CL and USDJPY both played important roles, with well-timed pops in times in trouble. This was most evident in October and November when SPX broke down below 2138 leading up to the election. 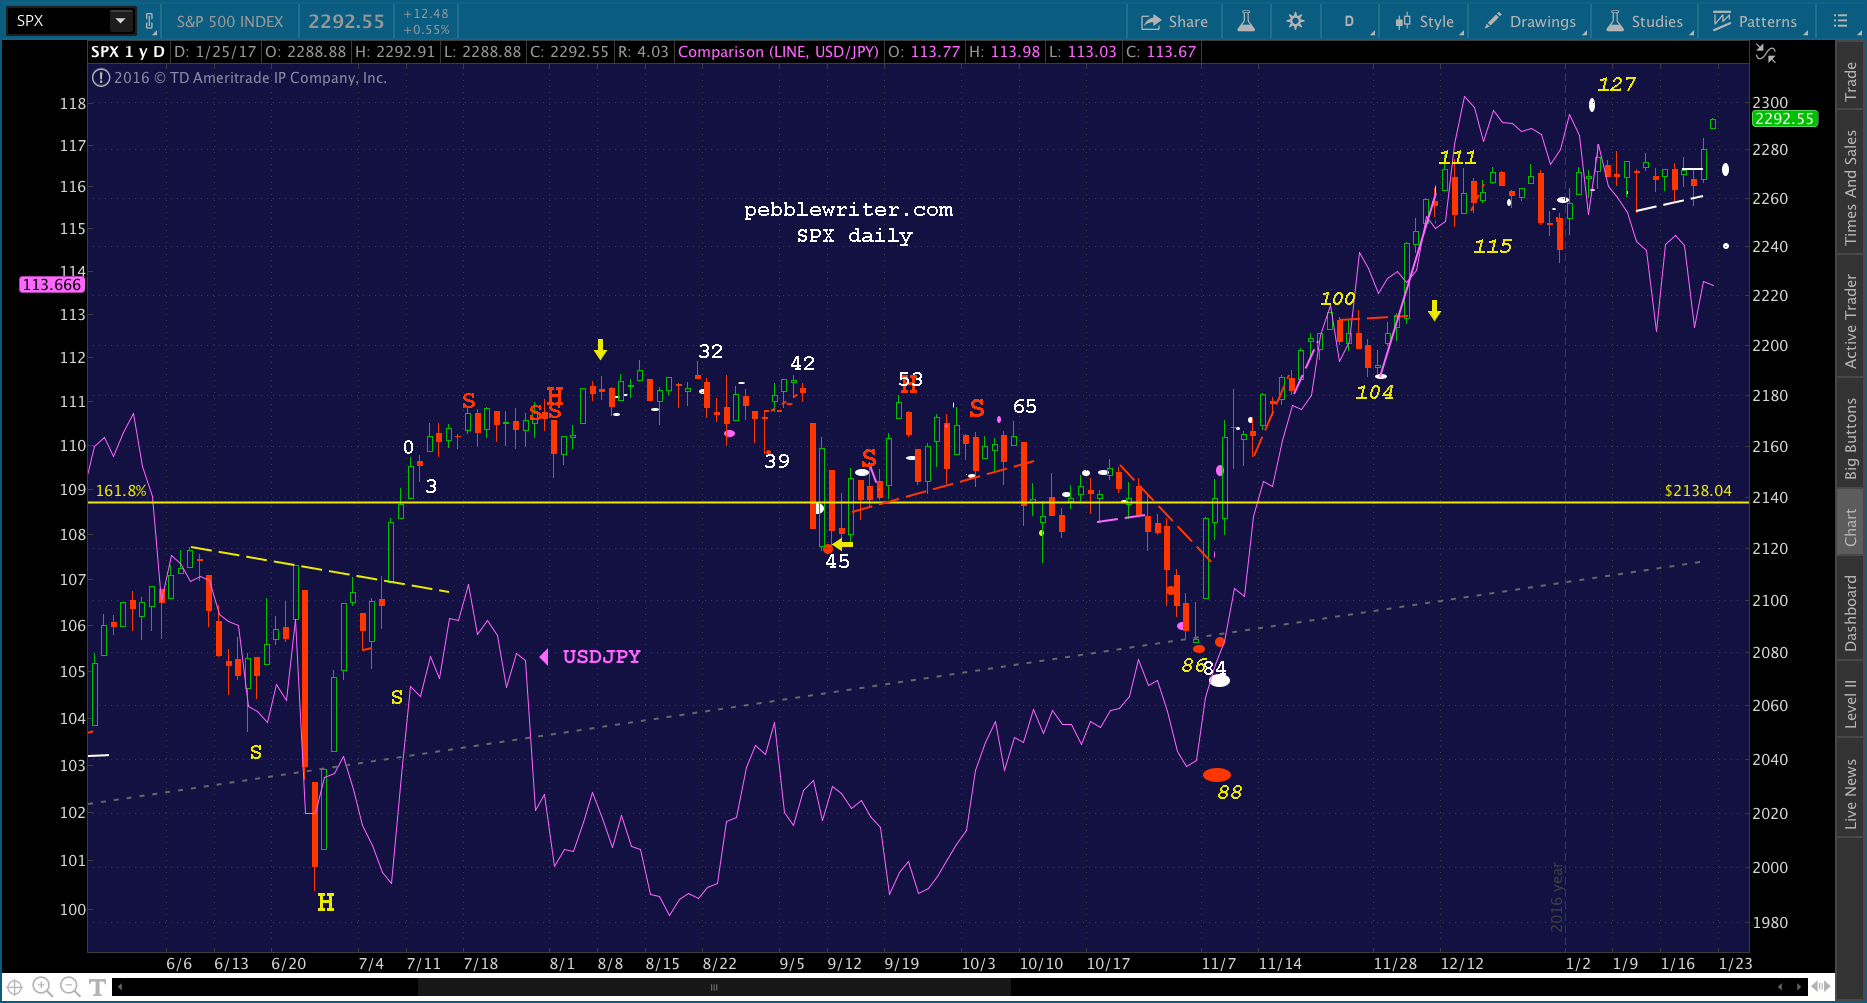
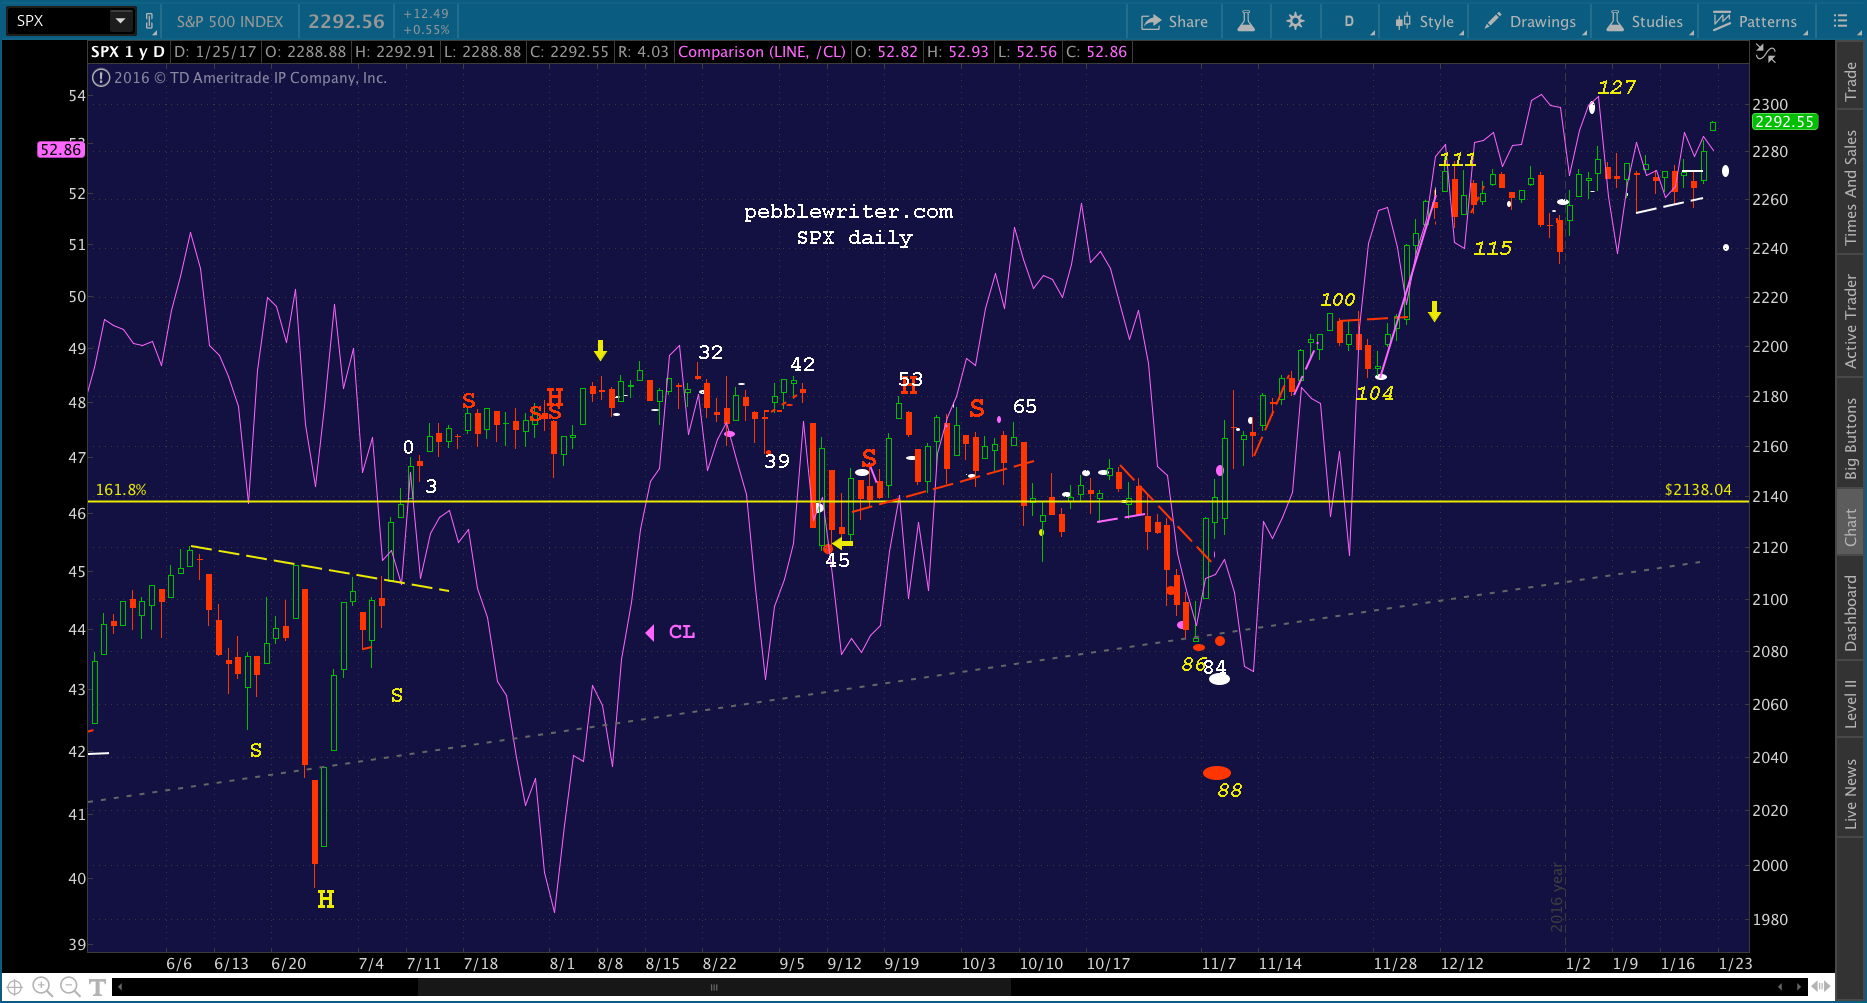 But, as we discussed yesterday, it was VIX’s heroic plunge that really brought SPX back to life.
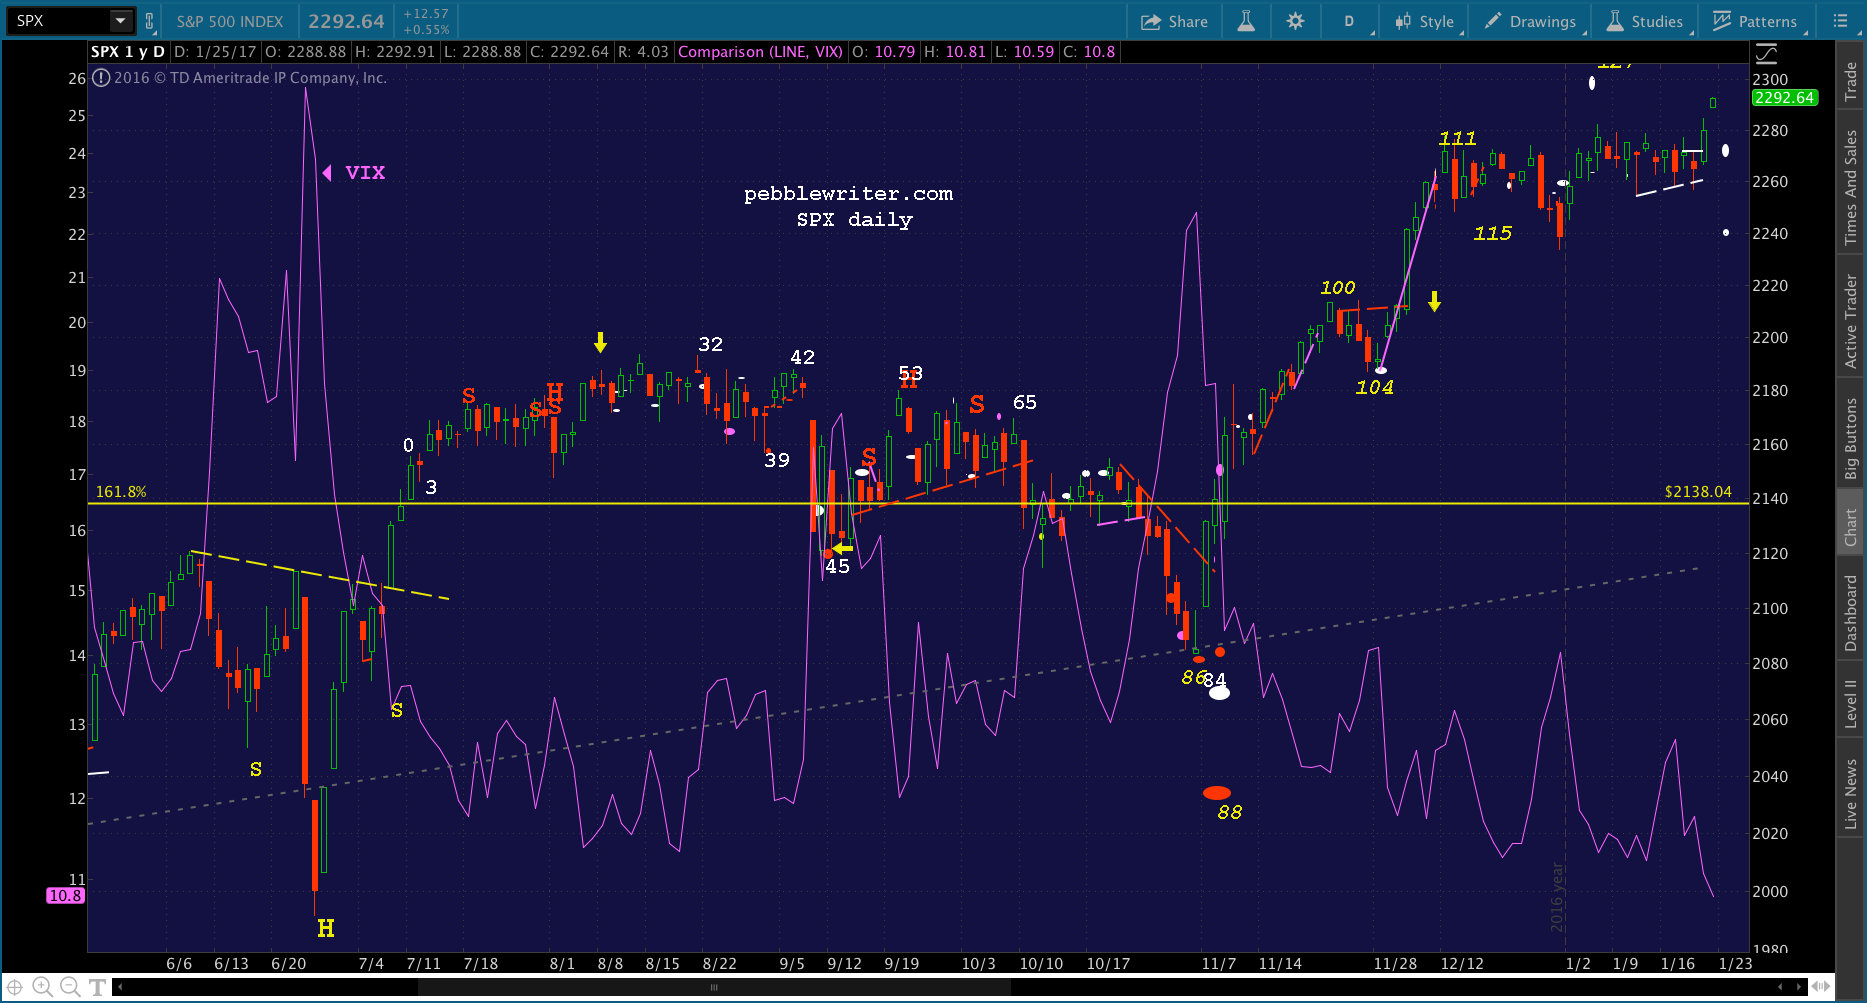 A look at the bigger picture reveals that this sort of effort had been going on for a while. Had the Brexit or election night sell-offs been allowed to build momentum, SPX might have tested 1823 again — or worse.
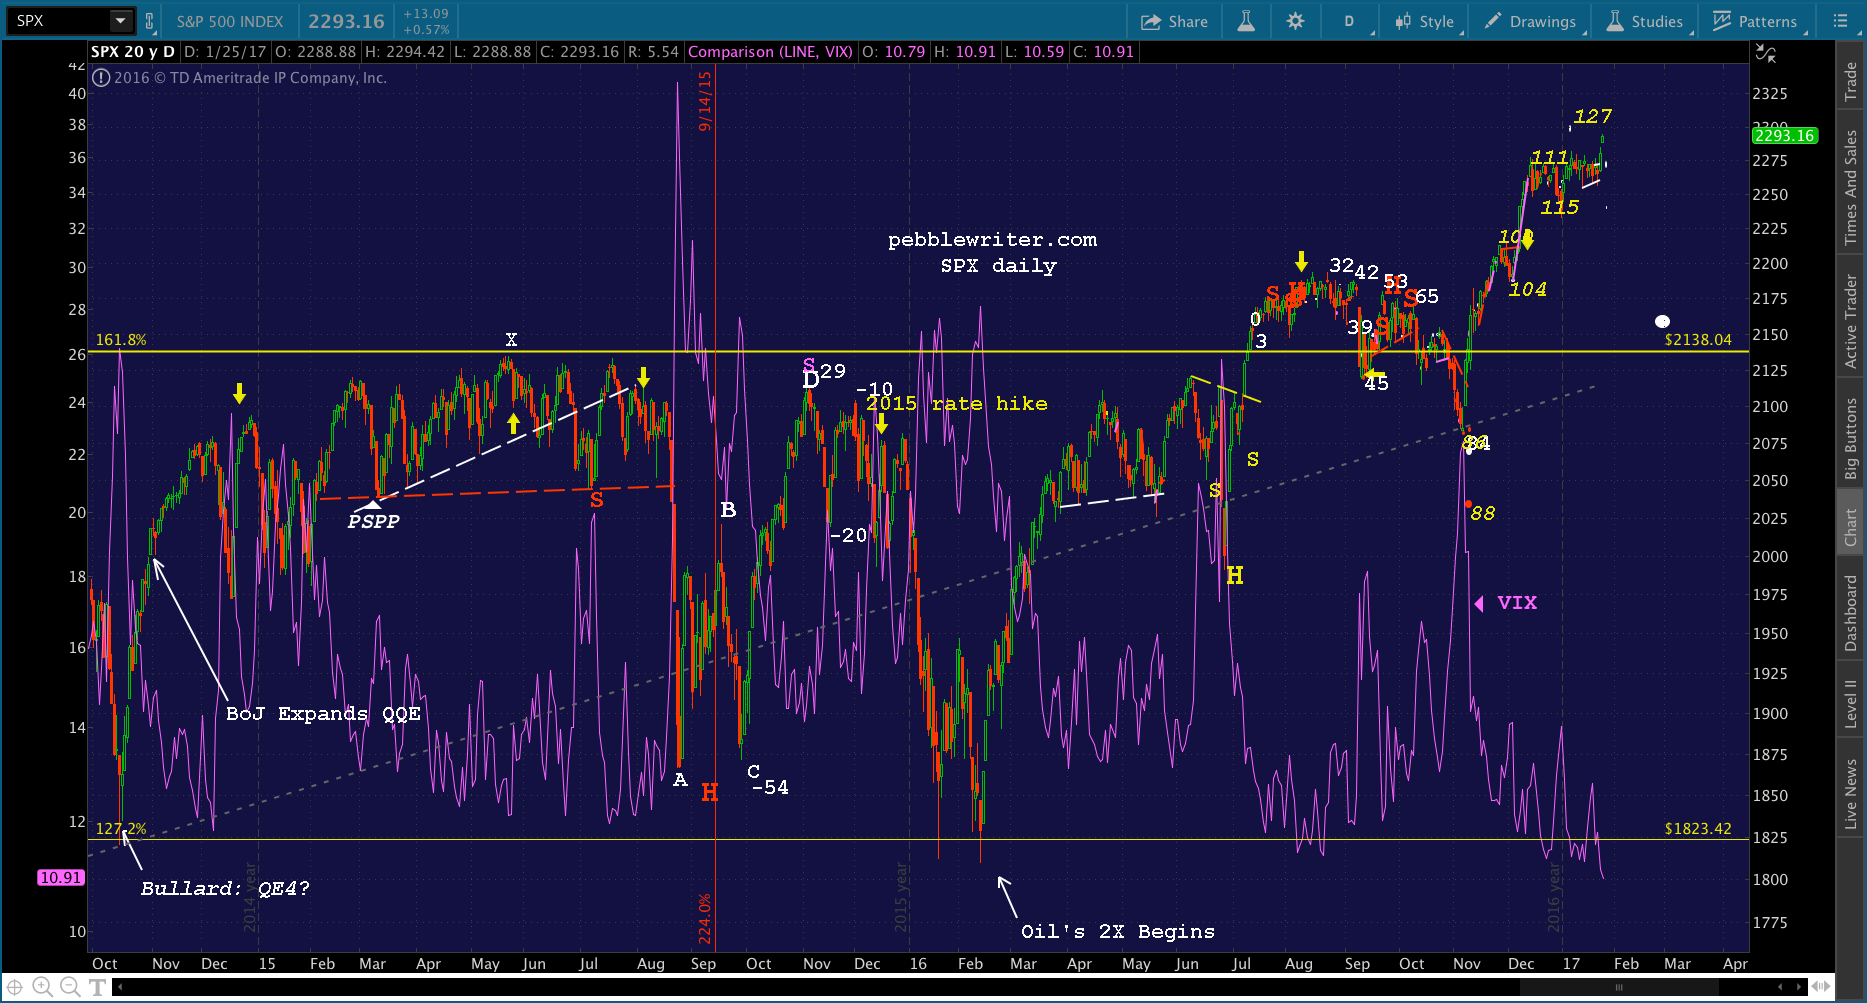 Butterfly Pattern reversals at the 1.618 extension often result in drops to at least the previous high (the 1.000 at 1576) or even the .618 or .786 (1228 or 1381)!
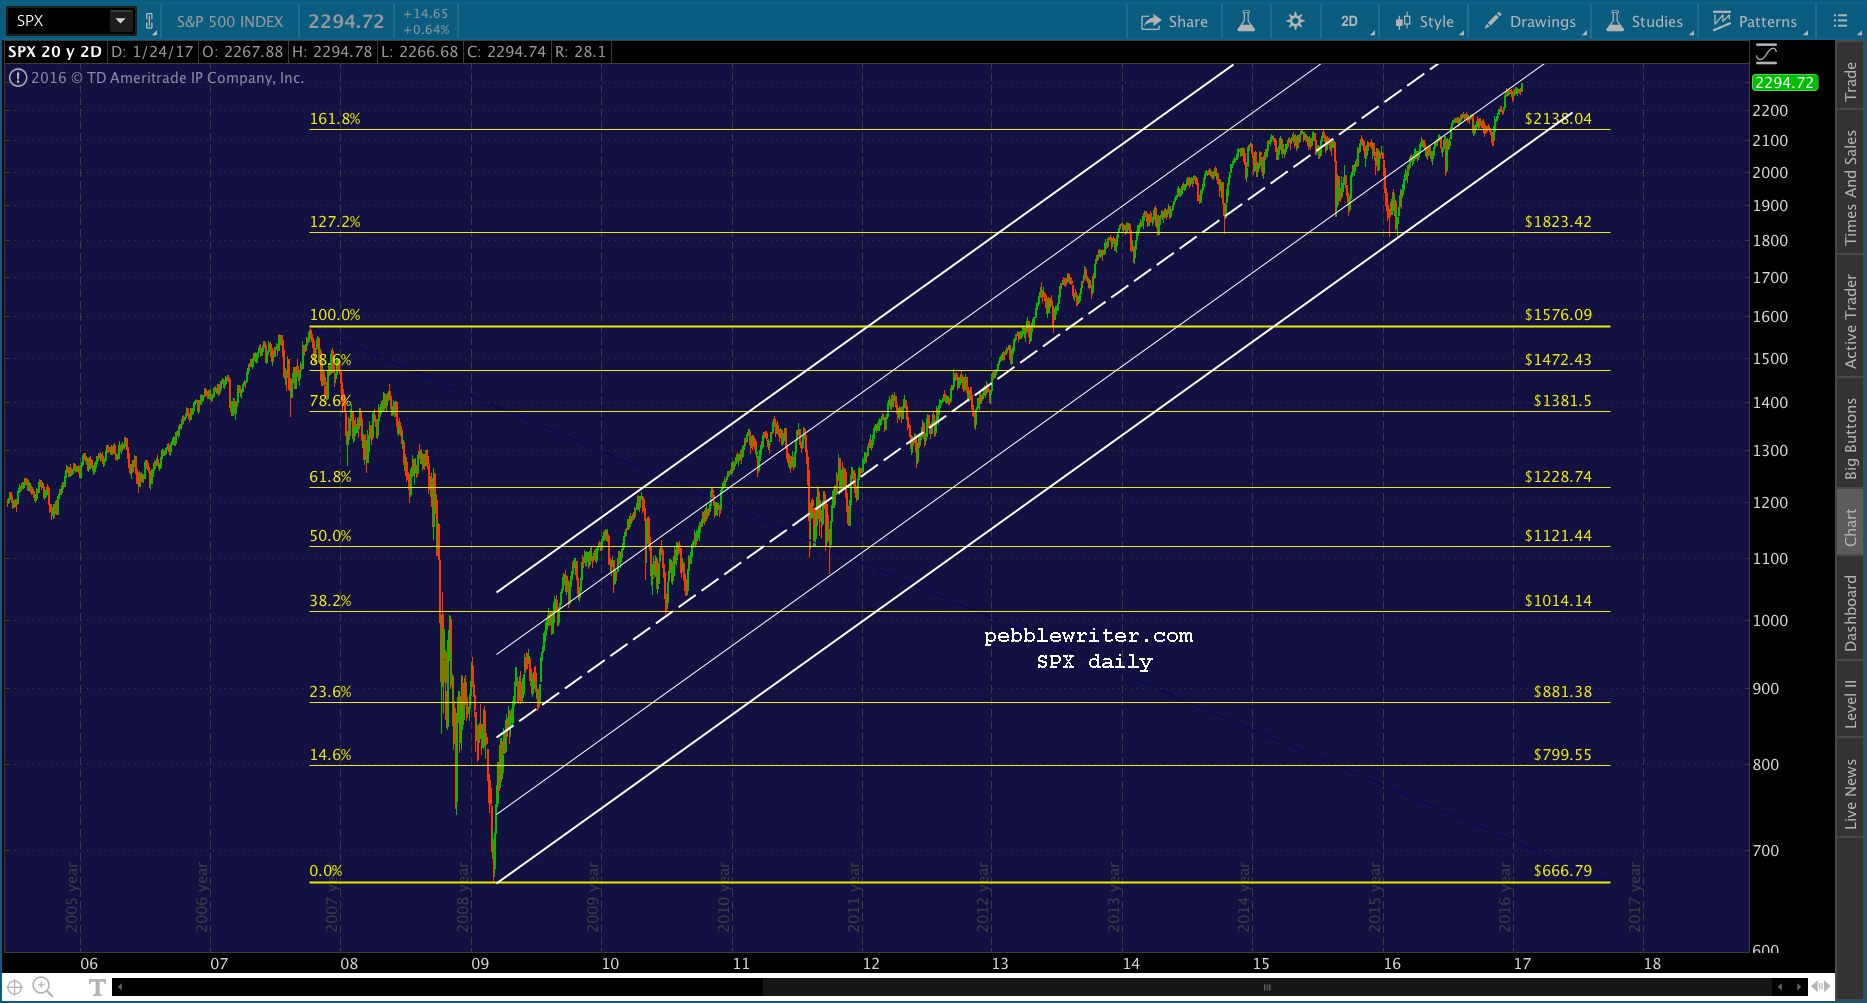
The big harmonic picture and primary SPX channel confirm that SPX is currently past major resistance. The log chart has SPX stuck in the bottom 1/4 of the rising white channel…
 …while, the arithmetic chart has it breaking out past its midline.
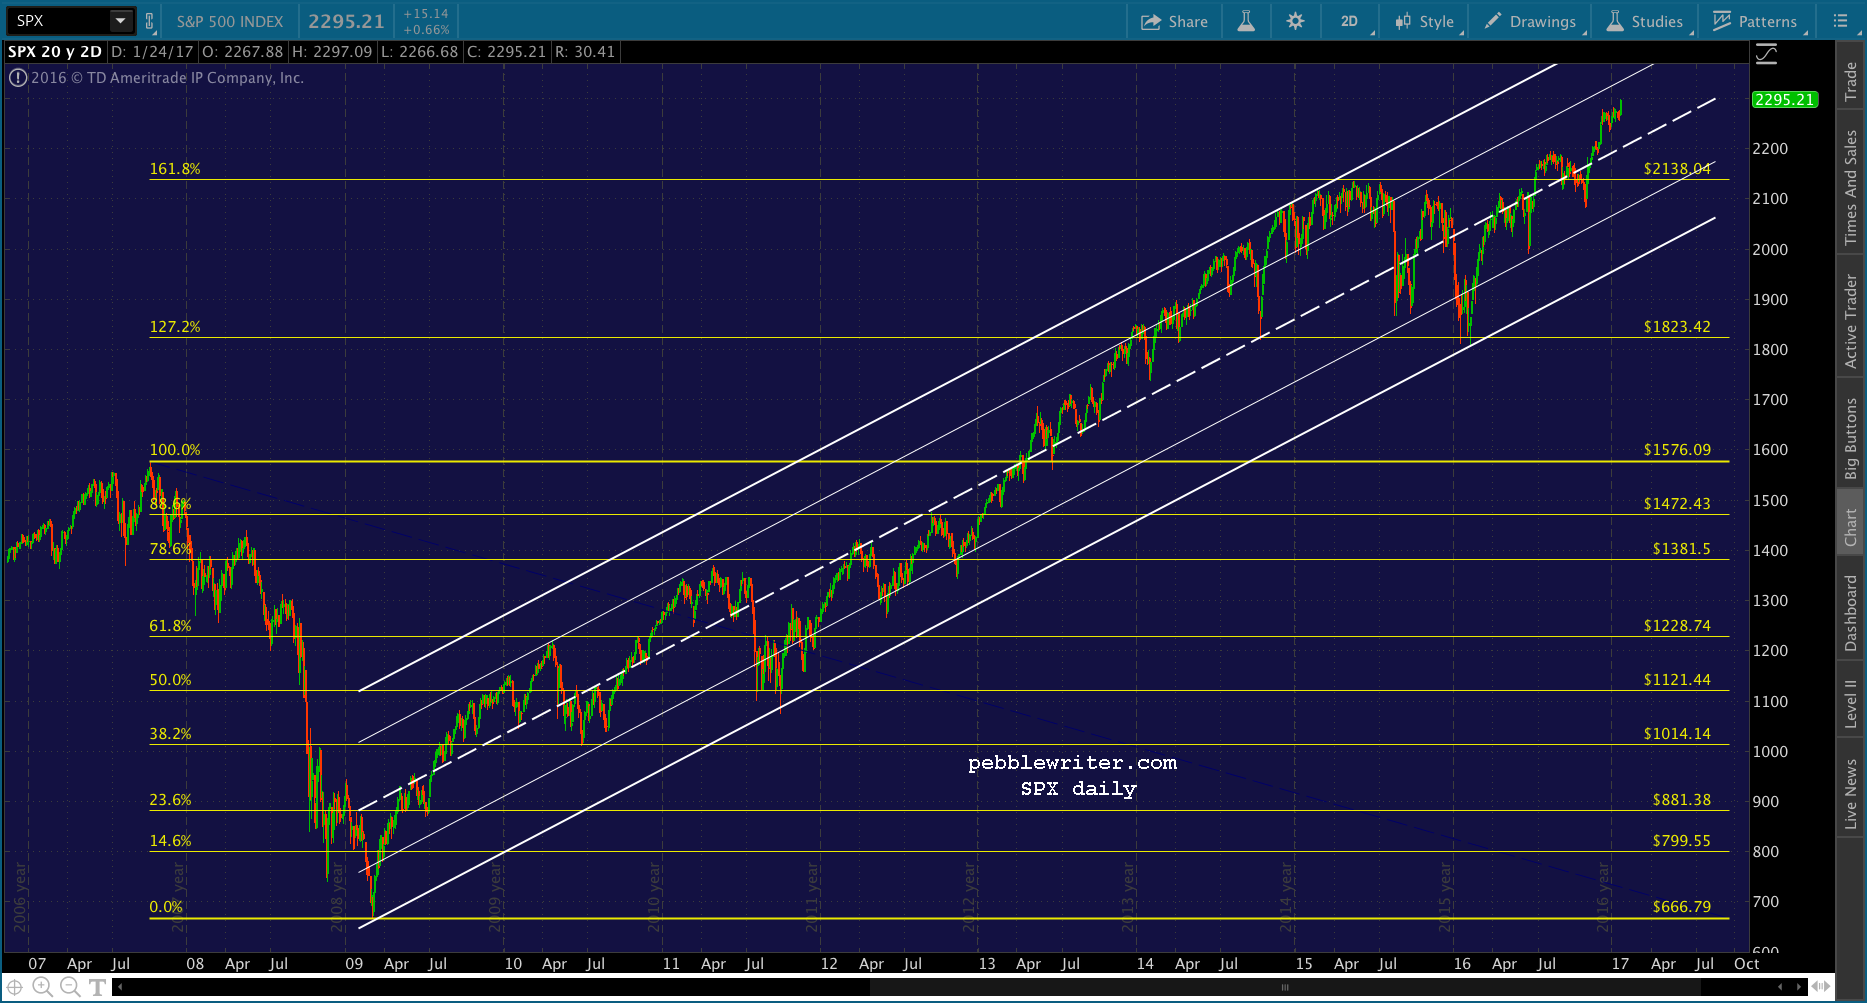 The next major Fib resistance isn’t until the 2.24 extension at 2703.62, another 17.9% north of here. So, the task is to figure out what happens between here and there.
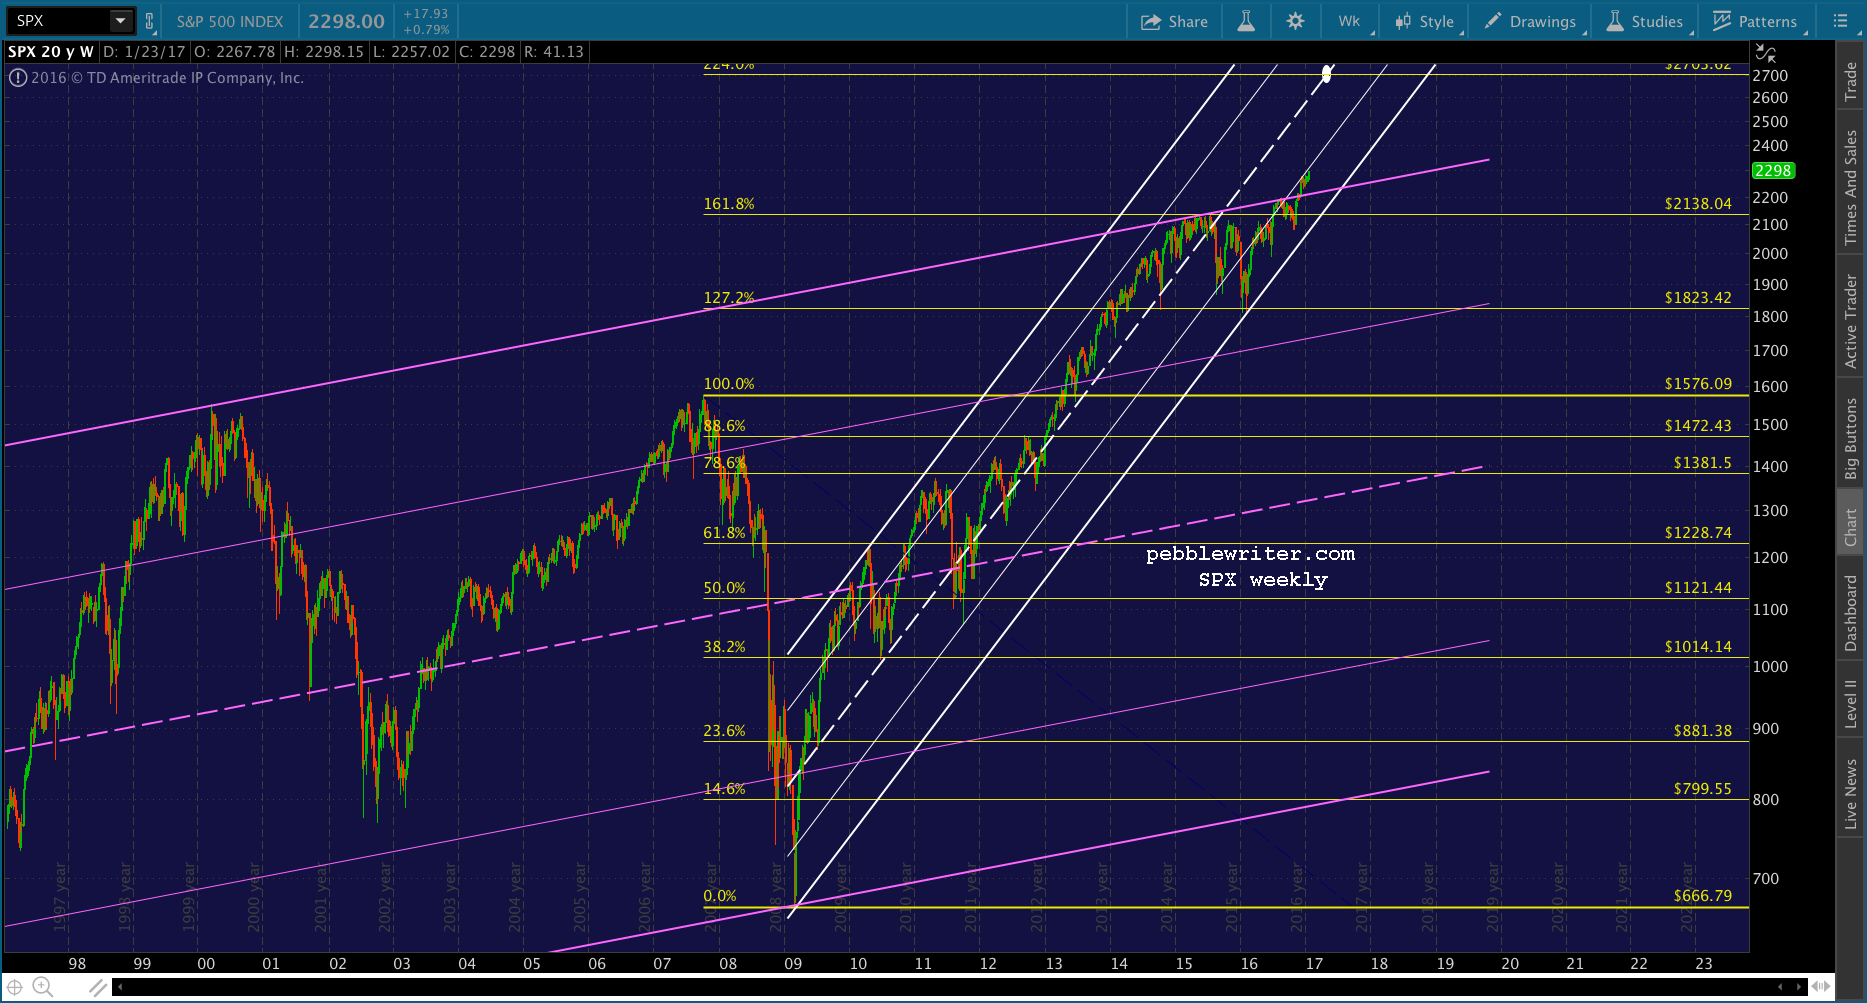
If we go by the arithmetic chart, the rising white channel doesn’t intersect 2703 until Sep 2018 or so. 18% over the next 20 months isn’t too bad, provided it can make it. The rising yellow channel seems to confirm the target.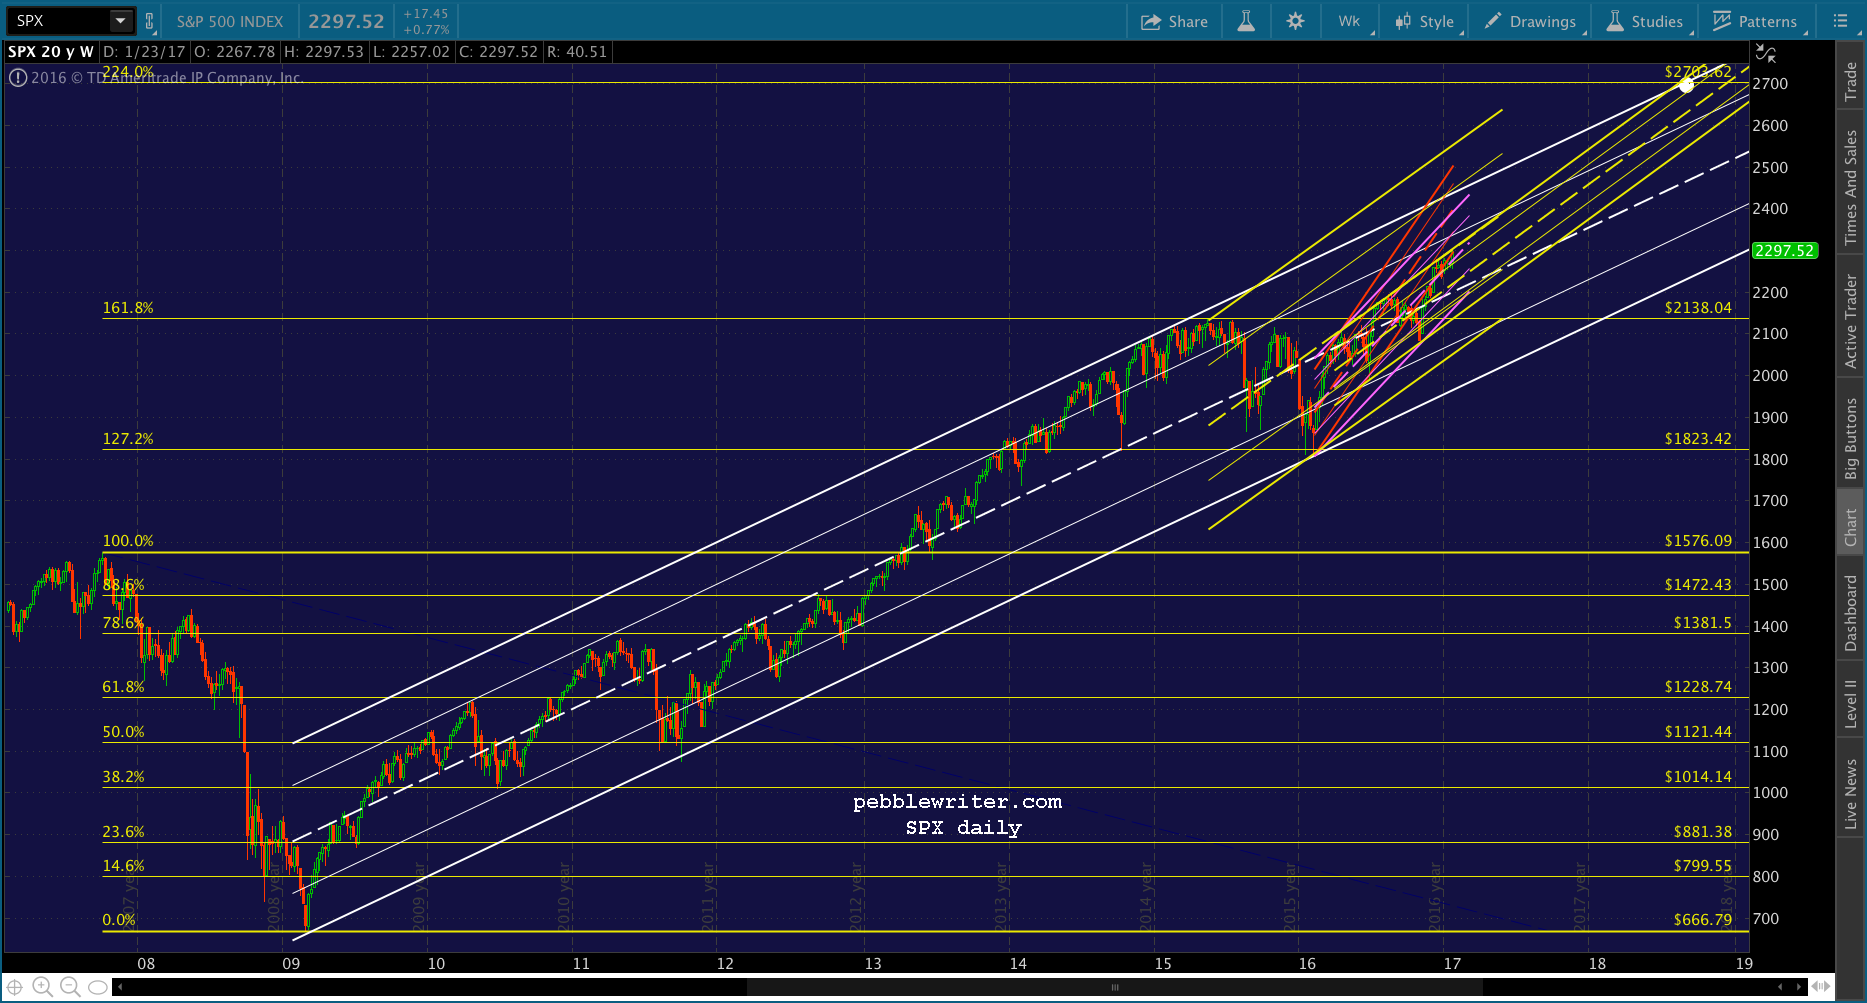 And, the weekly chart suggests that this breakout should be both real and lasting.
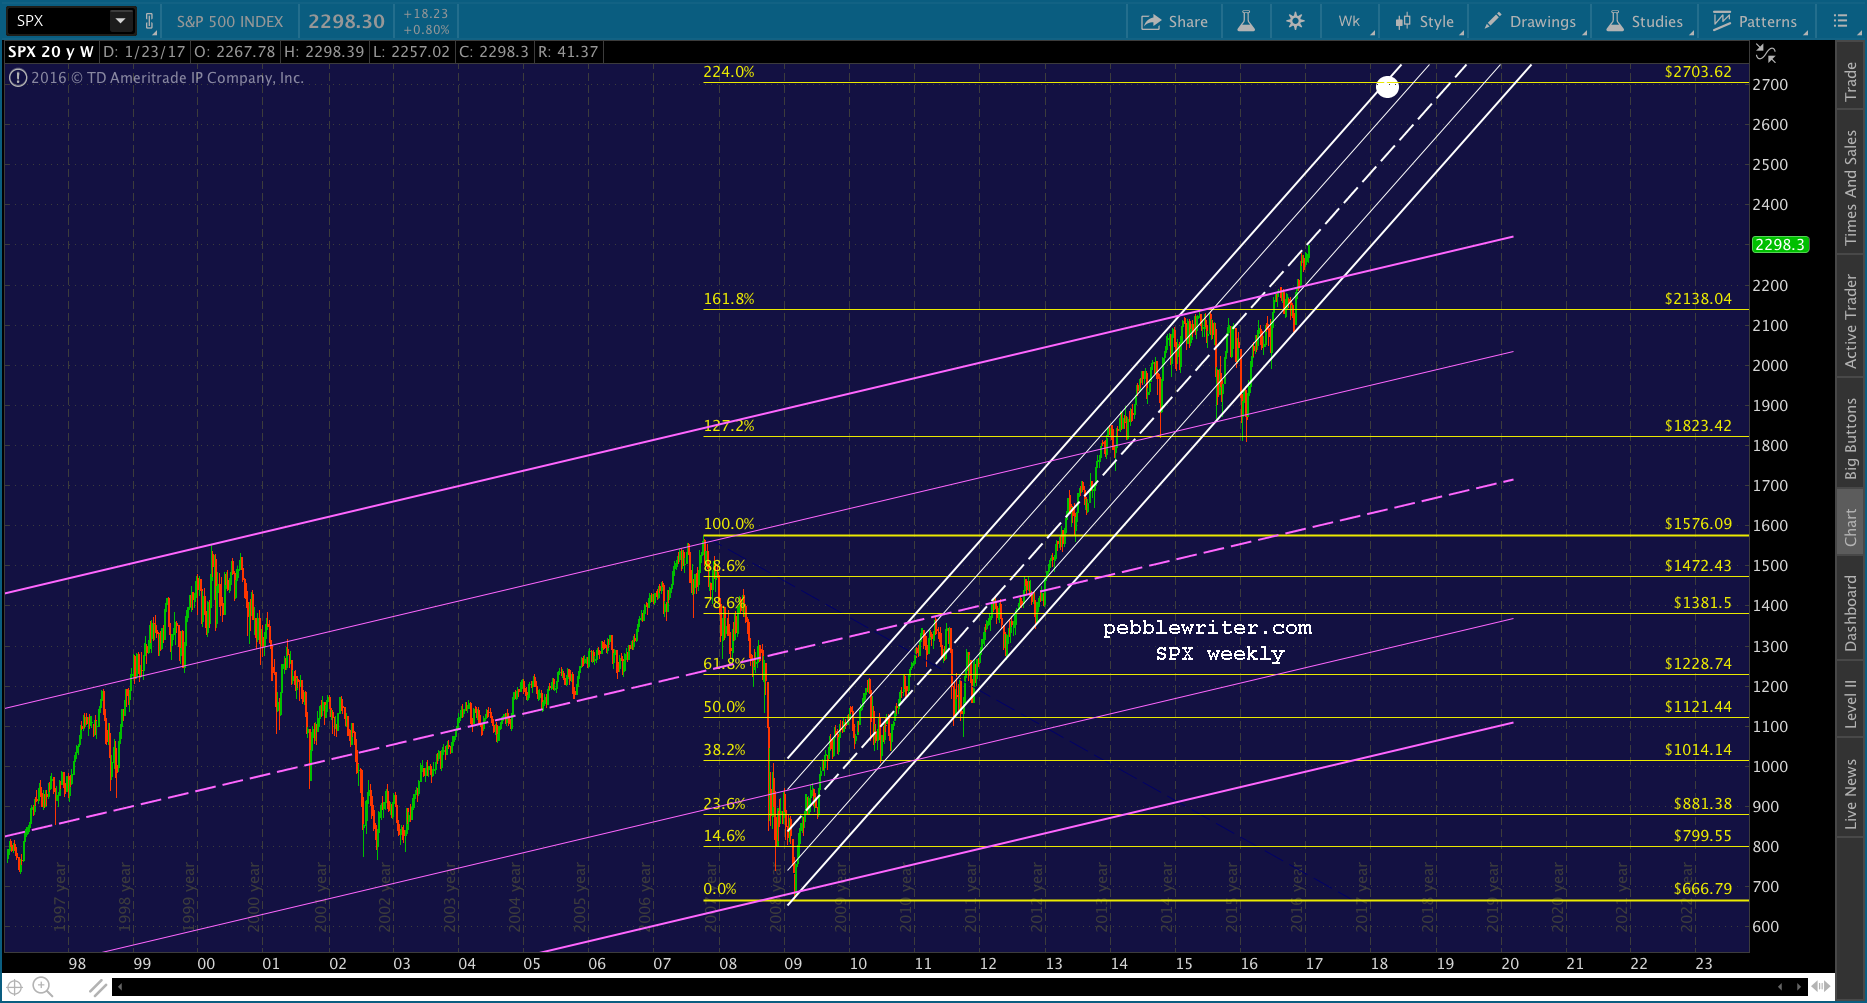 The log scale suggests it could come a lot sooner, perhaps as the midline crosses 2703 in May 2017. Though, if SPX can’t break out of the lower 25% of the channel, it could take considerably longer, say Feb 2018.
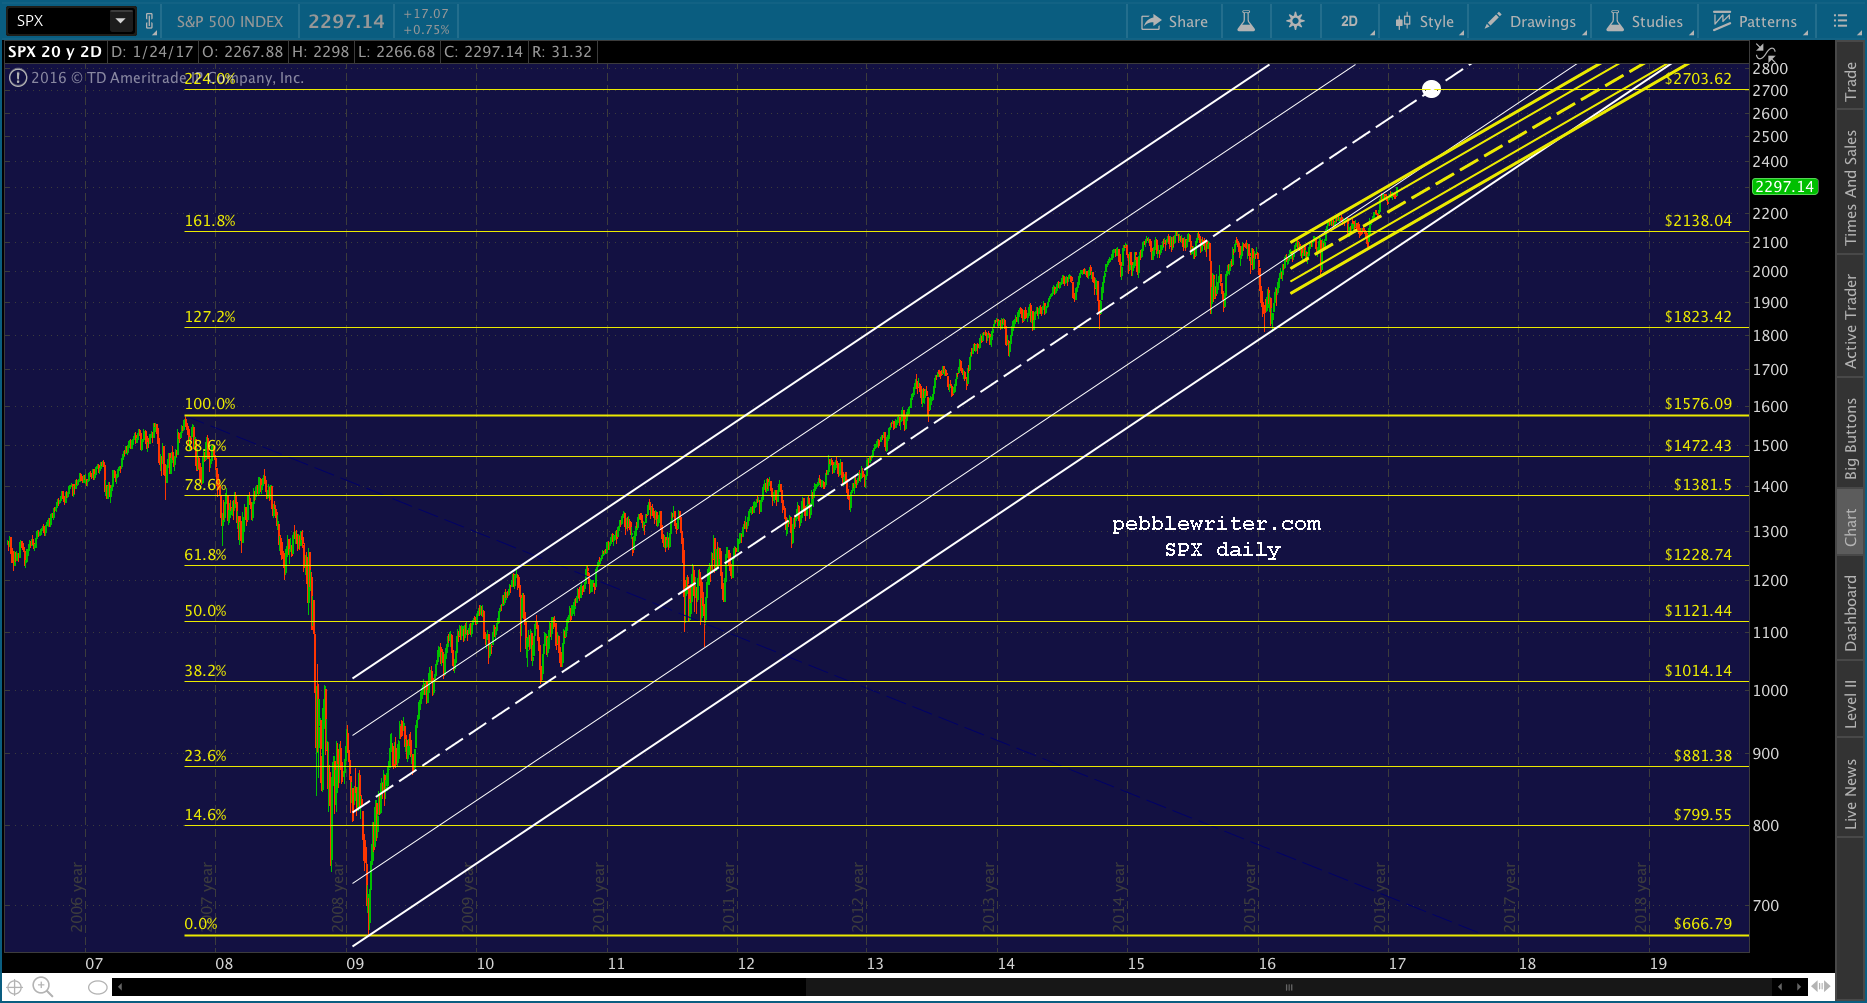 Like its arith cousin, the recent breakout seems to be the real deal.
 The yellow channel has a decent chance of mattering, as it fits pretty well the last three tops and two bottoms we’ve seen. Ultimately, we would expect it to align with the larger white channel of which it’s a part.
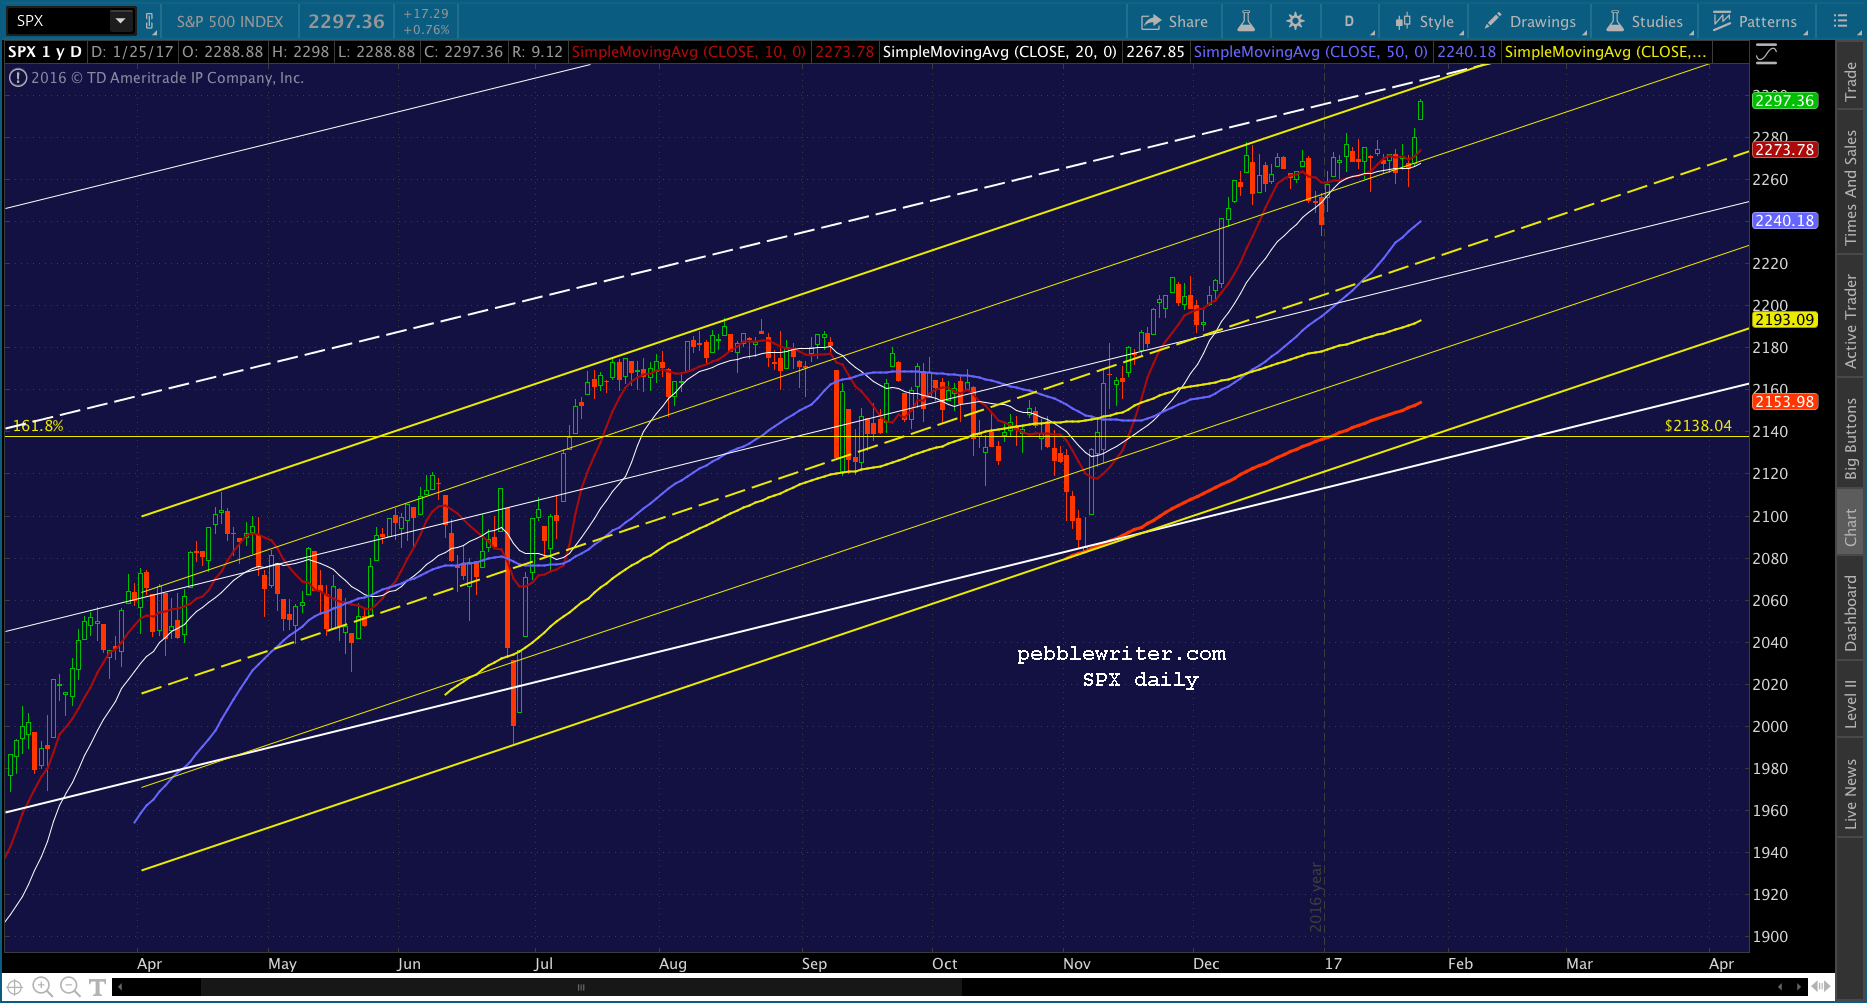 Sorry for the long break, folks. I’ve been battling the flu the past day or so and it got the better of me this afternoon. I’m going to take off and try again in the morning.
Before I go, our analog still has Day 141 (Friday) as an interim high. A backtest of the broken purple channel rising up from the election lows would put it at 2330-2340, in close proximity to the white 2.24 extension at 2330. 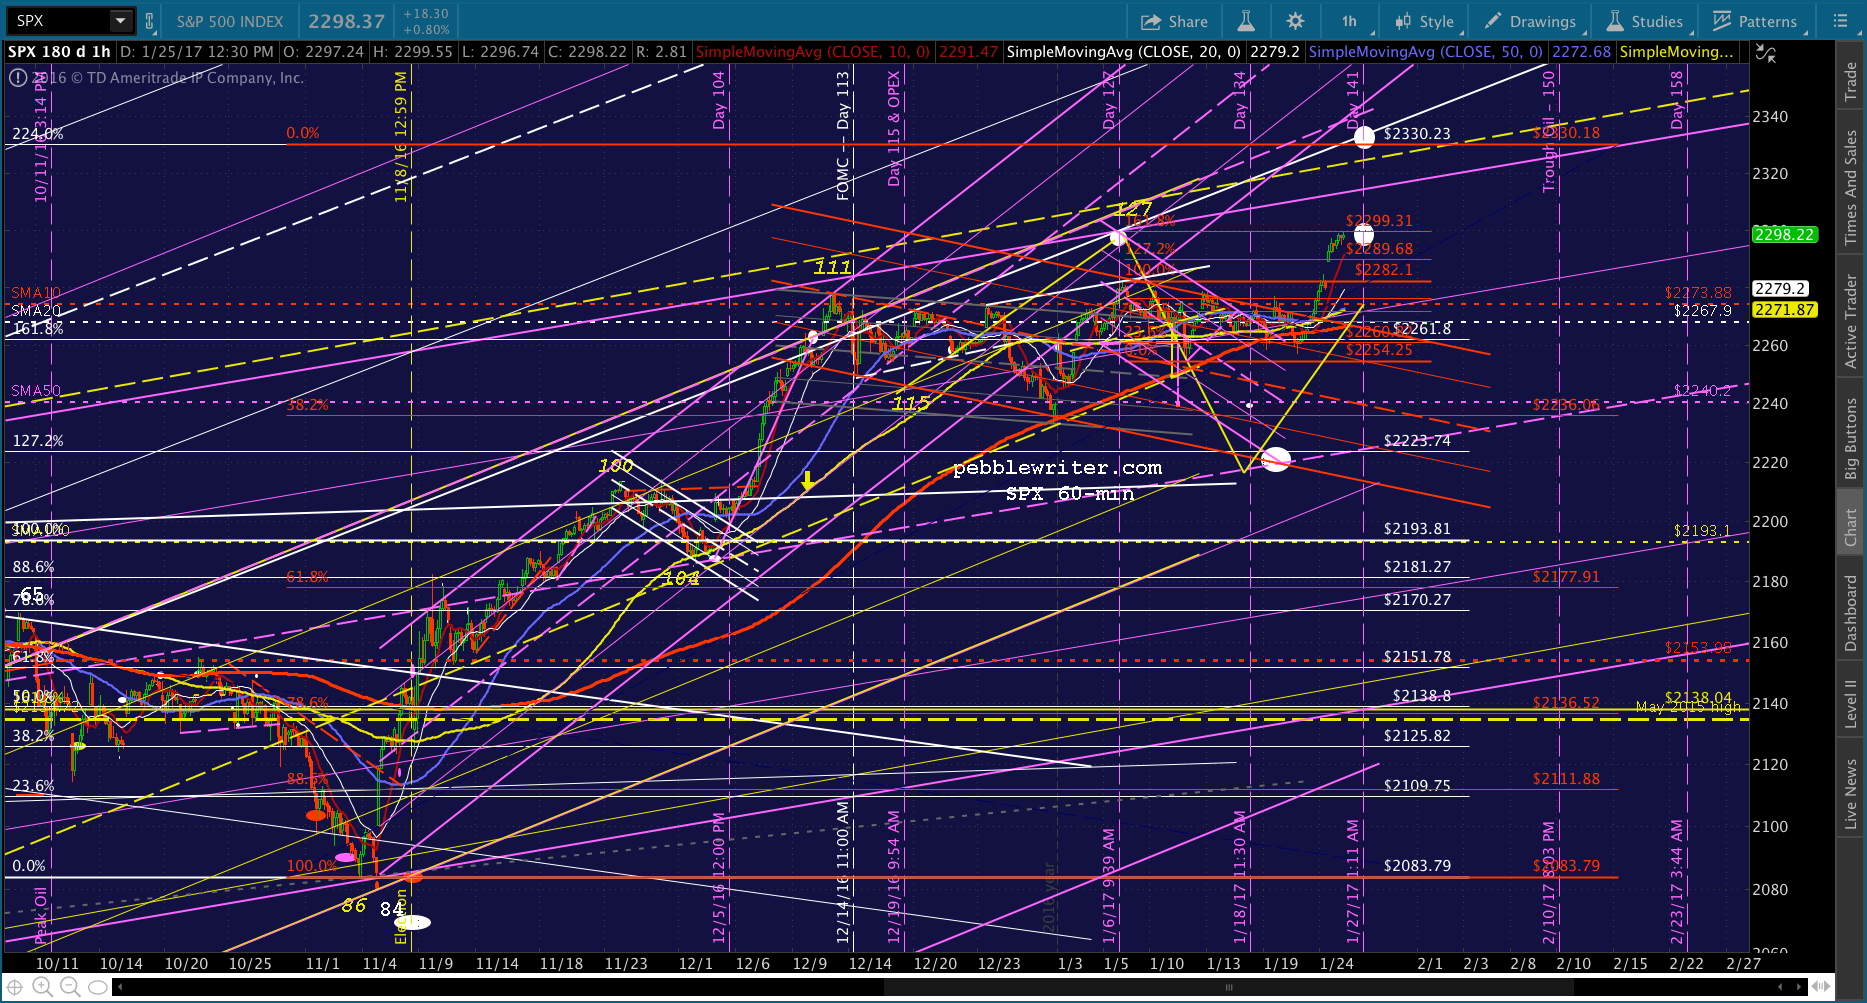 The hitch is that a smaller scale 1.618 was reached today — the red 1.618 at 2299.31. I think it’s likely that SPX will pause and backfill here.
We’re obviously at odds with the 2007 version, wherein Day 141 was a lower high than Day 127. And, TPTB would obviously want to avoid the Day 141 – 158 slide altogether. But, it’ll give us something to noodle over.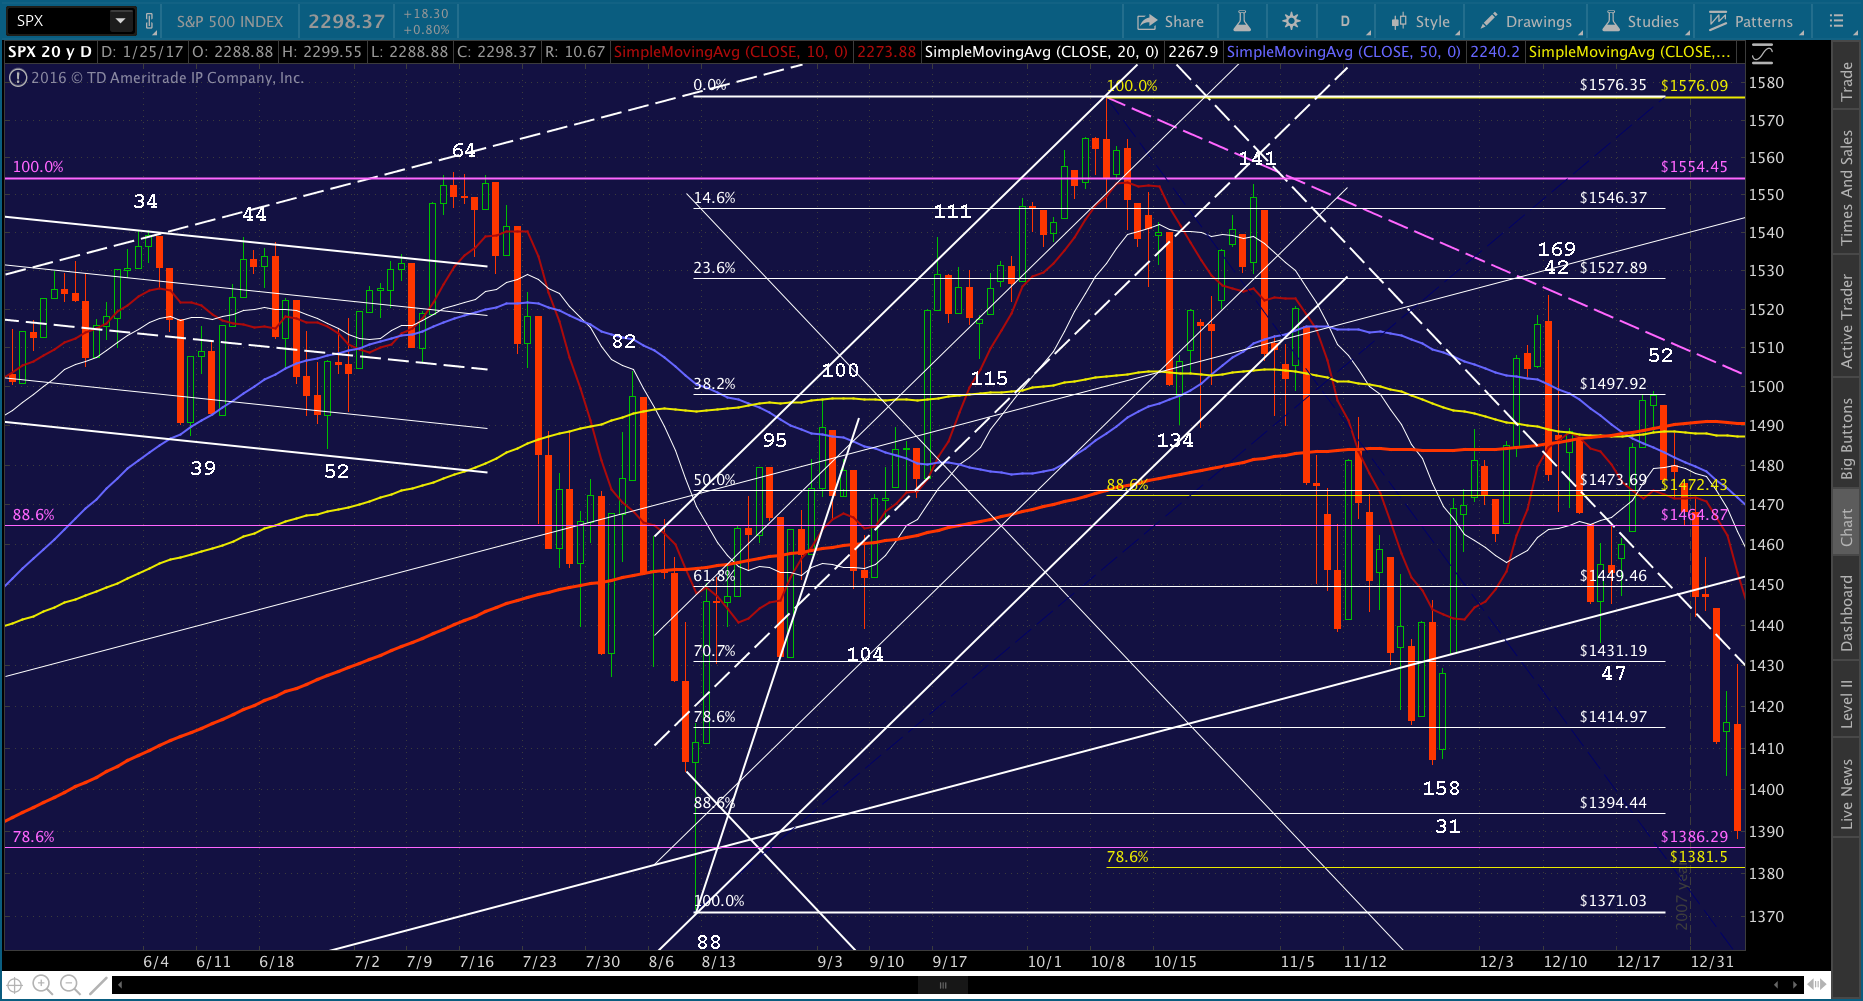 As always, only hold short overnight if you can hedge or deal with the gap risk.
Comments
One response to “The Big Picture: Jan 25, 2017”
PW, would the Big Picture indicates a possible reversal in the near future? Please elaborate that if you get a chance. Thank you!