Year: 2016

  • Update on XLF: Feb 10, 2016

    In our Dec 29 update on XLF, we noted that the rising white channel from Aug 24 and an important TL would be tested were the SMA200 to hold.

    Note that XLF just tested its 200-day moving average at the top of the falling red channel within the rising white channel which is, itself, rising within a larger falling white channel.

    If it breaks out, then the top of the falling white channel  and/or the rising white channel midline is the next overhead resistance to consider.  If it doesn’t break out, then we should see the rising white channel fall and the yellow TL tested again

    Not only did the rising white channel break down, but the yellow neckline failed as well.  Given these bearish developments, we’re left to wonder just how much worse things can get.

    2016-02-10 XLF daily CU 0945continued for members(more…)

  • Update on Gold: Feb 10, 2016

    In December’s update [Update on Gold: Dec 14, 2015] we discussed the importance of the dollar on gold’s future price moves.

    …the weakness in DX since Dec 3 suggests there’s a decent chance of the Fed punting.  If DX plunges further, GC’s 4th bounce could be a doozy: 1150-1180 for starters, and 1286 after that.

    The Fed didn’t punt.  They increased rates by 0.25% as expected, and DX rallied for a whole five days.  After peaking on Dec 21, DX has sold off in fits and starts [see: Update on DX Feb 9, 2016.]  GC spiked, reaching 1150 on Feb 4 and 1180 four days later.2016-02-10 GC daily CU 0800Today, it backtested the TL at 1180 and is threatening to break higher.  Does it still have legs?

    continued for members

    (more…)

  • FOMC: Still Tone Deaf

    Futures were unimpressed with Yellen’s prepared remarks this morning, with ES paring 16 points from its overnight highs.   2016-02-10 ES 5 0615Still, we would all do well to remember that “markets” can do some awfully strange things on Fed testimony days.  Traders won’t like Janet’s lack of capitulation on rate rises.

    But, indices often rise on these days as algos go into overdrive to maintain the illusion that all is well and the FOMC doesn’t, as a matter of policy, ever make mistakes.

    Case in point: the focus of yesterday’s post — the Nikkei futures — dipped well below the key TL from 2013, but have since rebounded exactly to the neckline.2016-02-10 NKD v SPX daily 0600continued for members(more…)

  • Update on US Dollar: Feb 9, 2016

    In our December 1 update on DX [Is DX Really Breaking Out?] I (somewhat cynically) suggested that DX’s rise above a key Fib level was just another scheme to convince investors that the markets were doing just fine.

    TPTB have done their best to convince the investment world that higher rates are just around the corner — even as signs of a faltering global economy continue to stack up.  Ramping the dollar up past a natural reversal point is just one more way to support that meme.

    As the FOMC dates approach, keep an eye on DX.  A sudden plunge below the .886 would be an excellent way of detecting that investors aren’t buying the story.

    Since Dec 1 (the yellow arrow, below) DX has plummeted, forcing USDJPY and stocks lower as “investors” abandoned the yen carry trade.  It got a momentary reprieve (the white arrow) when the FOMC raised rates on Dec 16.  But, since then, it’s been all downhill until today — where it has nearly reached our next downside target.2016-02-09 DX daily 0900Clearly, the dollar’s performance is critical to stocks.  What next, then, from the world’s reserve currency?

    continued for members(more…)

  • All Eyes on Japan

    To continue yesterday’s theme, we focus this morning on the Nikkei futures, which are testing a critical TL – again.  NKD is the first derivative of the BoJ’s manipulation of stocks via yen devaluation and, at times, leads “markets” in carry trade-oriented algorithms.

    2016-02-09 NKD daily 0600This support, therefore, is critical not only to NKD, but to SPX and the entire yen carry trade complex. [see: Update on NKD: Feb 9, 2016.]

    continued for members(more…)

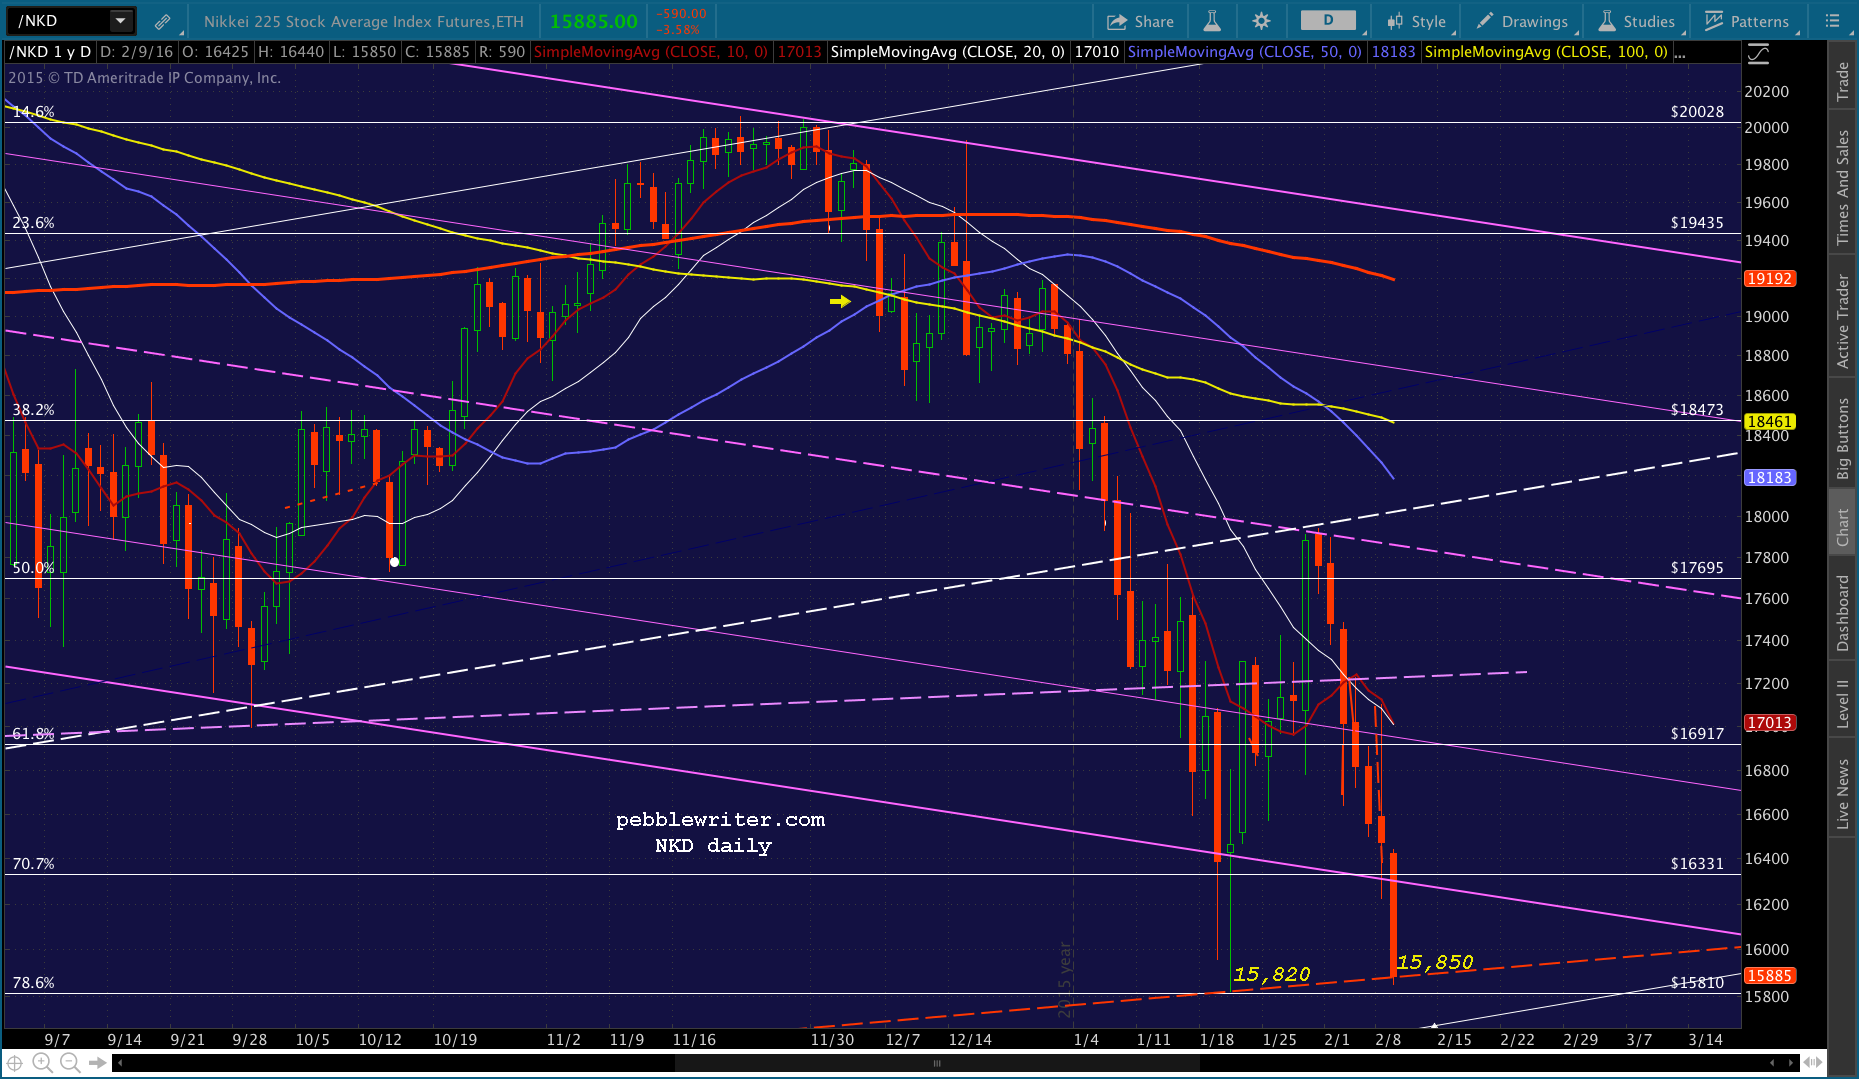
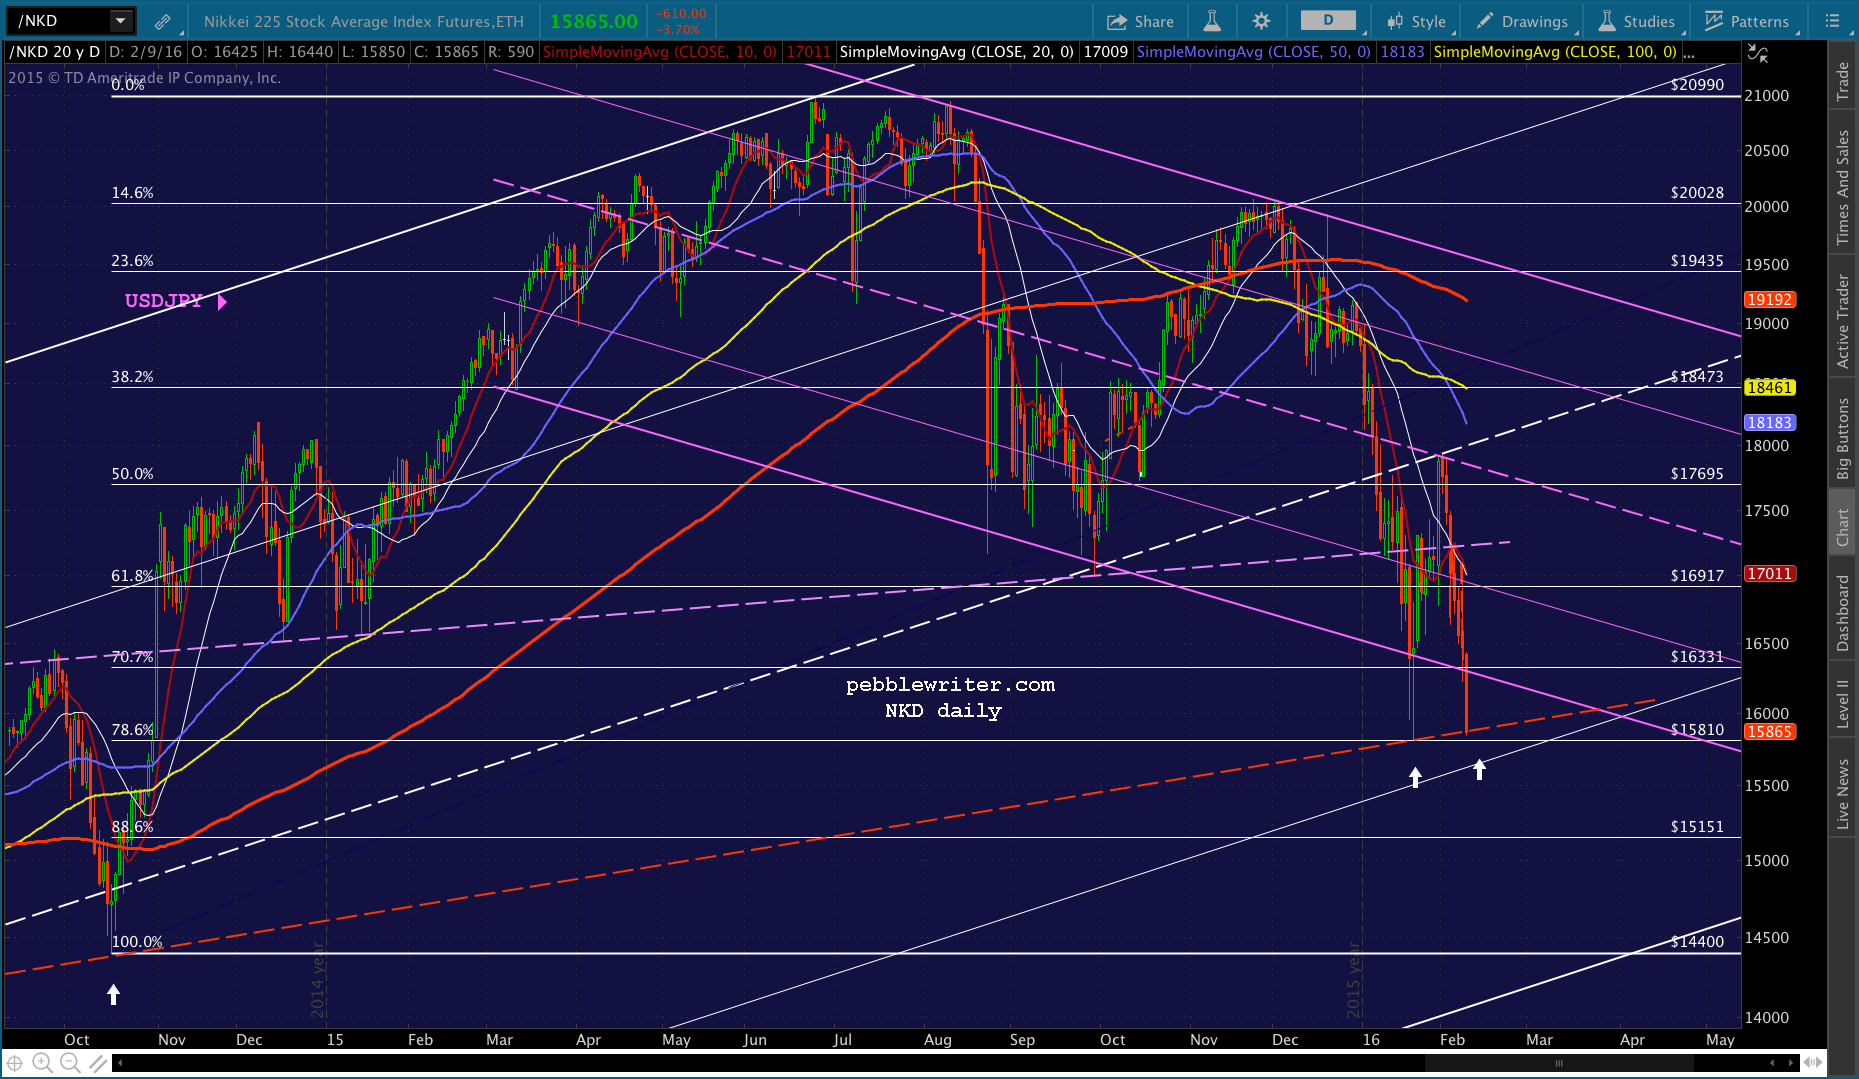
  • Update on NKD: Feb 9, 2016

    In our last update on NKD, we noted the arrival at an important junction of the 50 and 100-day moving averages.  We noted at that time that a drop through those levels would be quite bearish for both NKD and SPX.  NKD did drop through, managed a feeble recovery for two weeks, then really plunged.

    This was somewhat surprising, given that the NKD is one of the most heavily manipulated of the major “markets.”  What wasn’t surprising is where it finally found support on Jan 21.  Fun fact?  After a 13.4% bounce that climaxed in a disappointing BoJ QQE experiment, NKD is right back to that bounce spot.  It’s a very important spot.

    2016-02-09 NKD daily 0600 continued for members

    One simple chart illustrates the importance of holding 15,820.  Abe, Kuroda et al have a lot riding on this trend line.  They should step in and aggressively buy, today.  2016-02-09 NKD daily 05562016-02-09 NKD daily CU 0556

  • The Big Picture: Feb 8, 2016

    I’ve been beating the yen carry trade drum so long, I can’t remember when it didn’t matter.  Today, as on Jan 20, USDJPY has dropped below the bottom of the red channel.  And, stocks are not amused.  S&P futures were off over 31 points overnight before attempting the latest bounce.2016-02-08 USDJPY v ES daily 0530ES has dropped 100 points since USDJPY reversed at our upside target on Jan 29 following the BoJ’s ill-fated attempt to turn things around [see: BoJ Underwhelms.]  Now, as USDJPY drops through the channel bottom again, the “market’s” fate rests on whether or not the central planners will elevate the USDJPY yet again.

    continued for members(more…)

  • When All Else Fails…

    QQE didn’t work.  Jawboning didn’t work.  Not even NIRP worked.  When all else fails, the only course left to central planners is direct intervention.  Welcome to direct intervention.

    Yesterday, USDJPY tagged the bottom of a channel dating back to Nov 2014  for the second time in two weeks.  Remember, on Jan 20 it actually dipped below the bottom, resulting in SPX briefly dropping below the neckline of a large H&S Pattern targeting 1530.2016-02-05 USDJPY v ES 60 0605As we’ve discussed many times, this channel can’t fail without the yen carry trade suffering a huge setback and stocks plummeting much lower.

    continued for members(more…)

  • Oil to the Rescue, Again

    Yesterday’s meltdown made perfect sense — up to a point.  As USDJPY broke down through support level after support level, it was finally clear it was heading for 116.50 — the bottom of the red channel dating back to Nov 2014.

    We’ve written about this channel extensively, as it represents the line in the sand for USDJPY and, more importantly, for global equities [see: The Only Charts That Matter.] Quite simply, a drop through 116.50 means no more upside for stocks.  From Jan 19:2016-01-19 USDJPY daily HSEverything was progressing according to plan when TPTB panicked and booted CL out of its thrice-failed trajectory into the stratosphere.  2016-02-04 CL 60 0600The impact on stocks is perfectly illustrated by NKD, which was only 10 points away from its obvious .618 target when the excitement began.  See if you can spot the moment.2016-02-04 NKD 15 0600CL continues ramping this morning.  How high will they push it?  As high as they need to in order to distract carry trade investors from the USDJPY debacle going on.

    continued for members(more…)

  • Wait for It…

    I was a bit chagrined when, after posting BoJ Underwhelms last Friday, a 47-pt meltup followed the initial ho-hum reaction.  My point then was that the BoJ had:

    1.  managed to ramp USDJPY directly to overhead resistance; and,
    2.  it wouldn’t matter unless yen carry trade investors believed it would continue higher.

    I’m chagrined no more.  Not only did the pair reverse at that resistance (a major channel midline and the SMA 200), but the subsequent reversal plunged right through the biggest, most important line of support in the most important instrument that affects the “market” — the USDJPY’s 61.8% Fib at 120.11.  It erased over 80% of USDJPY’s post-Kuroda gains, and 88.6% of SPX’s gains.

    2016-02-03 USDJPY 60 0600continued for members(more…)