Month: July 2016

  • USDJPY’s Game of Chicken

    It seems hard to believe that S&P futures are up at all, given that CL has dropped like a rock.  But, USDJPY continues to hint at a breakout, which is enough to make the algos quiver with anticipation.2016-07-20 USDJPY 60 0609Is the BoJ ready to go all the way, or is this another head fake as in late May?

    continued for members(more…)

  • Time Out?

    After three weeks of nearly non-stop ramping, the conditions are finally about right for that break we’ve been expecting.  The big question: what next?

    continued for members(more…)

  • Charts I’m Watching: Jul 18, 2016

    Final day of my road trip…  I’ve had a great time seeing clients, many for the first time.  Many thanks for all the hospitality and lively discussions!  Having spent much of my life in New York and Boston, I’ve thoroughly enjoyed visiting many smaller communities and getting a better sense of life outside the big cities.

    *  *  *  *  *

    SPX’s long-awaited pause appears to finally be here, though as noted on Friday the SMAs aren’t quite in position for much of a decline.

    continued for members(more…)

  • Logic Need Not Apply

    I’ve been traveling for the past two weeks, so haven’t yet had the chance to fully express my dismay (but, not surprise) at the way TPTB have snatched new highs from the jaws of the Brexit’s sell off.

    As I detailed on June 22 in The Eve of Destruction, the EURGBP and SPX are highly inversely correlated.  A sharp rally in EURGBP sends stocks plunging.  And, a sharp decline in EURGBP sends stocks higher.

    A successful Brexit, the theory went, would make the GBP plunge — meaning EURGBP would rise and stocks would sell off sharply.
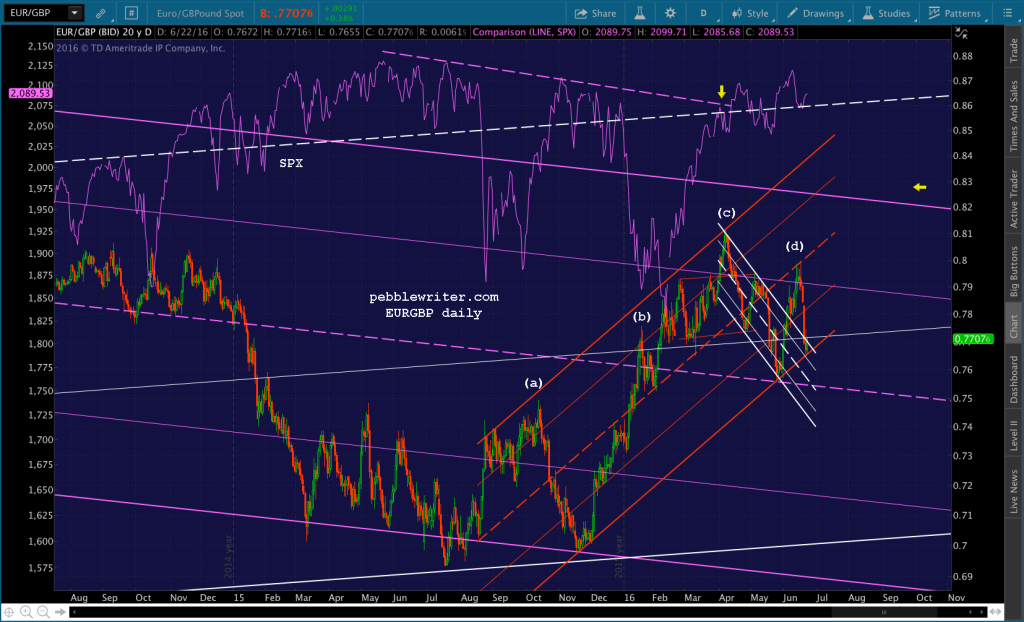
    2016-06-22-EURGBP-v-SPX-daily-1041-1024x622This was the chart I posted on June 22, showing upside targets for EURGBP of .8411 and .8599.

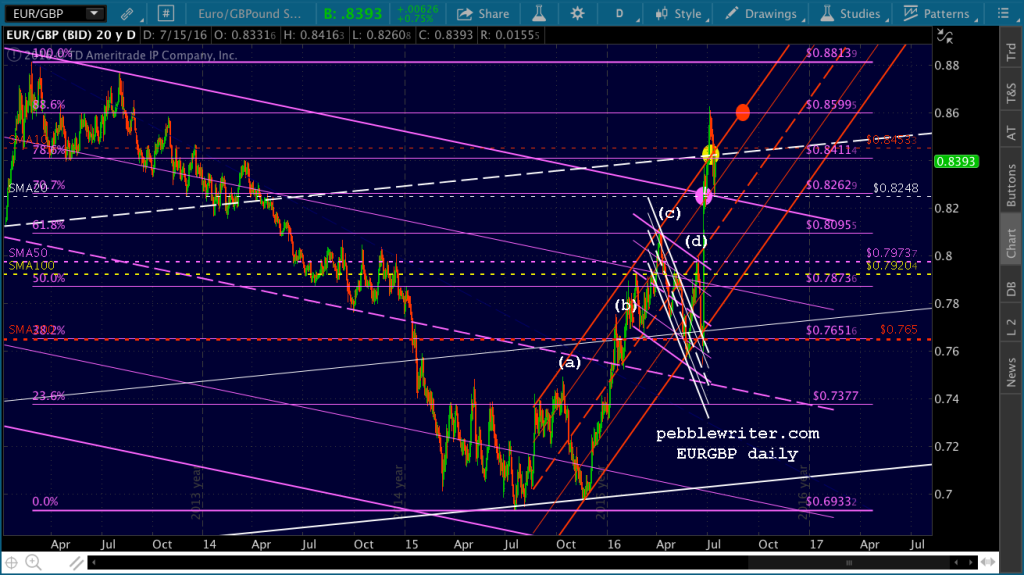
    2016-06-22-EURGBP-daily-CU-1829-1024x622As it happened, EURGBP had no trouble reaching those targets.  In fact, .8599 was reached on Jul 6, over a month ahead of schedule.  It was so ahead of schedule as to represent a breakout of the rising red channel.2016-07-15 EURGBP daily 1037
    We all know the punchline.  The drop in SPX was sure and swift — 122 points in two days.  The plunge was just as swiftly erased by massive central bank intervention.  It wasn’t difficult, given that it around a very low-volume holiday week.  It was done in the usual way: USDJPY and CL ramp jobs.

    From the Jun 22 post:

    To be sure, a little extra pain at the pump (for the have-nots) is NOT going to stand between TPTB and their inflated balance sheets.  If EURGBP starts screaming higher and stocks start plunging, don’t be surprised to see CL pushing higher.  I have a 54.76 upside target that could easily come into play if the Brexit happens.

    Likewise, the BoJ has a long and distinguished history of throwing its citizens under the bus when necessary to prop up stocks [see: The Yen Carry Trade Explained.]  Their need is a little more pressing, in fact, since they have borrowed trillions of yen in order to “invest” in global equities.  The USDJPY recently bounced at an important Fib level, and there’s very little in the way of overhead resistance.

    Crude’s rally was short-lived, but effective (though, the channel in which it’s been rallying since Feb 11 broke down last week.)  USDJPY, which long ago broke down through anything resembling a bullish channel, managed to rally at all the right times (while the “market” was open.)

    There were other tools at work, of course.  But, the net result is that SPX managed to rally while EURGBP was also rallying.  In a sharp departure from the usual relationship, they are again positively correlated — suggesting that a rapidly depreciating GBP is good for stocks.

    2016-07-15 EURGBP v ES 4 1056This is utter nonsense, of course, as are so many other correlations that have broken down over the past several years.  It’s what happens when central bankers and their lackeys manage stock prices as they’ve been doing.

    This is no surprise to regular readers, as I have posted ad nauseum about the games central bankers have been playing for years.  New guy?  See: How They Did It, one of many posts illustrating the technique.

    But, it is depressing for those of us who were brought up in the business thinking that stock prices were a logical reflection of the risk and reward inherent in an open and transparent marketplace.  Those days are long gone.



  • Charts I’m Watching: Jul 15, 2016

    The melt up continues, though TPTB might allow a pause or even that overdue pullback in response to the atrocious attack in Nice, France.

    continued for members(more…)

  • Charts I’m Watching: Jul 14, 2016

    More of the same.  Today’s forecast is exactly the same as yesterday’s, with a little more certainty thrown in regarding a backtest.

    continued for members(more…)

  • Charts I’m Watching: Jul 13, 2016

    SPX has cleared most of the obstacles to unfettered new highs.  USDJPY continues to perform contortions that only a central banker could love.  While, CL continues to be a potential drag.

    continued for members(more…)

  • Charts I’m Watching: Jul 12, 2016

    Technically, SPX reversed yesterday at the 1.618 extension of the drop from 1576 to 666 between Oct 2007 and Mar 2009.  In an unrigged world, we’d call the move from 1810 to 2143 a truncated 5th wave and get ready for a massive sell off.  2016-07-12 SPX 5 0535But, with more and more talk of helicopter money in Japan, and rapidly rising CL and USDJPY, it’s hard to imagine.

    continued for members(more…)

  • Charts I’m Watching: Jul 11, 2016

    The last time SPX was in a position to make new highs, it fell 125 points instead.  If fact, it’s tested the May 2015 highs six times since then.  Any of those days, it was within a good ramp job of shooting up past 2134.  Is this one any different?

    continued for members...

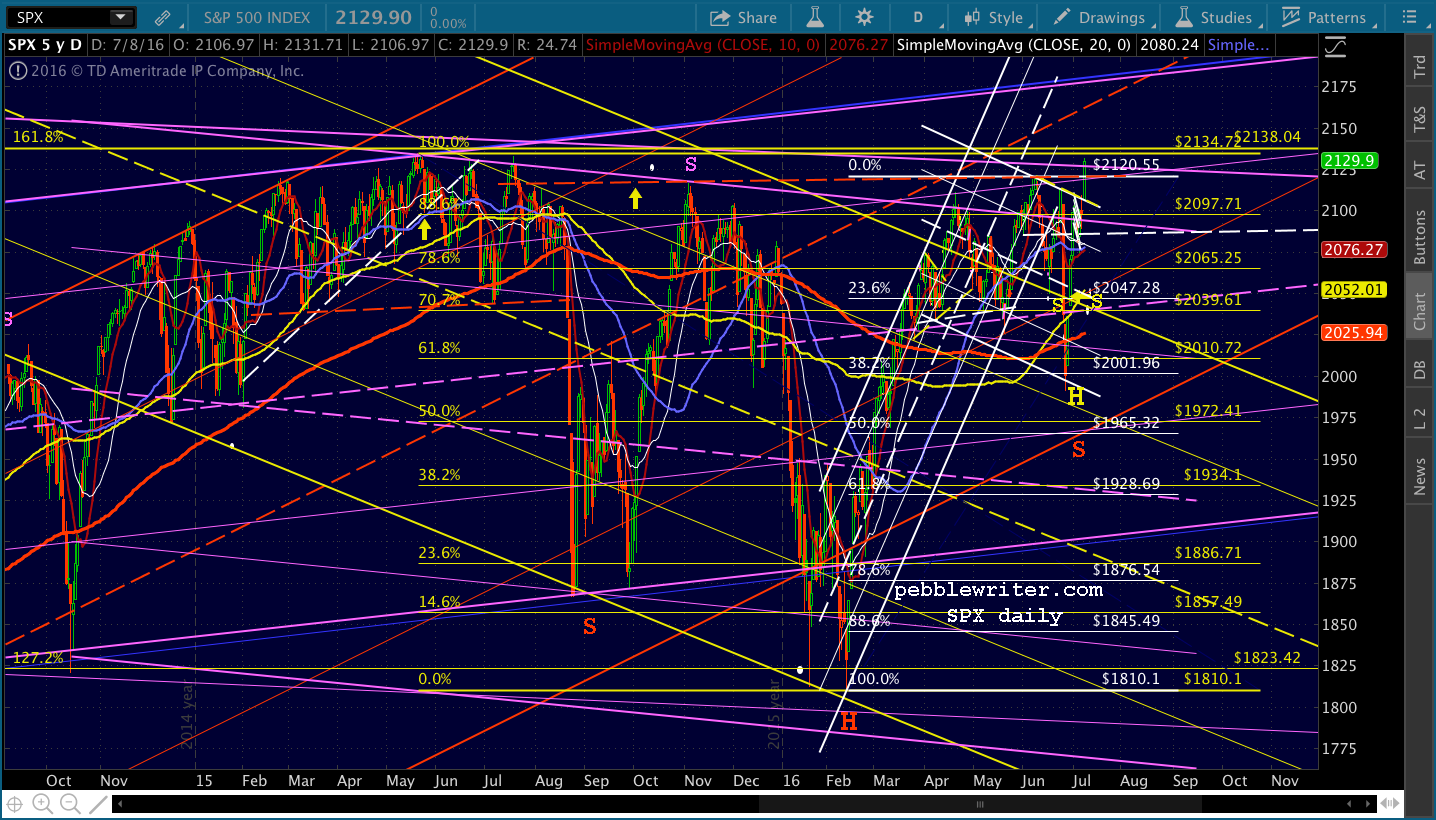
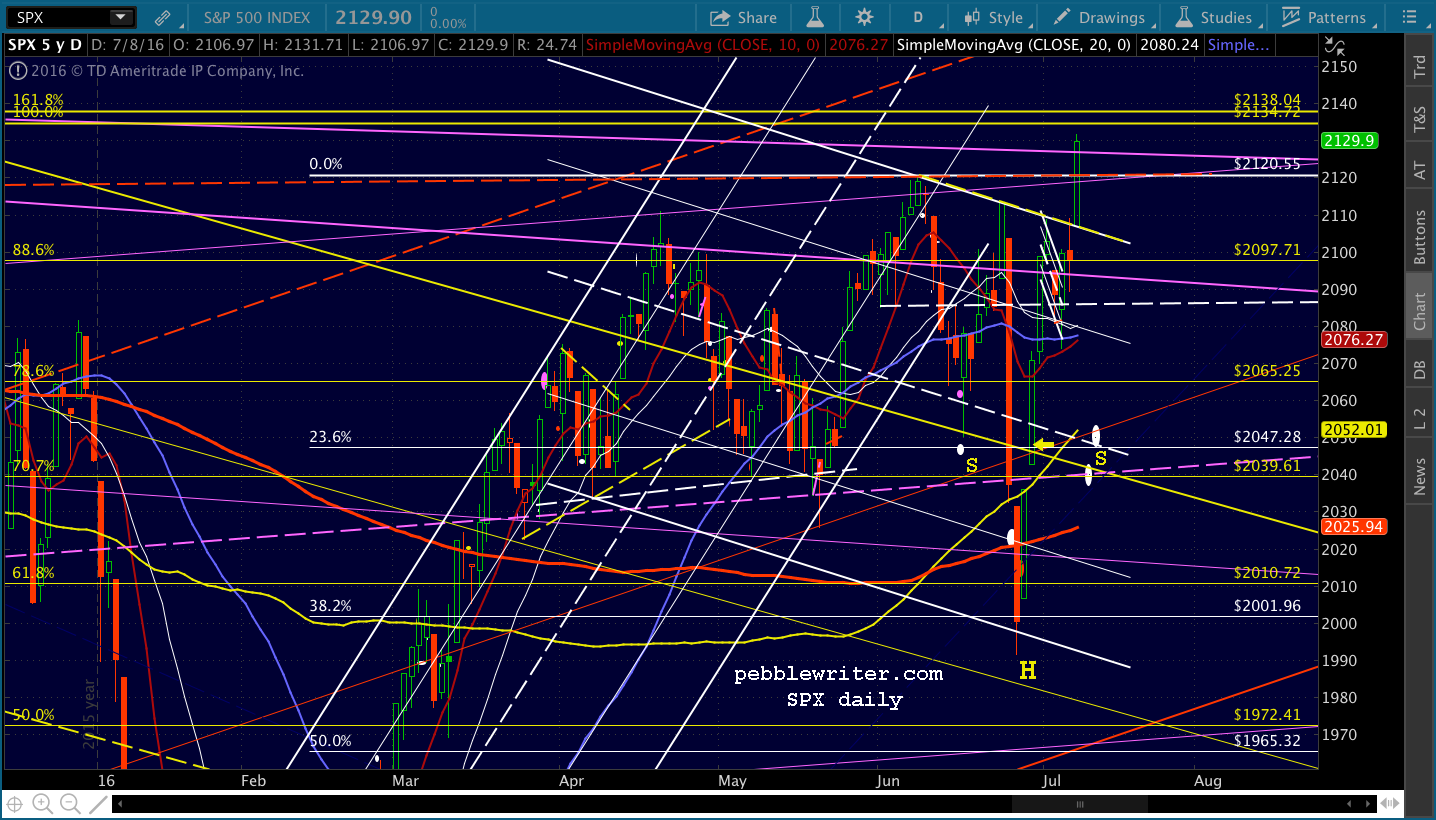
    First, note that SPX has successfully backtested the falling yellow channel (though it probably dipped a little lower than they had planned.)  It has also broken out of the falling purple channel. 2016-07-11 SPX daily 0846 It did this once before, but Brexit knocked it back down quite a bit.  It has now completed an IH&S Pattern within the right shoulder of a much larger IH&S Pattern targeting 2422.

    2016-07-11 SPX daily CU 0547And, it broke out of the small, falling white channel — busting the bearish Harmonic grid that had provided a path lower.

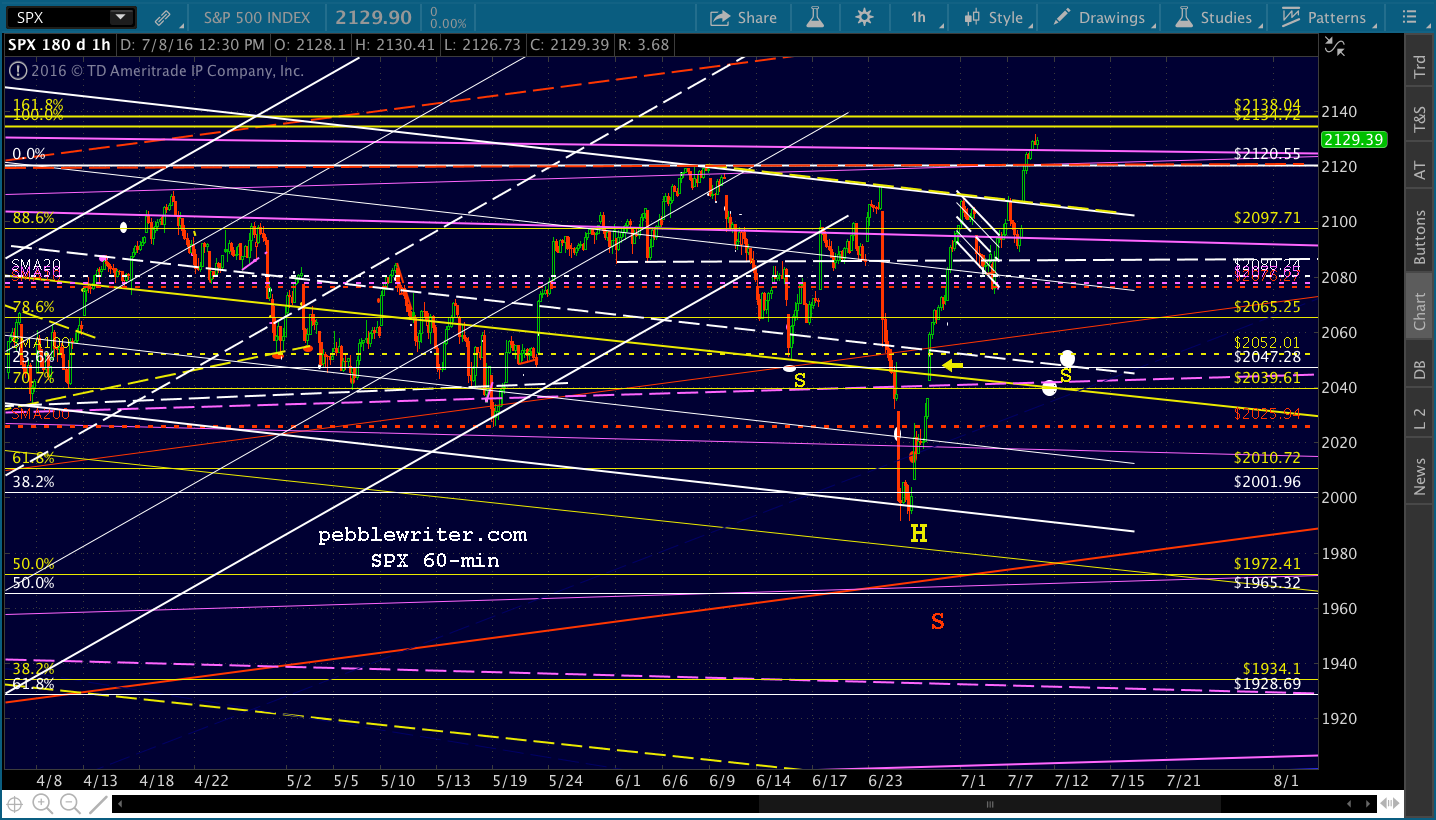
    2016-07-11 SPX 60 0547In short, there are no chart patterns or harmonics standing in the way of new all-time highs — which is what you would expect when central bankers are gearing up for more stimulative action and when the global Stimulator in Chief (Abe) was reelected in a landslide.

    About the only resistance is the actual 1.618 extension at 2138.04.  It was this Fib level that SPX came up 4 points short of on May 20, 2015.  Technically, we could call the rise back to 2138 a truncated 5th wave and get ready for a huge decline.

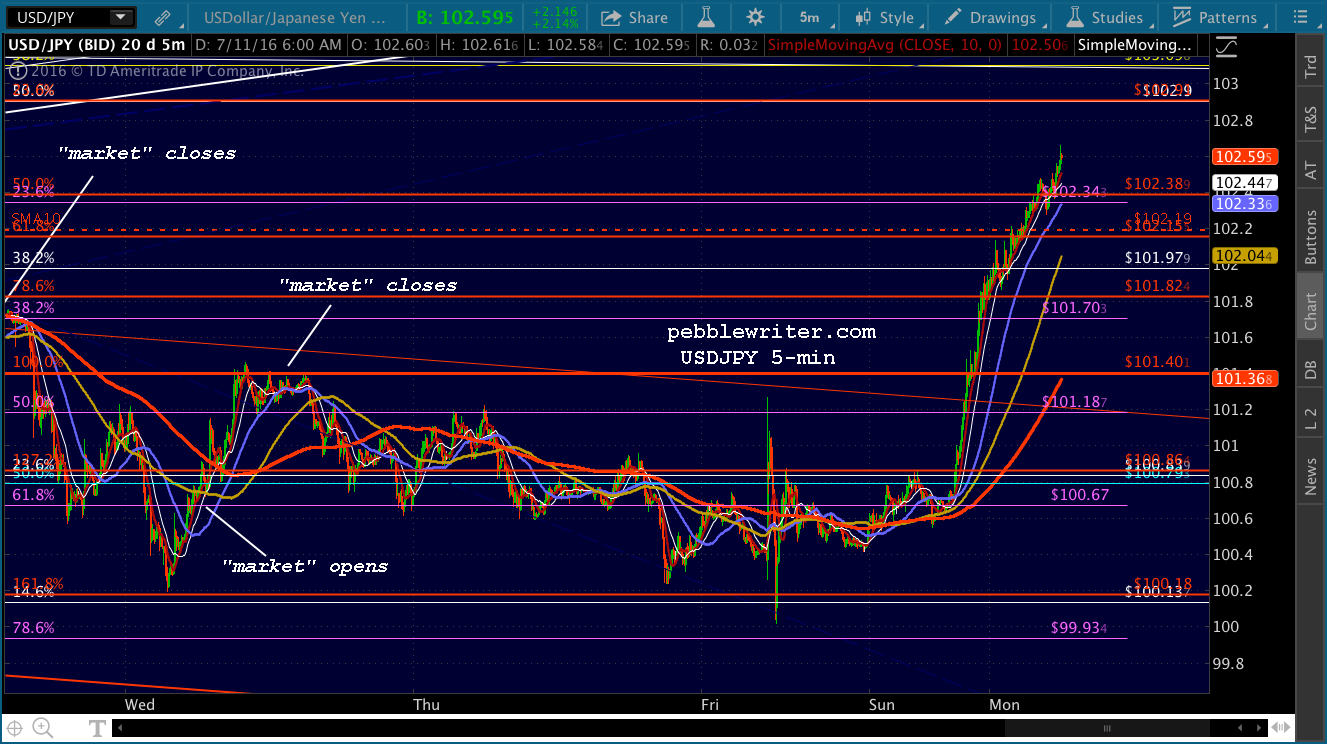
    But, I imagine TPTB have taken this risk into account and are planning a very big push to make sure it doesn’t happen.  Seen USDJPY this morning?

    2016-07-11 USDJPY 5 0903GLTA.

  • Charts I’m Watching: Jul 8, 2016

    Not much new to report at this hour, as all eyes are on this morning’s employment report.  Another bust like last time would drive a nail into the Fed’s rate rise coffin.  While, a strong report might give pause for thought.

    The biggest chart development yesterday was in oil, which tumbled sharply.

    continued for members(more…)