

After three weeks of nearly non-stop ramping, the conditions are finally about right for that break we’ve been expecting. The big question: what next?
continued for members… ES’ rising white channel has broken down, with two days now of sideways action — waiting for the MAs to catch up. They have, with the SMA10 finally above the May 2015 highs.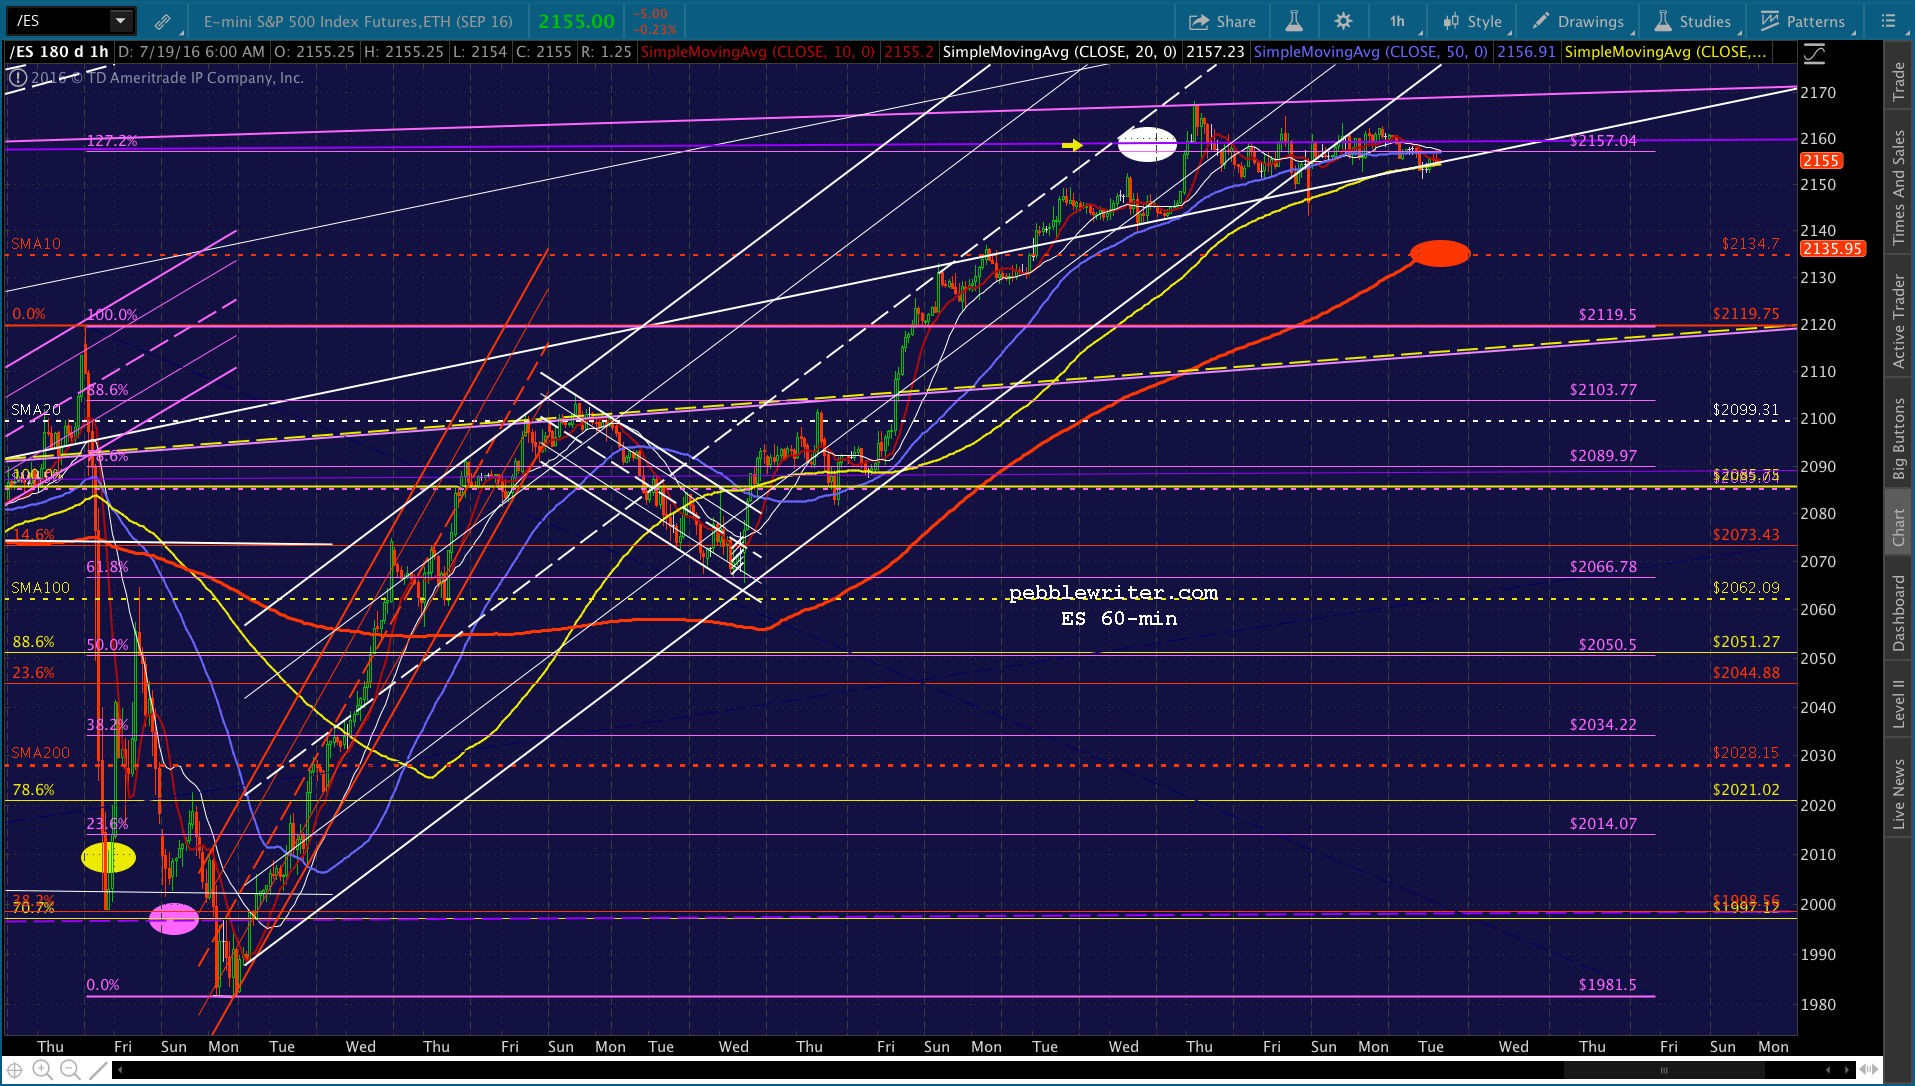 Likewise with USDJPY, which could easily have pushed through to pre-Brexit highs and broken out of the falling red channel — but, hasn’t.
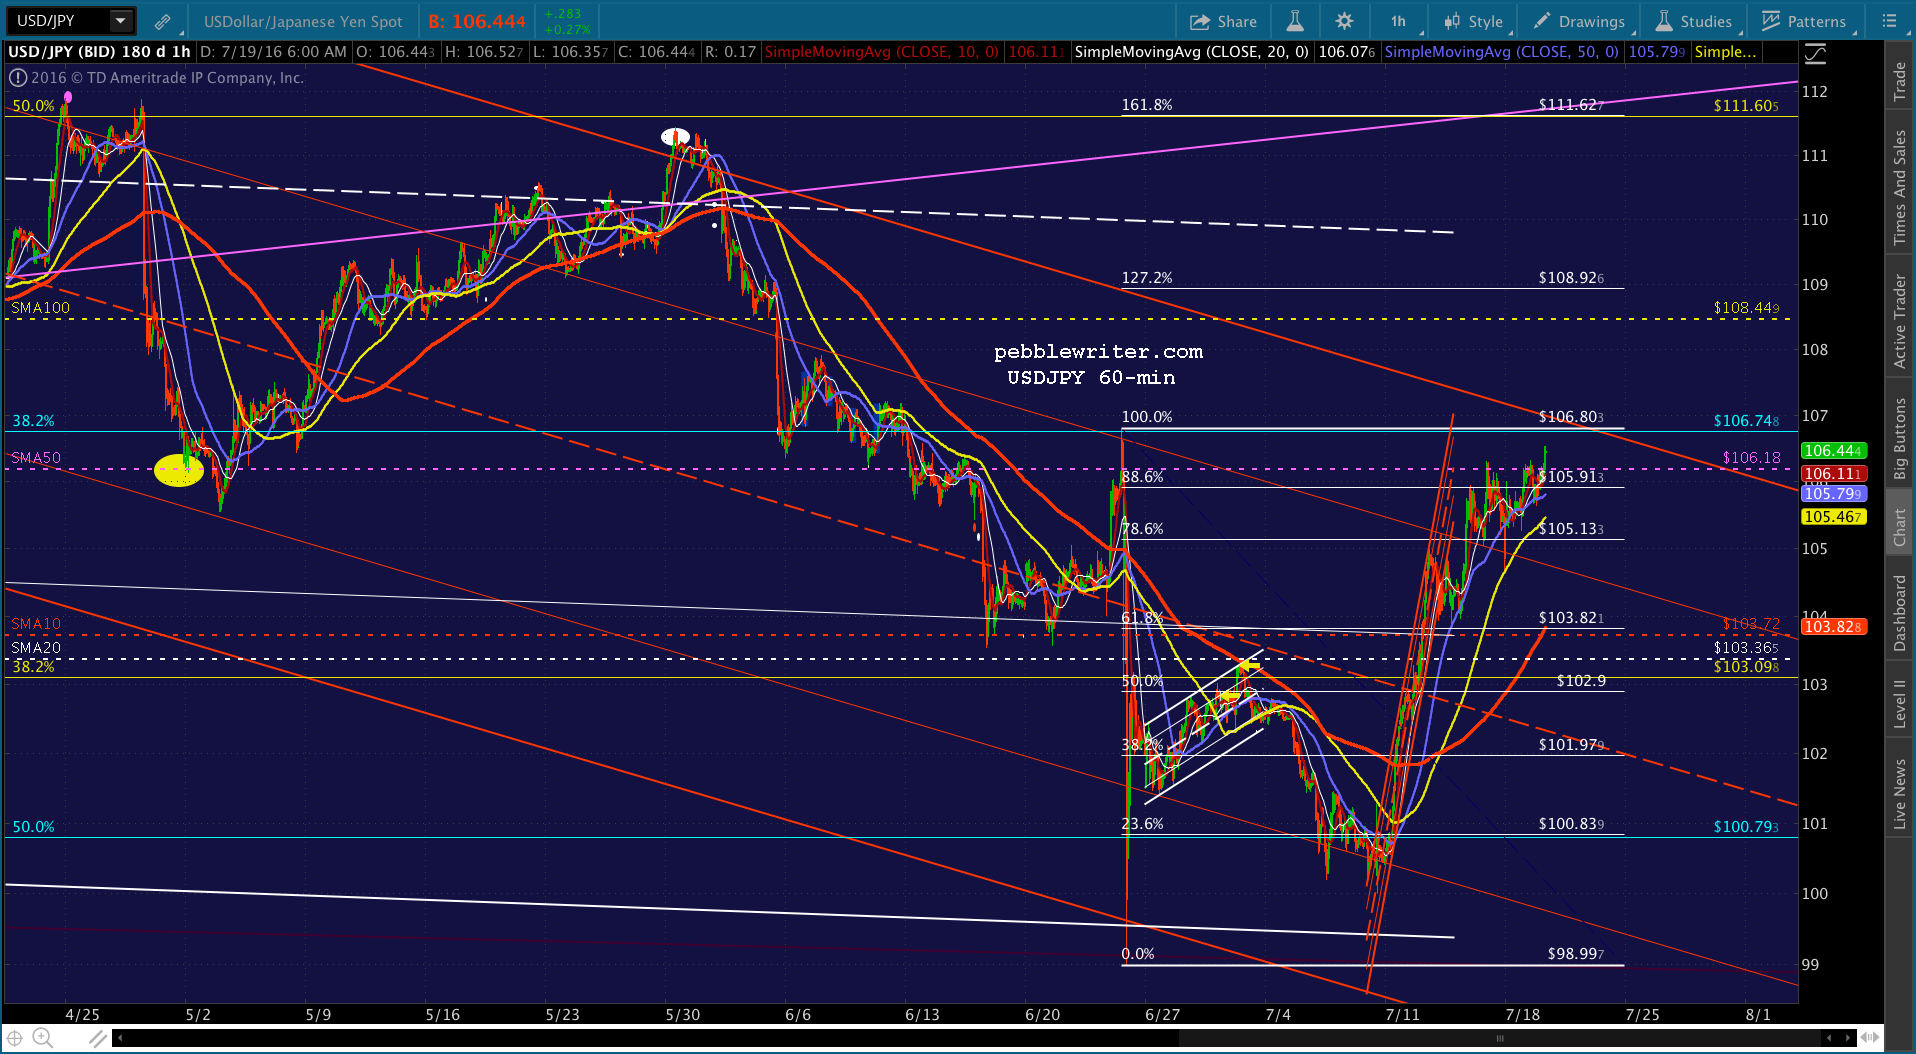 SPX’s SMA10 is at 2135.02, which is finally above the May 2015 highs. In other words, the coast is clear for some downside.
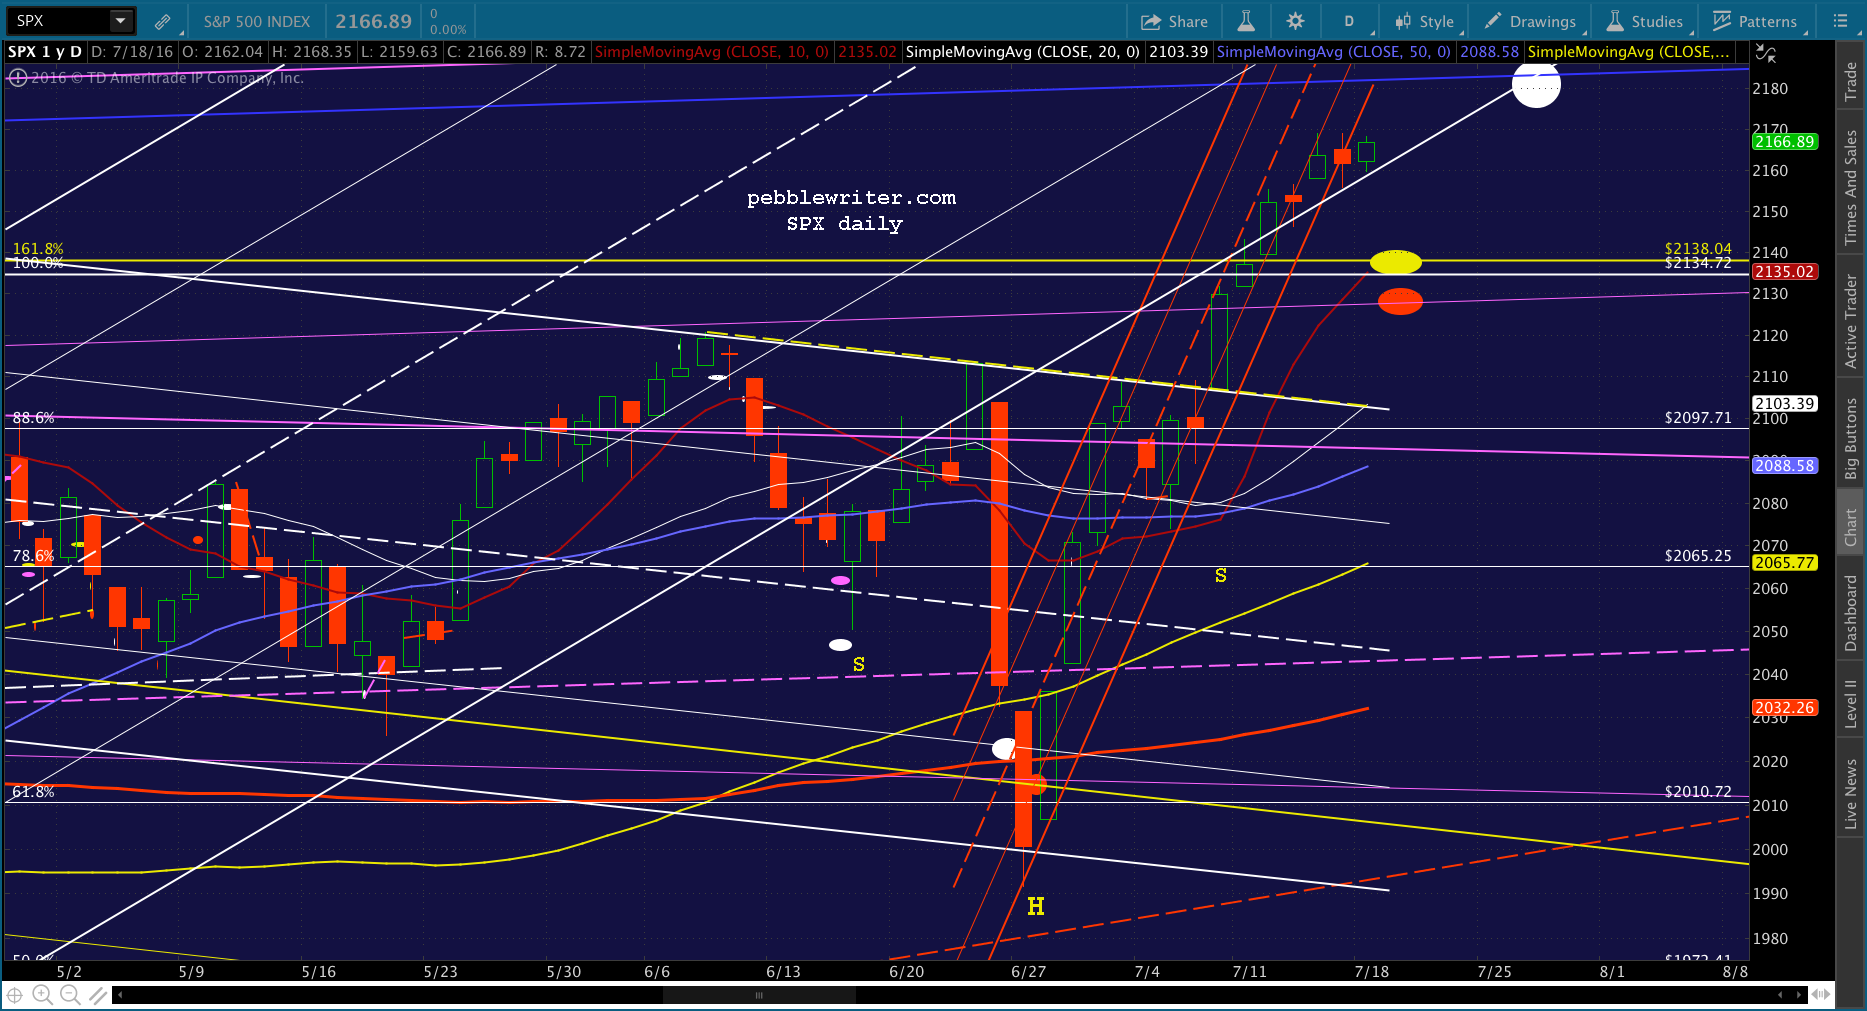
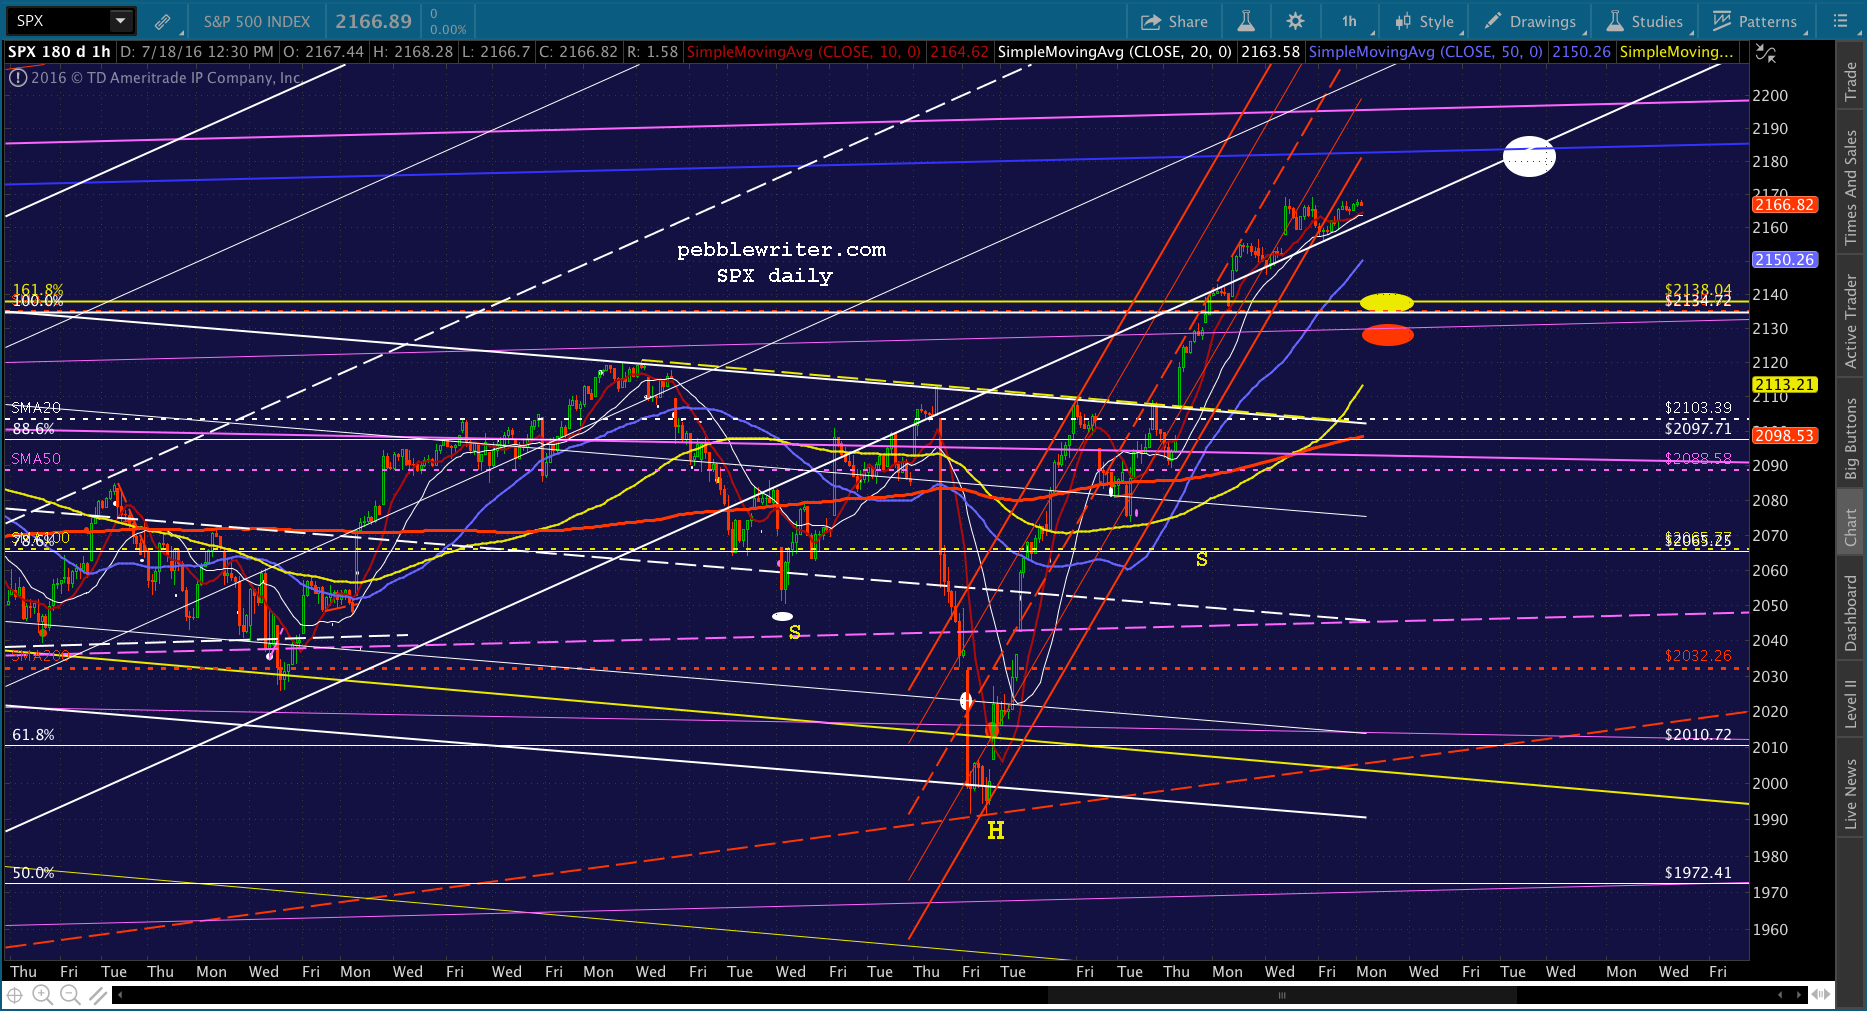 I believe the next step is to say goodbye to the rising white channel all-together and set up a less steep version, shown below in purple. If I’ve drawn it right, the dip today and tomorrow will tag its midline at 2134-2138.
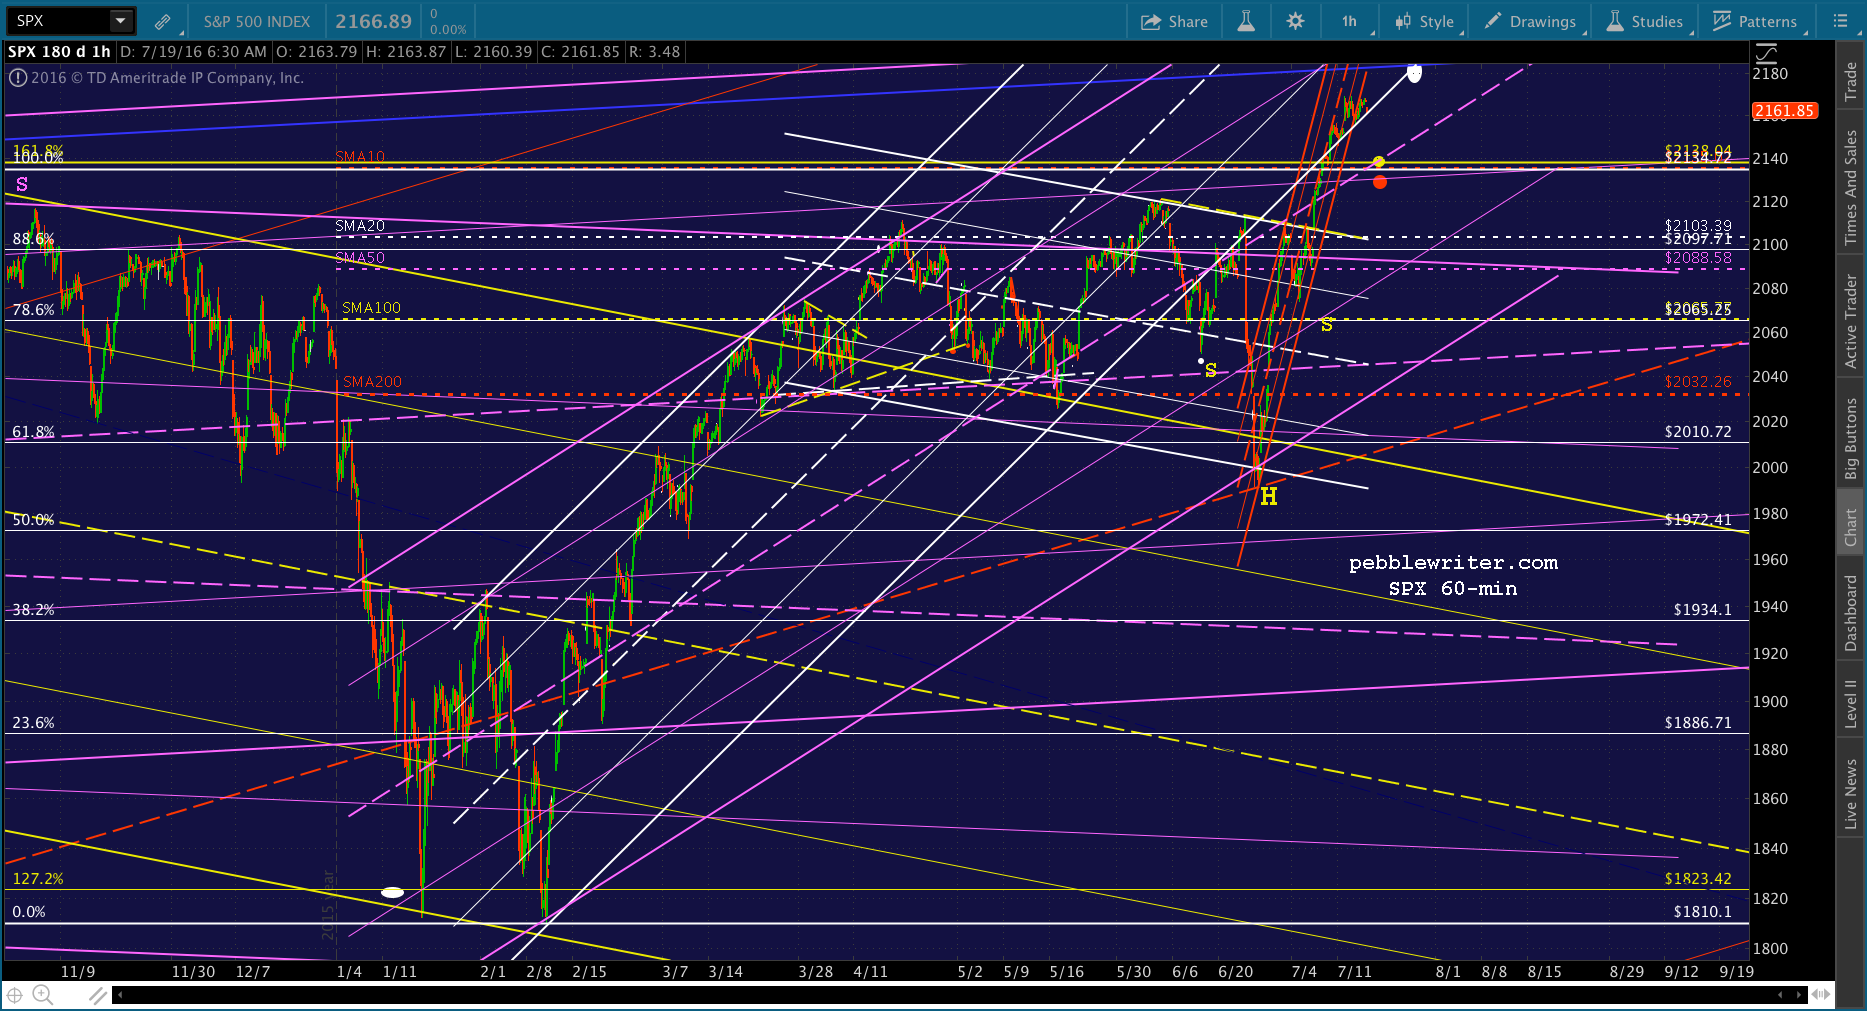
Comments
4 responses to “Time Out?”
Pebble, i wonder for years what your method/technic is to draw the channels. I’m a deep channeler too 🙂 channeling everything. fyi: i work with bloomberg and its technical tools. how i use it? mostly logarithmic charts and i often use the regression channel tool, zoom out the chart timewise and look for trends. then i use lows or highs of the trend established and use it as starting point to draw the the channel with the regression tool getting the line of least resistance as middleline and the channel lines (2 stand deviations on both sides) and get nice results. I also adjust intuitively, sometimes using the projection channel tool where you can draw manually and getting channels with the fibolines. could you shed some light on your method, i really analyzing your channels since ever 🙂 where you do start? lows?highs? it doesn’t seem you following the classic approach of connecting the lows and then draw the whole channels, but similar as the regression method (but then again not :)) how much trend action do you need to start lying on a channel over a trend? what tool do you use? some kind of fibo channel tool or manually? logarithmic? Thanks a lot for the great work which inspires me for years. cheers Marc
Thanks for your comments, Marc. I channel pretty much everything, including taking a stab at what looks like it might become a trend. I love regression channels, but have been disappointed by them many times over the past several years as TPTB are always willing to connect minor lows to provide support when it might otherwise not be justified. Likewise, I’ve seen long-established log channels, with multiple tags top and bottom, break down only to have artihmetic channels take over when necessary to justify a rebound. As far as trend action, etc… I usually start with what appears to be a significant high/low and try to figure out where TPTB would like to take it (s significant Fib, intersection with another channel or TL, etc.) and see if there’s a channel that would fit the accumulated peaks and valleys. I experiment a lot, and try to remember that the guys running the “markets” and setting prices on a day to day basis prefer to do so in a way that doesn’t look like total BS. Often, it does anyway. But, they like to keep up appearances when possible :->
Looking at the way you draw the IHS (letter in yellow color), the right shoulder (at 2065.25) was never met. So, is it still IHS technically?
It’s a very lame looking IH&S. It would thoeretically be a lot stronger with a better developed right shoulder, but in the end the market is being manipulated higher. So, I’m not sure it matters.