Year: 2015

  • Update on COMP: Sep 15, 2015

    COMP has been one of those nonsensical indices that — just when you thought it was finished — always found a way to make new highs.  That was, of course, until August rolled around.

    It broke down through every element of support we discussed in our last update: the rising wedge, the red TL, the 2007 high, and even the .886.  Most importantly, the red channel which has guided its incessant rise since 2009 finally gave up the ghost.

    continued for members(more…)

  • Plenty of Shadow

    haru groundhogAccording to folklore, if a groundhog emerges from its burrow then a spring thaw will come early.  If, instead, it sees its shadow, it’s scared back into its burrow and winter will continue for another six weeks.

    Yen Carry TradeHaruhiko, the carry trade groundhog, poked his head out of his burrow last night, saw the strikingly bright light of futile, failed policy, and quickly withdrew.  There will be no more QQE (at this time) to thaw the market’s recent freeze.

    Although the yen can and has been heavily manipulated without QQE expansion, it’s been a key component of the carry trade since 2011.

    USDJPY traded as low as 119.39 before the intervention arrived, boosting ES by 6-7 points in the hour after dismal retail sales and Empire Mfg numbers raised “bad news is good news” hopes that the Fed won’t also disappoint.

    Screen Shot 2015-09-15 at 6.06.27 AMBut, the bottom line is that it’s now up to the FOMC to prevent an extended winter for stocks.

    continued for members(more…)

  • Update on RUT: Sep 14, 2015

    RUT overshot the large white channel top for most of the past year, dropping back below it in late August when the rest of the “markets” took a pause.  Note, however, that the yellow channel top never was exceeded.2015-09-14 RUT big weekly 2000

    As we noted at the time, the smaller white acceleration channel broke down.  But, RUT climbed alongside its belly rather than react as indices normally would.

    2015-09-14 RUT weekly 2000The late-August plunge changed things.

    continued for members(more…)

  • Update on Natural Gas: Sep 14, 2015

    NG recently completed a large Bat Pattern (though it came up a bit shy of our actual target: 2.443 vs 2.425.) That pattern completion is normally good for a bounce to at least the .618 Fib, which is at 3.656.2015-09-14 NG daily 2000But, like CL, NG is being artificially suppressed in order to facilitate a cheaper yen.  When it comes to Japan, it remains to be seen whether central bankers can handle that kind of inflationary pressure.

    If, instead, they wish to manipulate it lower, the white channel bottom down around 2.00 would make a nice downside target.  Note the strong channel support from 1999 in the long-term chart below.2015-09-14 NG weekly 2000


  • Charts I’m Watching: Sep 14, 2015

    The next few couple of days should betray little until the BoJ and FOMC announce their intentions.  The USDJPY is wedged in between the SMA200 and the .618 Fib at 120.11, ready to sprint in either direction.

    2015-09-14 USDJPY daily 0605Other key metrics are equally non-committal.

    continued for members(more…)

  • Update on the DJIA: Sep 13, 2015

    Most charting purists hate the Dow.  Not only is its price level manipulated like all the other indices, but any time it’s not performing up to par, they replace the dogs with Wall Street darlings.  The data, therefore, is suspect from the start.

    What really turns my stomach, however, is how this sewer rat of an index crapped all over three very solid and reliable chart patterns that should have resulted in a serious downturn in December 2013.

    The megaphone, channel and Fibonacci patterns visible below all pointed to a plunge at 16,300.  And, by plunge, we’re talking a reversal from the 1.272 extension at 16,300 to at least the former high at 14,198 — a 12.9% drop.2015-09-10 DJI megaphone + chnlInstead, TPTB used the cover of low-volume holiday weekends to push DJI up through that significant resistance, resulting in a 12.5% gain over the next 18 months.  Between what shoulda’ happened and what did, it was a 25% swing.

    There was a moment on October 15, 2014 when DJI momentarily dipped back below the 1.272, but Fed President BullarD grabbed the nearest microphone and waxed enthusiastically about QE4, thus erasing any thoughts the index had of adhering to charting protocol.

    The 15.75% rally over the next 7 months was pretty spectacular.  The bulls seemed invincible.  Then August 2015 rolled around and, suddenly, things looked dicey again:

    √   back below 1.272 extension
    √   back below megaphone upper bound
    √   back below channel top

    continued for members(more…)

  • Charts I’m Watching: Sep 11, 2015

    Yesterday’s SPX action hit our upside target (1963) and subsequent downside target (1945), with SPX essentially continuing in a pre-Fed/BoJ triangle.   Today, we should see that triangle break down.

    continued for members(more…)

  • Update on the Nikkei: Sep 10, 2015

    In our last update on the Nikkei [see: Update on NKD, Aug 12] we slapped a target at 19,240 — a very obvious H&S Pattern neckline.  At the time, it seemed imminent, as the chart from that post shows:2015-08-12 NKD daily 1211am NKD held on for another week before reaching our target.  But, by then, more selling pressure had built up.  When it was finally released on Aug 24, it resulted in as spectacular a decline as NKD has seen in years.

    The result was a drop straight to our target… give or take 2,000 points.  It’s true.  NKD blew through the neckline and dropped all the way to 17,240.  Total losses over those two weeks: 18%.  2015-09-10 NKD daily 1300The bounce back was also pretty dramatic.  But, so far, it has failed to break out.  There’s a reason; and, there’s a reason why investors should be concerned.

    continued for members(more…)

  • BoJ Keeps Markets Guessing

    SPX closed yesterday at exactly the bottom of its rising channels — this after a dramatic reversal at the upside target we forecast earlier in the morning:

    SPX looks likely to reach the purple .886 at 1983.17 — also the bottom of the original falling gray channel.

    2015-09-10 SPX 60 0551The talking heads offered many explanations.  But, as usual, they left out the most important: the yen carry trade.

    USDJPY had surged past the key .618 Fib at 120.11 and even topped the SMA200, with SPX tagging along behind, wagging its tail.  When USDJPY faltered and dipped back below the SMA200, however, the rally quickly came undone — just like it did early this morning.  Equity markets are not amused.2015-09-10 USDJPY v ES 60 0548 continued for members(more…)

  • Update on USDJPY: Sep 10, 2015

    While I present updated USDJPY charts in every daily post, it’s been a while since we took a view from 30,000 feet.  Stripping away all the expectations associated with our analog, USDJPY has finally settled into some fairly straightforward patterns.

    The big picture shows several very significant features.  First, the drop from 1998 followed a fairly well-formed channel that was interrupted in October 2011 by a massive QQE expansion.  The subsequent yen devaluation (USDJPY increase) sent the pair screaming higher where it barely reacted at the yellow .382 or the red .500 — not even dropping to the next lower Fib level.

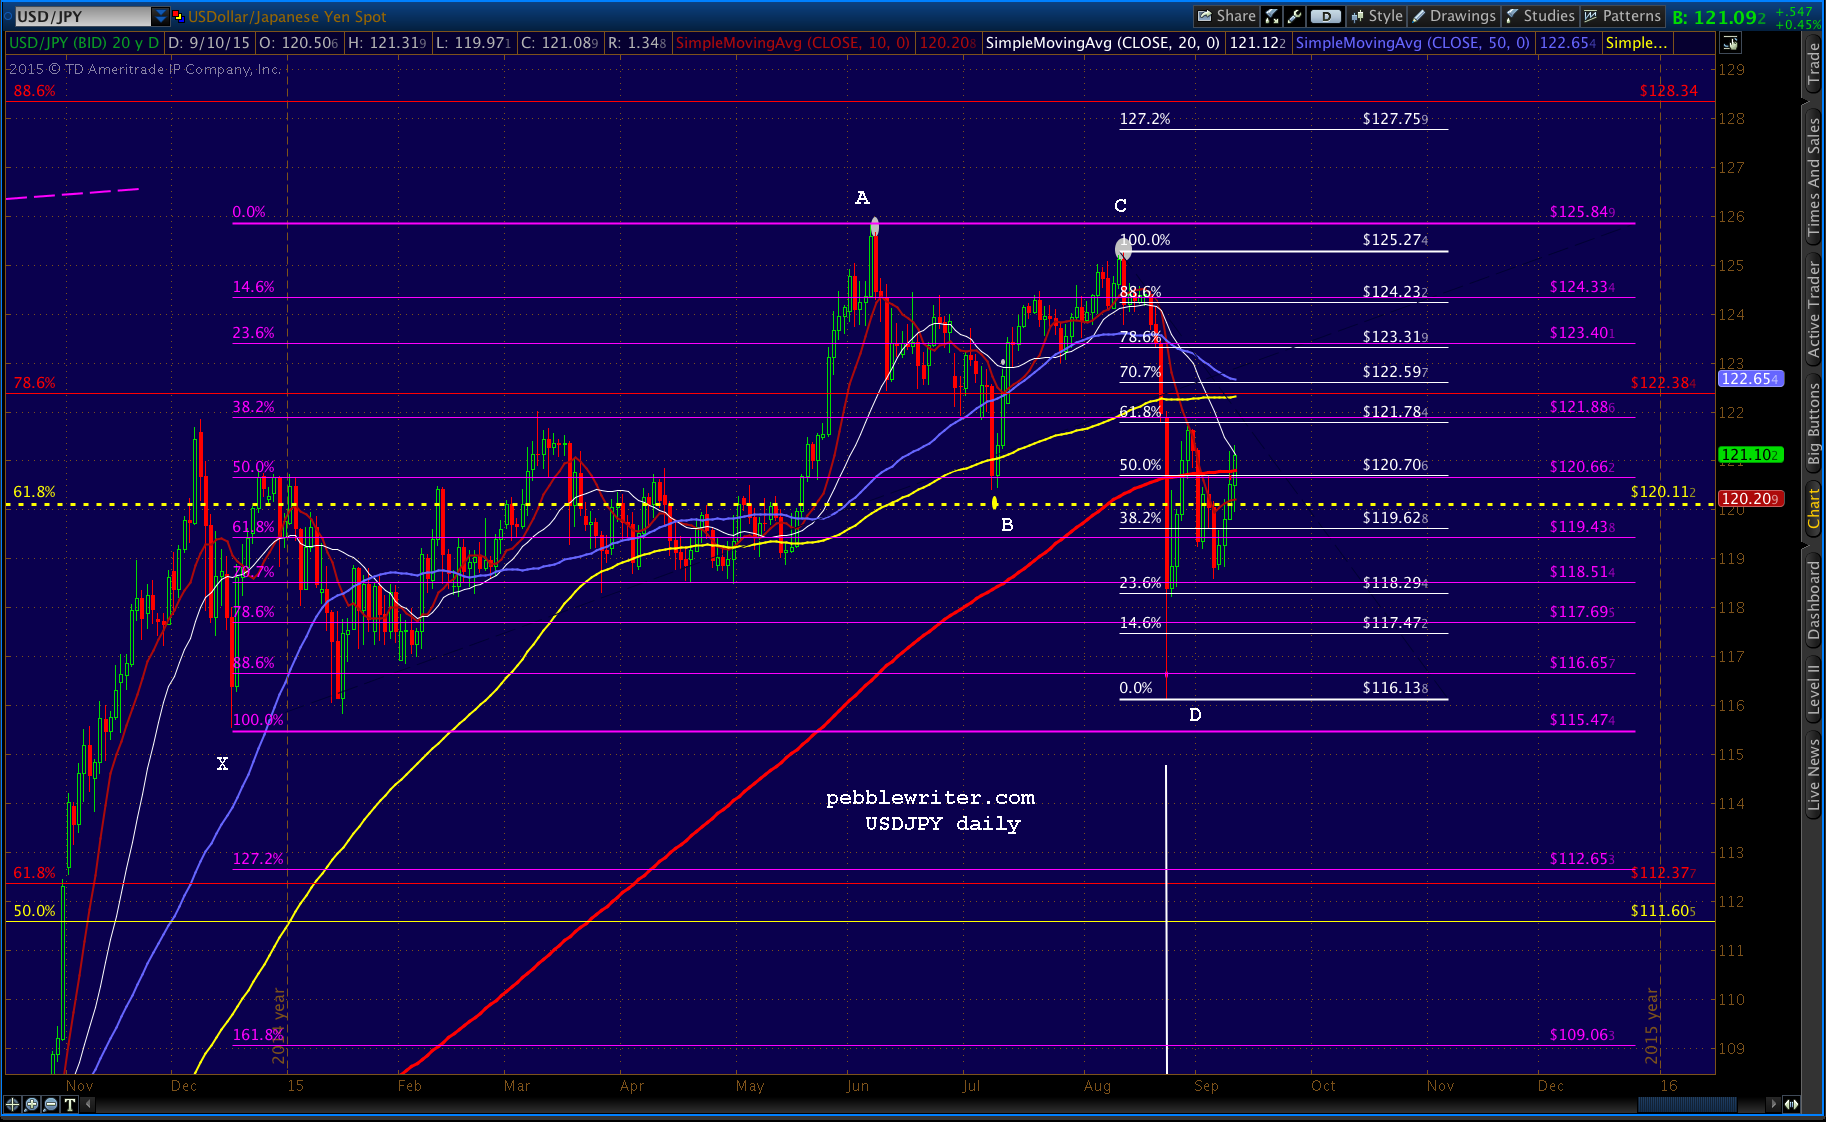
    Another QQE expansion sent it spiking out of the huge channel and up to the yellow .618 at 120.11 where it was quite overdue for a retracement.  However, since the pair is carefully managed by the BoJ, and any decline is instantly translated into falling equity prices (thanks to the yen carry trade), it was, again, not really permitted to react.2015-09-10 USDJPY big harmonic 0300It would occasionally drift lower, but as soon as equities started sagging it was immediately brought right back up to that key Fib level.  Finally, this past May, it broke out.  But, it ran into the rising purple channel that broke down back in 2008.

    This backtest has proven problematic for USDJPY’s continued upside, as has the BoJ’s pause in announcing additional QQE.  USDJPY dropped back down and backtested the .618 (well, almost…stocks had a hissy fit) before zipping back up to retrace .886 of that particular drop on Aug 12.

    That’s when the wheels almost came off the bus.  USDJPY had completed a large IH&S Pattern, and was surely headed higher.  But, it didn’t.  China and nearly all of SE Asia was in trouble, and all that hot money was flooding back into and strengthening the yen (weakening USDJPY.)2015-09-10 USDJPY CU 0300The next two weeks’ denouement was abrupt.  The impact it had on stocks was equally dramatic.  SPX, shown above in purple, fell 238 points (11.3%.)

    However, the central bankers were able to stem the tide, holding USDJPY to a Bat Pattern, with the final thrust (D) only slightly exceeding the purple .886 Fib.  When all was said and done, USDJPY’s daily range on Aug 24 was 5.87 — the largest ever since the 2010 mini-crash.

    2015-09-10 USDJPY daily Bat 0300Every Bat Pattern has the potential to morph into a Crab Pattern.  And, this one is no different.  But, the primary channel that has set up over the past 10 months doesn’t really support the idea.

    It’s not a great channel.  It suffers from many abnormalities — not the least of which was the Aug 24 plunge that momentarily busted it.  But, it does an excellent job of demonstrating what TPTB wanted and needed: a gently sloping uptrend that keeps the yen carry trade alive without requiring additional yen devaluation.

    2015-09-10 USDJPY daily chnl 0300Putting it all together, we get a picture of a tightly-controlled experiment that came very close to a very messy implosion.  In the 2-1/2 weeks since Aug 24, however, central bankers have done a pretty good job of glossing over the economic turmoil underlying global equity valuations.

    But, they haven’t yet answered the most important questions:  will they further expand quantitative easing?  And, regardless of whether there’s additional easing, will they continue to devalue the yen?

    I’ve analyzed this and speculated on the ultimate outcome ever since releasing our USDJPy analog on March 27.  In my opinion, they have no choice [see: An Offer Japan Can’t Refuse.]

    continued for members(more…)