When the S&P 500 finally finished crashing in March 2009 (at the number of the beast, no less), most investors were still in shock. Very few could know that the crash was over. But, they cheered the bounce anyway, not realizing that the intervention that had “saved” the market was actually a deal with the devil.
From the vantage point of six years later, the devil has certainly delivered. After crashing 57%, SPX has rebounded by a whopping 221%. Even those who rode out the plunge from 1576 to 666 are still up a respectable 35% (they’ll be the first to point out the value of long-term investing — the buy-and-hold strategy!)
Those who study Harmonics, however, would point out that the bounce at 666 established a very specific roadmap that has proven to be exceptionally accurate. It has provided buy-and-hold investors with golden opportunities to protect their gains and traders with platinum opportunities to play both sides of the market. It also suggests a major top in the next few days.
 For those not familiar with the term, Harmonics is simply the application of Fibonacci ratios to market prices. [An overview of Fibonacci numbers and the various derivations and patterns can be found HERE.] The Golden Ratio (1.618, based on the Fibonacci sequence) is commonly manifested in nature in everything from the spiral structure of sunflowers and galaxies to the resonance of spins in cobalt niobate crystals.
Astrophysicist Mario Livio, who wrote the book on the Golden Ratio (The Golden Ratio: The Story of Phi, the World’s Most Astonishing Number, available at Amazon) tells of mankind’s fascination with it:
Some of the greatest mathematical minds of all ages, from Pythagoras and Euclid in ancient Greece, through the medieval Italian mathematician Leonardo of Pisa and the Renaissance astronomer Johannes Kepler, to present-day scientific figures such as Oxford physicist Roger Penrose, have spent endless hours over this simple ratio and its properties.
In Harmonics — a study of stock price movements associated with technical analysis — the Golden Ratio and its derivations (.146, .236, .382, .618, .707, .786, .886, 1.00, 1.272, etc.) are used to identify turning points. A chart of SPX since 2007 illustrates how incredibly accurate Harmonics have been (technical analysis doubters have trouble with this chart.)
The first major reversal came at 1217, only 11 points from the .618 Fibonacci level. This represented a retracement of 61.8% of the losses from 1576 to 666. From there, SPX dropped 17% to within 4 points of another key Fib — the .382 at 1014.
 The .618 Fib — the inverse of the Golden Ratio (1 / 1.618.) — is an important Fib level. Stocks (and indices) tend to move in waves, stair-stepping their way higher or lower rather than continuing in a straight line. And, the .618 is a very common retracement for such interim reversals — whether or not a larger trend remains intact. Just as importantly, it’s usually followed by an even larger move.
A very smart fellow named H.M. Gartley noticed this phenomenon and christened it the Gartley Pattern in his 1935 book Profits in the Stock Market. Scott Carney and others later applied Fibonacci ratios to these reversals, pointing out that an initial .618 reversal tended to produce a subsequent move to the .786 Fib. This in turn, yielded other Harmonic patterns such as the Bat, the Butterfly* and the Crab.
On May 2, 2011, I wrote my first pebblewriter.com post [see: Collision Looming?] which pointed out that SPX was completing a Gartley Pattern (11 points away) at the same time as it was completing a rising wedge and approaching a 20-year old line of resistance. I suggested the market was due for a significant decline.
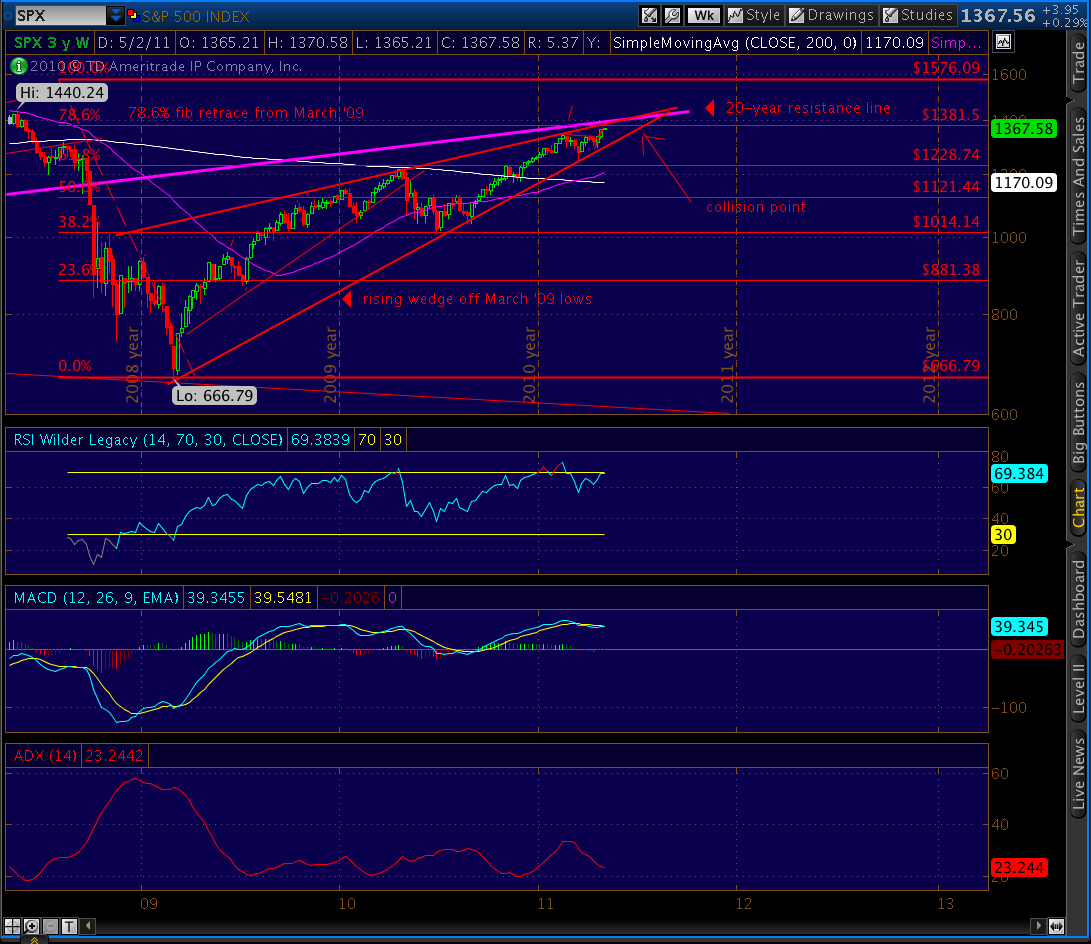
Fate was smiling on us that day. May 2 turned out to be the high, yielding a 22% plunge over the next five months — the bulk of it coming in three incredibly profitable weeks that was perfectly forecast by an analog we had developed, but that’s another story [see: Analogs for more.] It would take the better part of a year for SPX to reach 1370 again.
Harmonics would deliver nice profits many more times over the ensuing years. On September 14, 2012, for instance, SPX completed a Bat Pattern at the .886 Fib at 1474 [see: The World According to Ben.] We suggested a short position and were promptly rewarded with a 9% decline.
While a nice trade, it was less than expected — retracing only 61.8% of the previous leg up for the third time in a row since 2011’s plunge (which reached just beyond the .786 Fib.)
We had wondered at the time whether this reversal would be very dramatic. From that post:
Not all Bats mark huge reversals. Since we could put in a Point B at the .618 retracement, there’s the possibility we’re constructing a Crab Pattern* that ultimately targets the 1.618 at 2138.
Actually, it’s a wonder that it happened at all.
 The day before, the FOMC had announced an increase in quantitative easing: QE3. The proximity of the two events was an eye opener for many technically-oriented analysts. Even back then, it was becoming widely accepted that quantitative easing played an important role in boosting stock prices.
Could it be just a coincidence that the Fed announced a major, market-boosting operation within 24 hours of the S&P 500 running into potentially heavy overhead resistance?
It wasn’t the first time. And, it certainly wasn’t the last. Since the downturn from 1474 was prematurely interrupted, central banks have repeatedly announced easing operations and made dovish comments that either enabled SPX to leapfrog significant overhead resistance or cut short a plunge.
Some of the more significant ones are shown below. Without them, SPX would most certainly have had trouble clearing the previous high at 1576, surpassing the 1.272 Fib at 1823, bouncing back from the October 2014 plunge, and…of course…getting to where it is today.
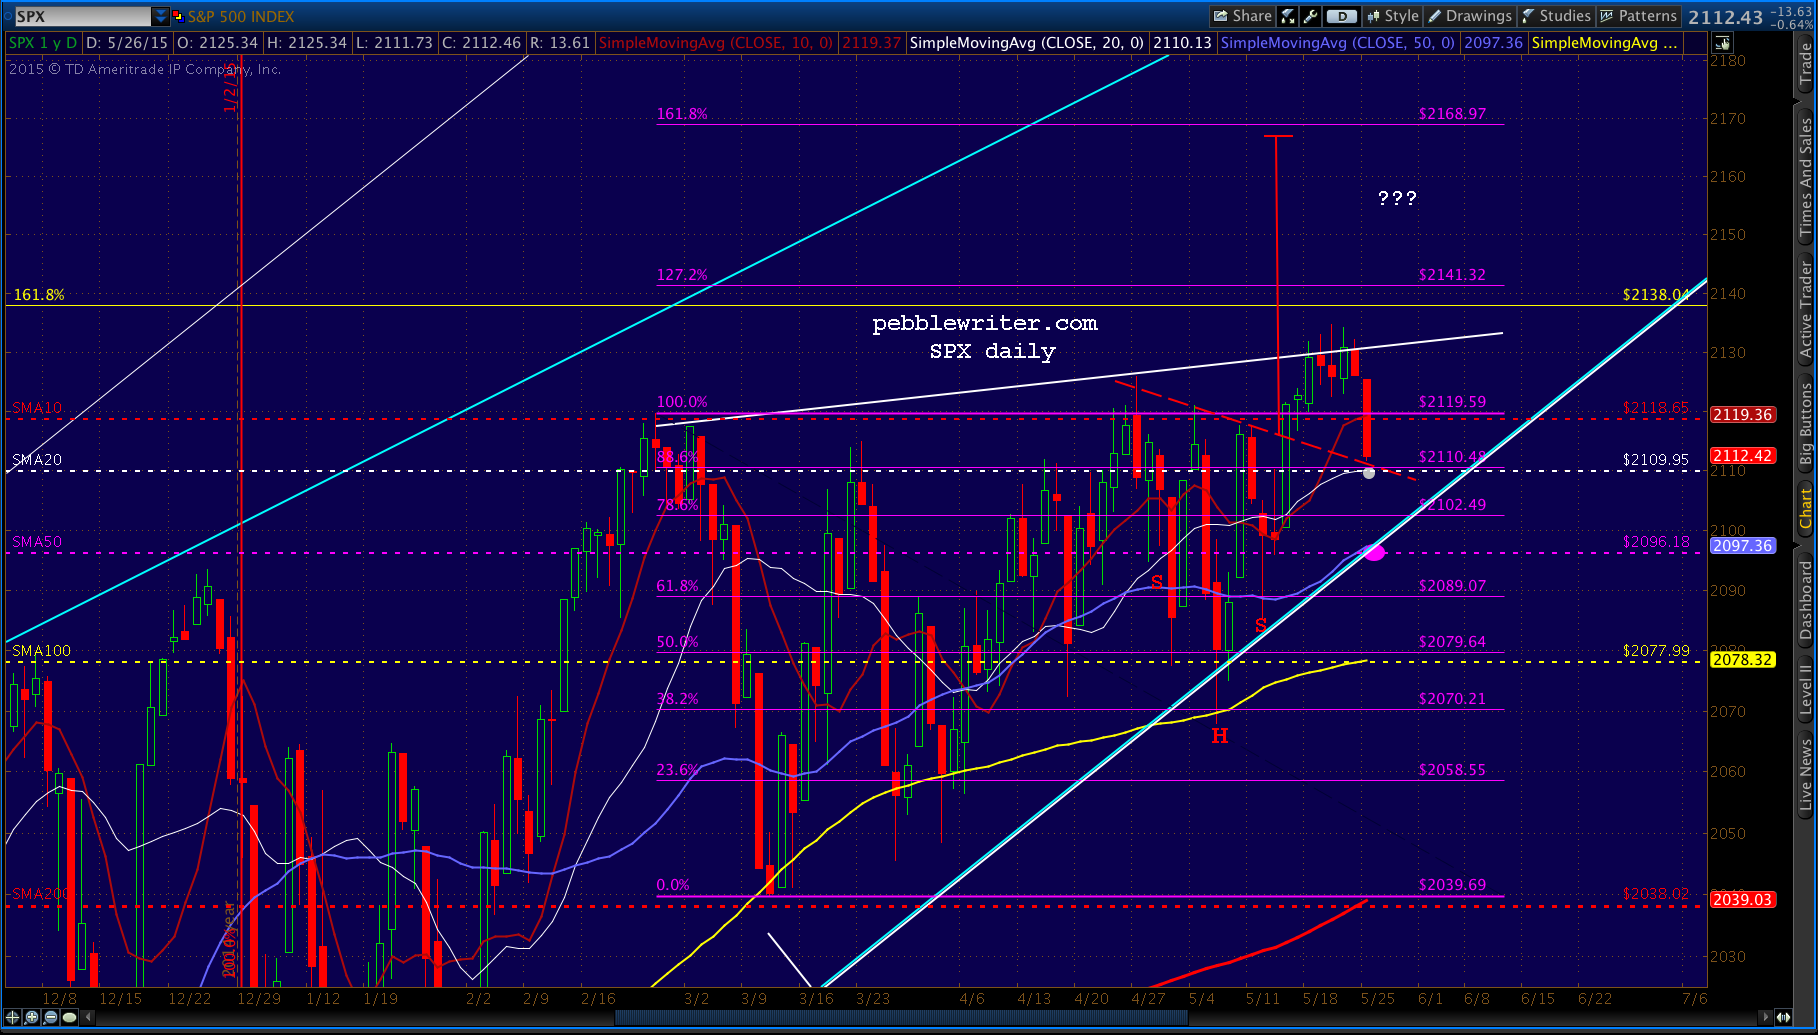
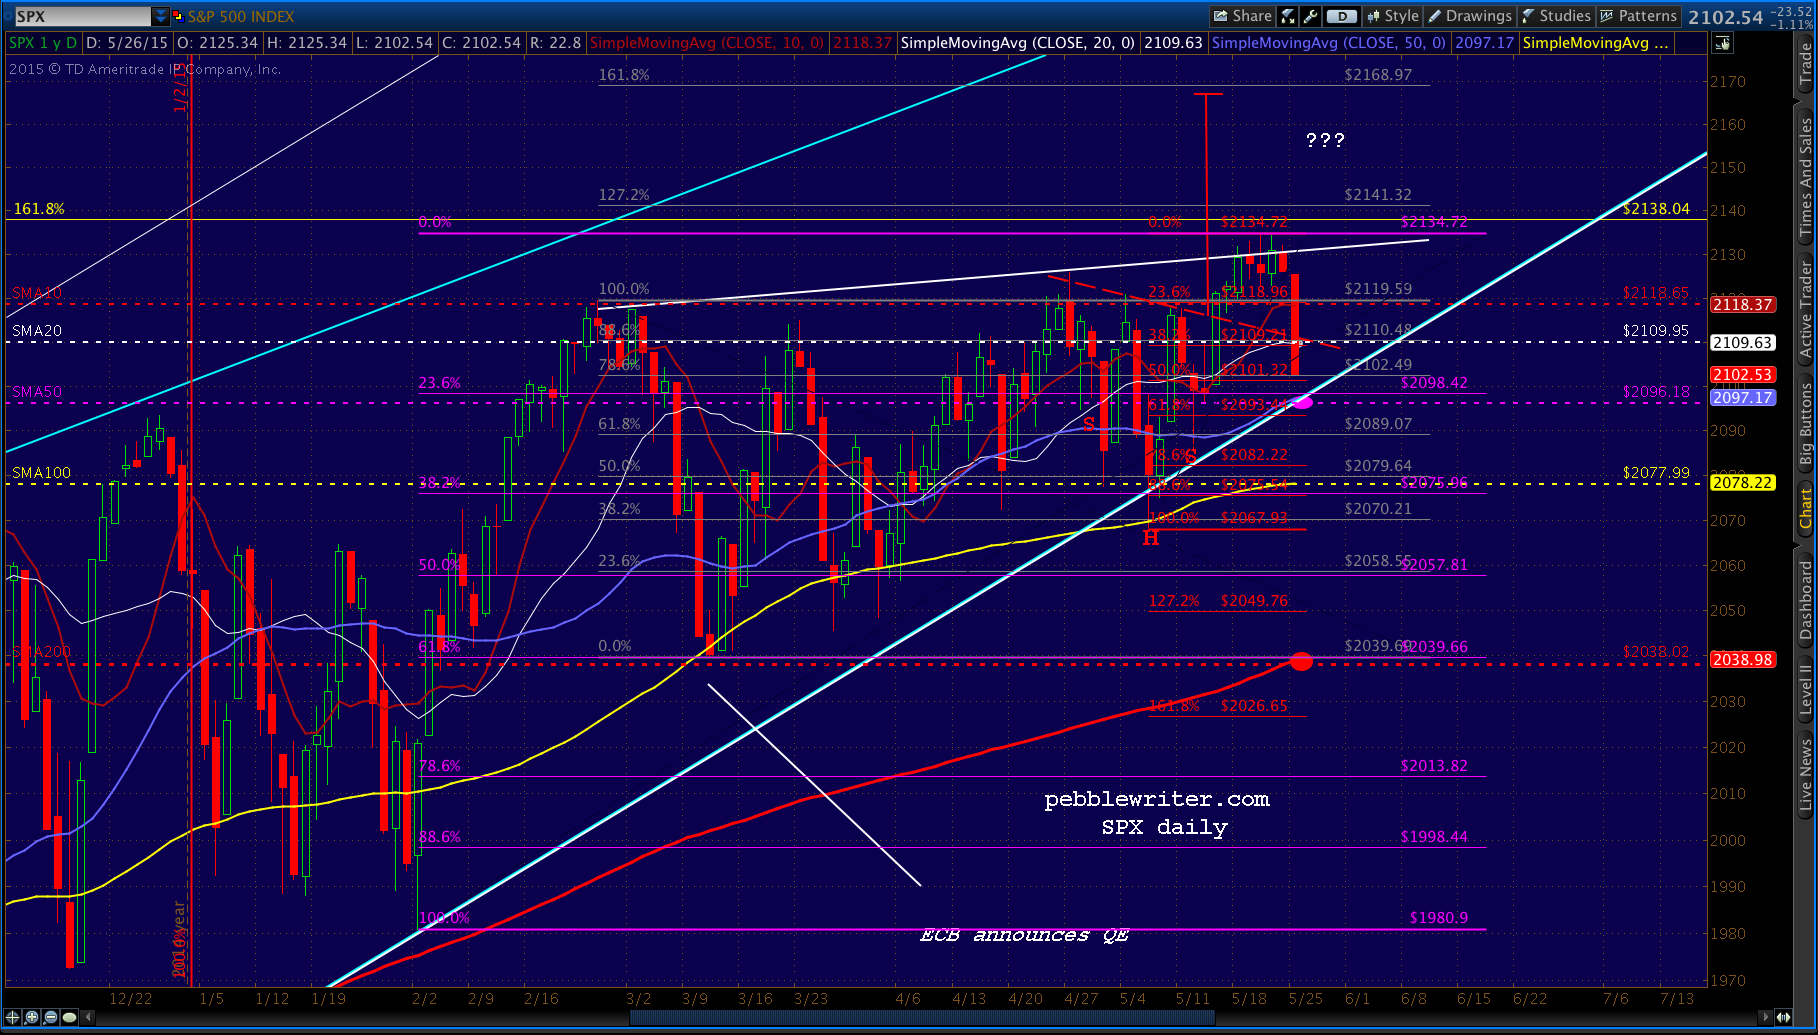
 And, it’s today that we’re concerned with. Because, SPX has come within a few points of the most important Fib level that this Harmonic pattern that began way back in 2007 will see for a long, long time: the 1.618 Fib extension. The actual Golden Ratio itself. The Big Butterfly Pattern.
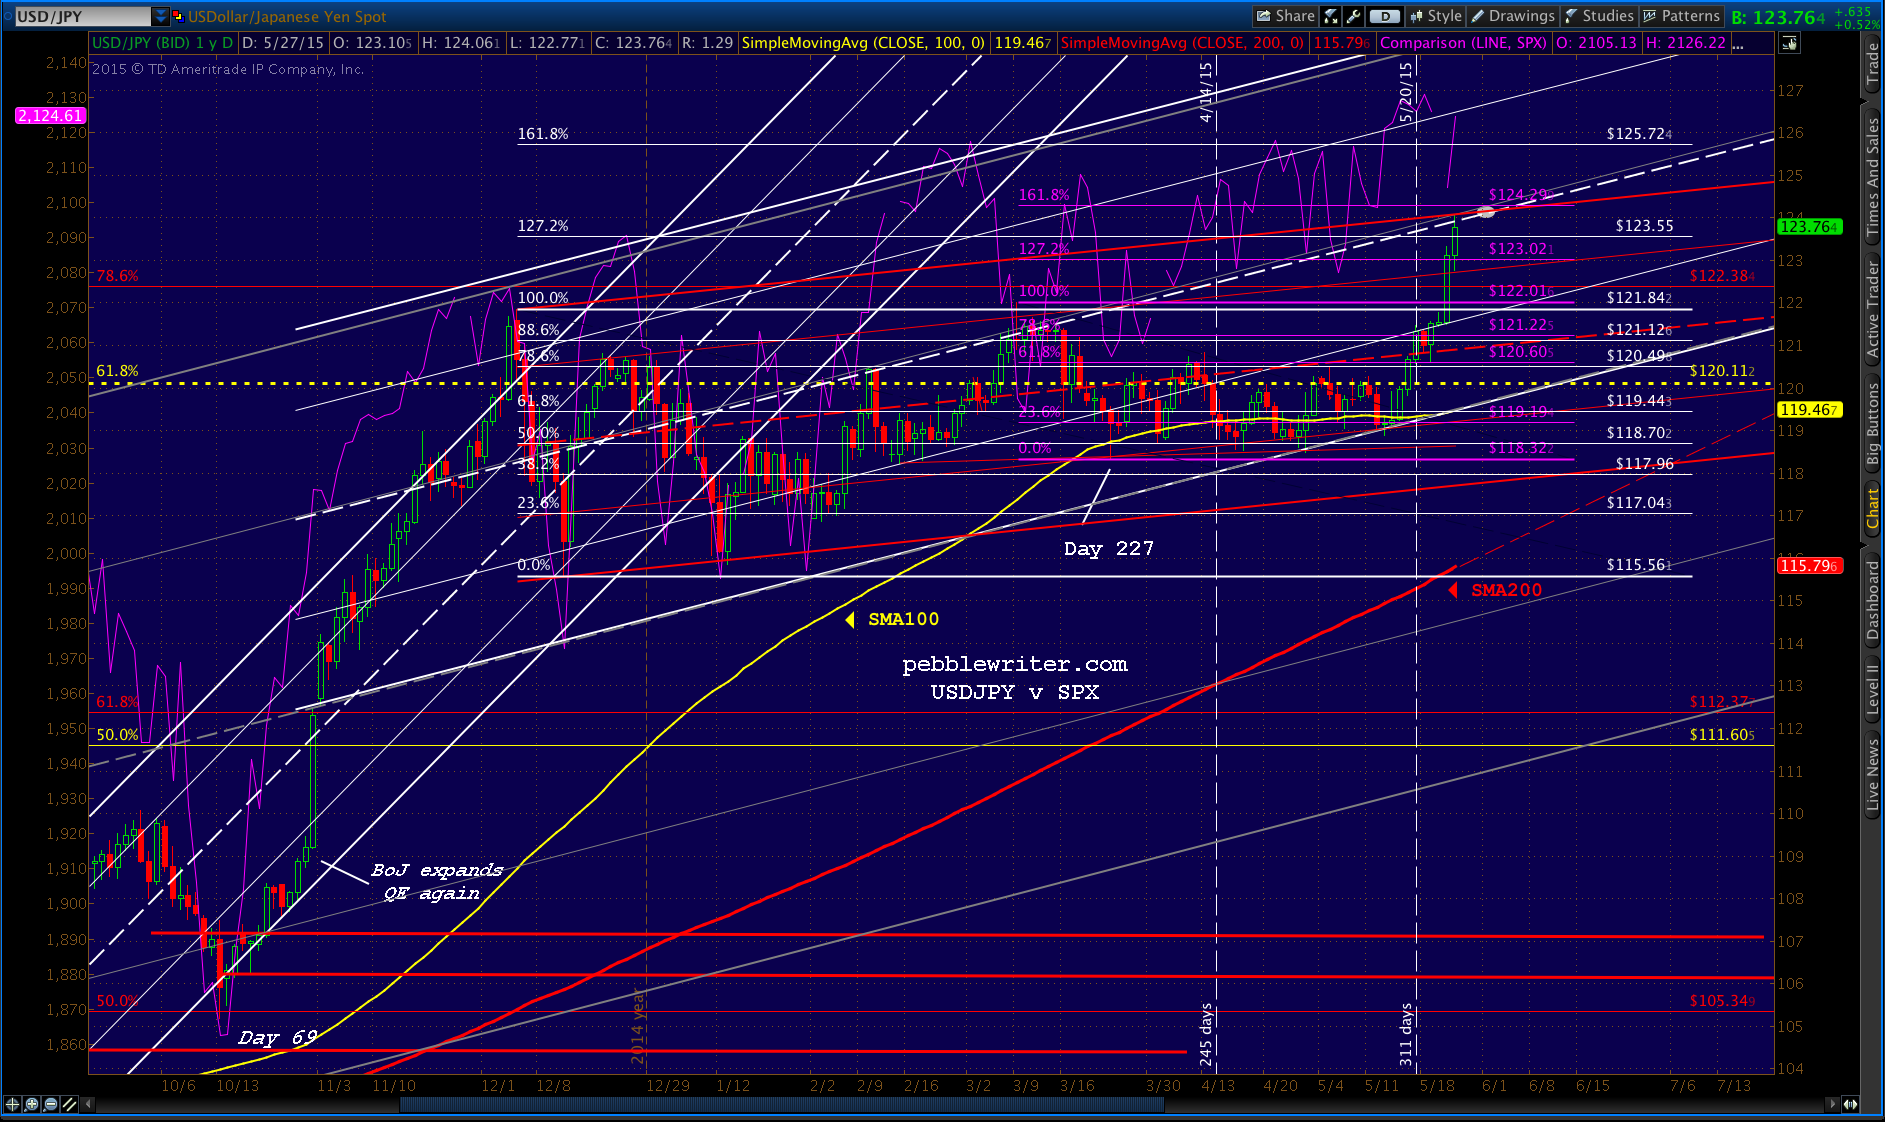
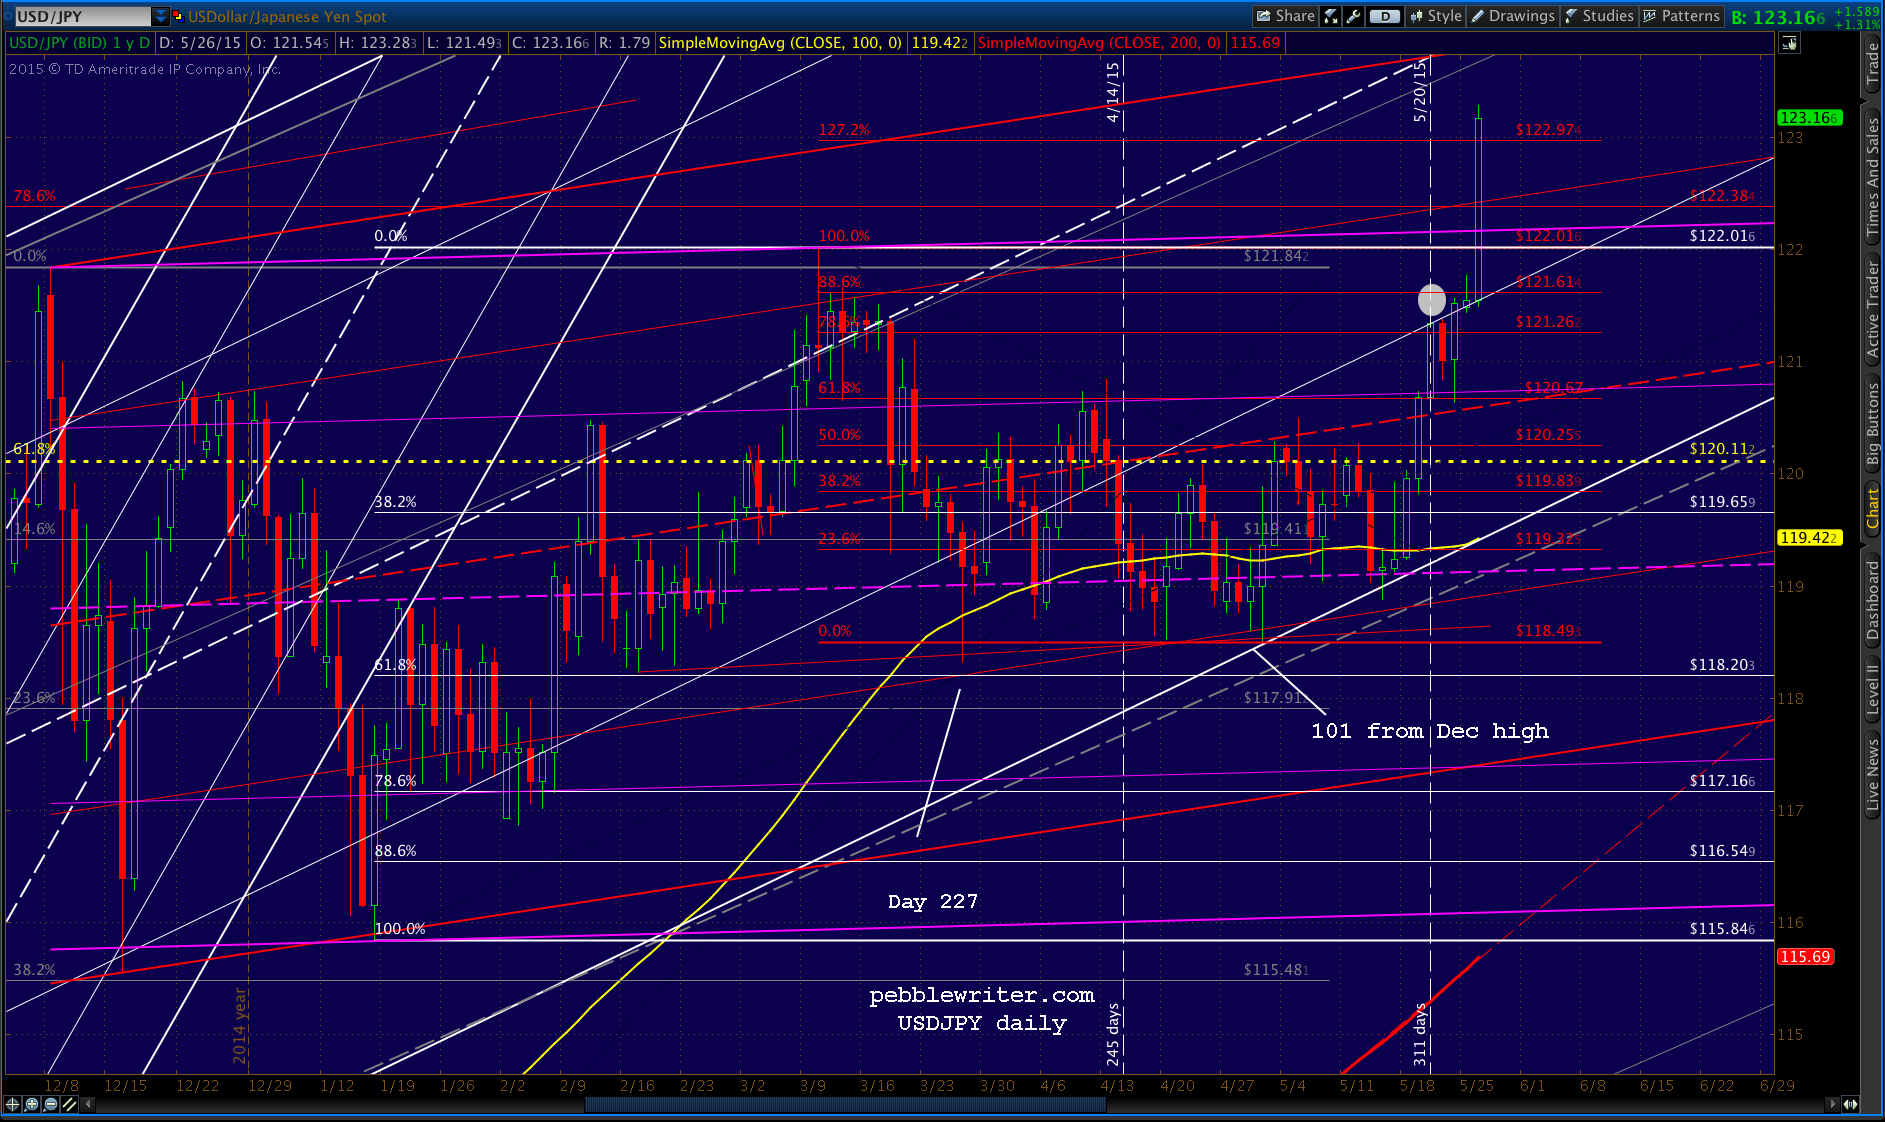
In an unrigged market, I would be putting every single dime I own into highly leveraged bets that the “market” would sell off significantly. But, as the charts above and below clearly show, this market is anything but unrigged. Currency manipulation (which has enabled an unending yen carry trade) and unceasing central bank interventions have been entirely responsible for the “market’s” climb to present levels.
 From: The Yen Carry Trade Explained (Why the Rally Won’t Die) posted April 10, 2015.
Is there any chance in hell that the world’s central banks and their Wall Street (and, Chicago) accomplices would permit the enormous sell-off that a Butterfly Pattern would normally produce? A typical response would be to the .886 at 1472, .786 at 1381 or .618 at 1228. Even the closest Fib level is 1823 — a 14.7% drop.
That would represent a $340 billion loss in market cap for the S&P 500 companies alone ($1.2 trillion including assets benchmarked to the index.) Applied to global stocks, it would equate to almost $11 trillion in vaporized wealth.
Might that create a slightly larger dip in macroeconomic conditions, Mr Keynes? From a recent Zerohedge post:

I started this post at 5:30 this morning by referencing a “deal with the devil.” My hunch is that it’s an expression heard often in the halls of the Eccles Building and its equivalents around the world. While initially thrilled to have averted a global economic collapse, central bankers are no doubt aware that they’ve painted themselves into a corner.
The deal didn’t provide a cure for the massive financial bubble that burst in 2007. It reinflated it — without mitigating one iota of the risk.
Financial assets have appreciated to the point where just about everything is priced at all-time highs or is, at the very least, overbought. From farmland to Ferraris, rental properties to Rothkos, Baht to Bunds. If a broker is peddling it somewhere out there, chances are it’s very, very expensive.
Anything priced in yen is also expensive. The Japanese people were thrown under the bus a long time ago when TPTB realized that monkey-hammering the yen lower and lower was a sure-fire way to drive “markets” higher.
What’s not expensive? Basic commodities. The stuff that real businesses use to make and sell real stuff that real people need and can afford. People are cheap, too. The government employment figures (all of them) are garbage. Even perennial cheerleader CNBC admits that the long-term unemployed are essentially out of luck.
Most shocking of all, the cost of protection from failure is cheaper than ever. There are over $1.5 quadrillion in derivatives bouncing around the world — twice what the tally was in 2007. Most of it is not marked to the market and much of it is neither regulated nor tracked. That’s $1,500,000,000,000 — about 20X global GDP and over $200,000 per living human on God’s green earth. If the wrong thread should happen to be pulled, just imagine the horrific unraveling…
A recent McKinsey report illustrates that while debt as a percentage of GDP continues to expand…
 …credit default swap rates are back down to pre-crisis levels.
 The smartest guys in the room have been working on these problems for years. They know it’s out of control. They know there is no such thing as a painless cure. And, they know how important it is to… retire to the lecture circuit so the next guy gets all the blame! Honestly, there’s no upside in pointing out that the emperor’s clothes are about to burst into flames.
For proof, look no further than the FOMC minutes released today. Buried on page 8 is the language the algos were looking for:
Many participants, however, thought it unlikely that the data available in June would provide sufficient confirmation that the conditions for raising the target range for the federal funds rate had been satisfied…
In other words, no increase in interest rates. Easy money for the foreseeable future. In case that’s not clear enough, Fisher and Yellen speak tomorrow and Friday respectively. And, should the Butterfly Pattern exert itself anyway, Monday is a “market” holiday. The HFTs and spoofers handling the central banks’ trading know how to handle sell-offs — especially when there’s no volume to speak of.
It’ll keep working forever. At least that’s what we’re supposed to believe. But, of course, we know better. Central bankers have painted themselves into a corner. While they’re done an excellent job of glossing over the symptoms of a sick and ailing market (falling interest rates, poor breadth, etc.) we shouldn’t ignore the expanding underlying risk. I would be very, very cautious about making any bullish bets at this point.
If they break through 2138, fine. I’ll eat my words. But, I’m officially bearish from this point forward until they’ve proven they have the ability and the willingness to further inflate the “markets.”
* * * * *
Lest I leave you feeling completely hopeless, know that there’s a certain pattern to these things. In recent posts, we’ve discussed extensively the analog currently playing out. It suggests that while very rocky times lie just ahead, the game is sufficiently rigged to prevent a 2003 or 2008 or even 2011 style melt-down.
For more details, see A New Analog originally posted March 27, and the most recent update posted yesterday. We’ll continue to update things as they evolve.
For daily commentary, speculation and ranting on the vagaries of the “markets,” consider becoming a member of pebblewriter.com.
* * * * *
* Some have referred to this harmonic pattern as a Crab. While Crabs typically point to a reversal at the 1.618 extension, they require a Point B at or below the .618 Fib level. This one could have been a Crab but for the fact that the reversal at the .786 was even bigger than the one at the .618. Hence, the best Point B was at the .786, and the resulting pattern is a Butterfly — which can extend to the 1.272 or the 1.618.


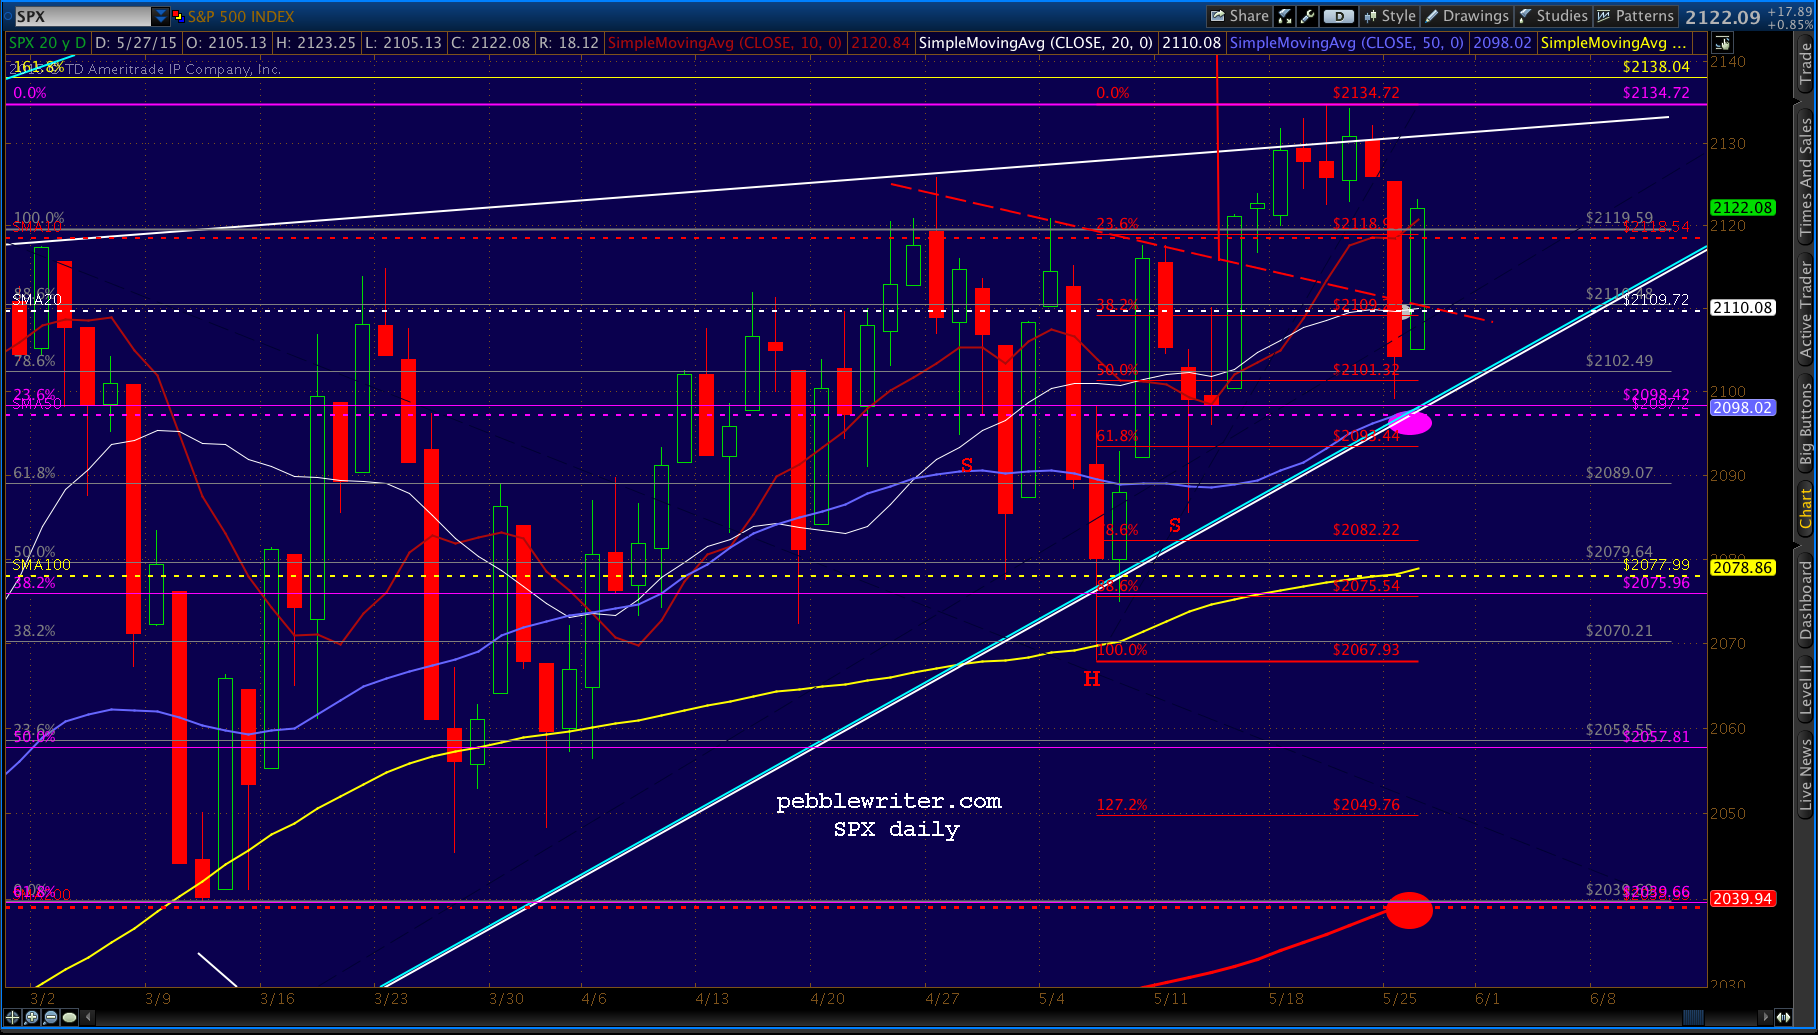
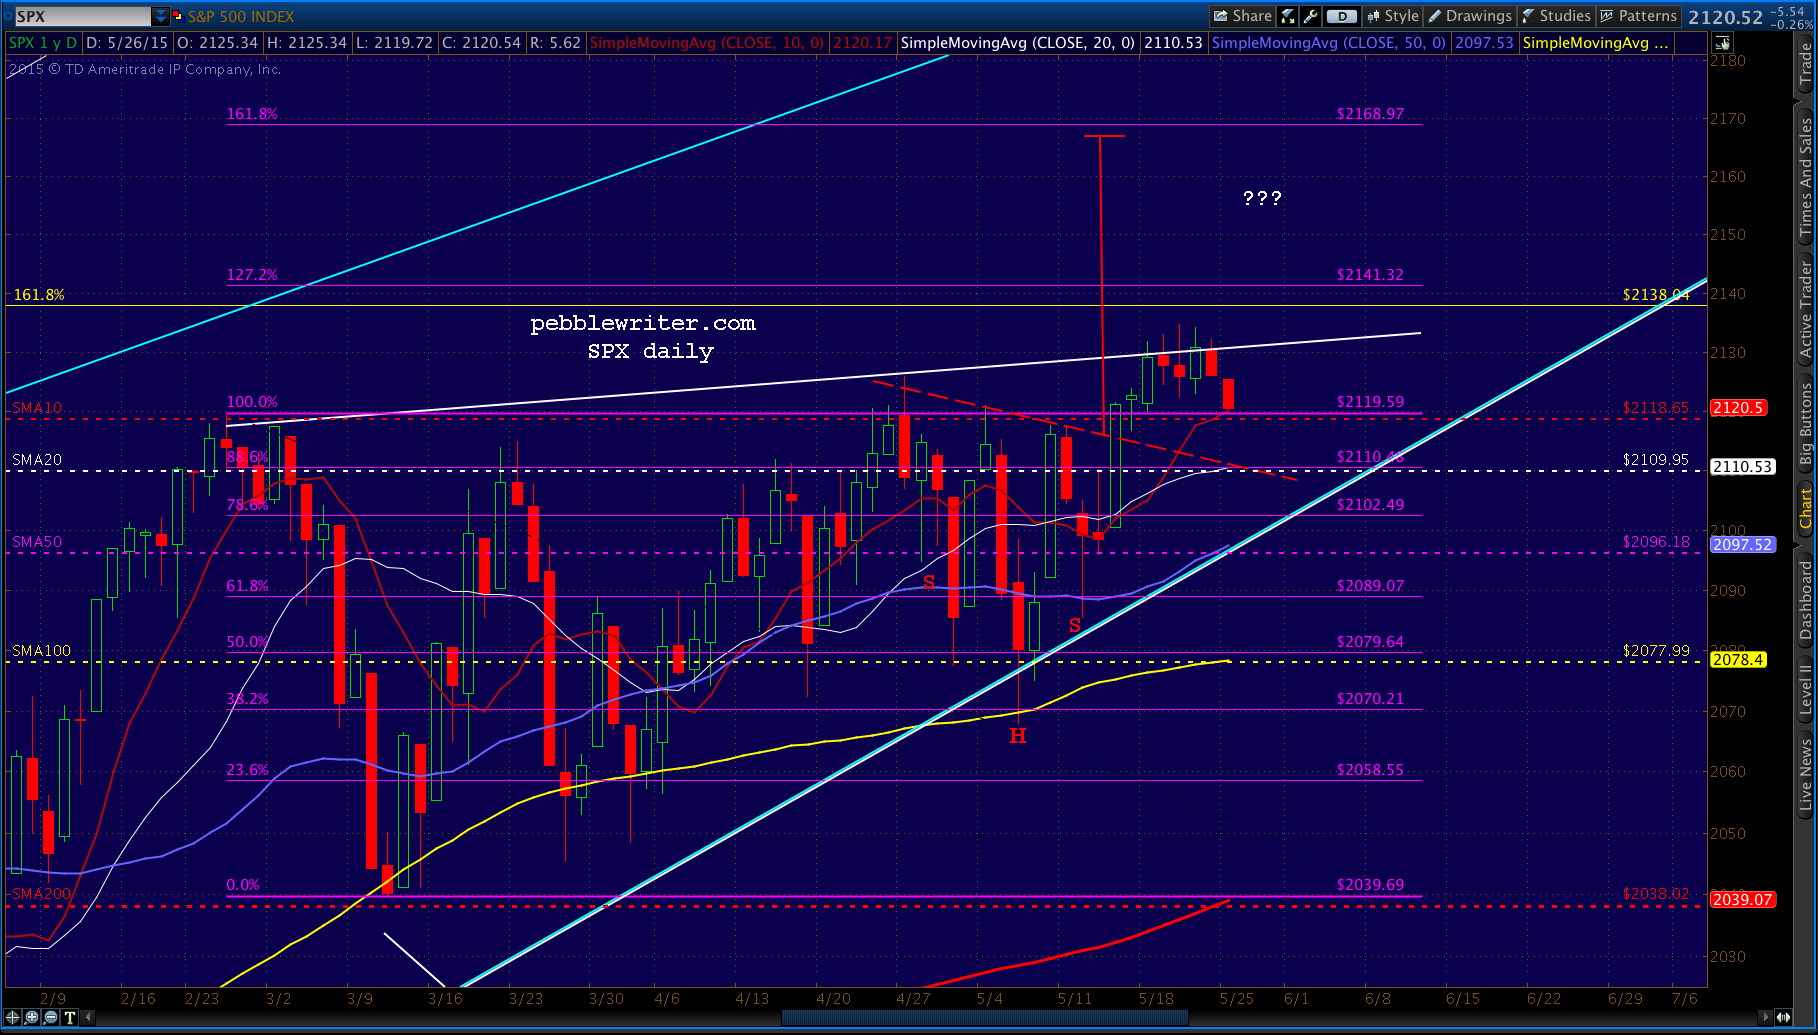
 This nearly 4% bounce off its lows provided all the ammunition SPX needed to abort a full backtest of the IH&S neckline and SMA20 and nearly close in the green.
 It was a near repeat of Tuesday’s plunge which also came up short. The eminis are currently off 4 points, but were down as much as 10 points overnight before the euronext “broke” — which is code for “let’s turn this puppy around, but fast!”
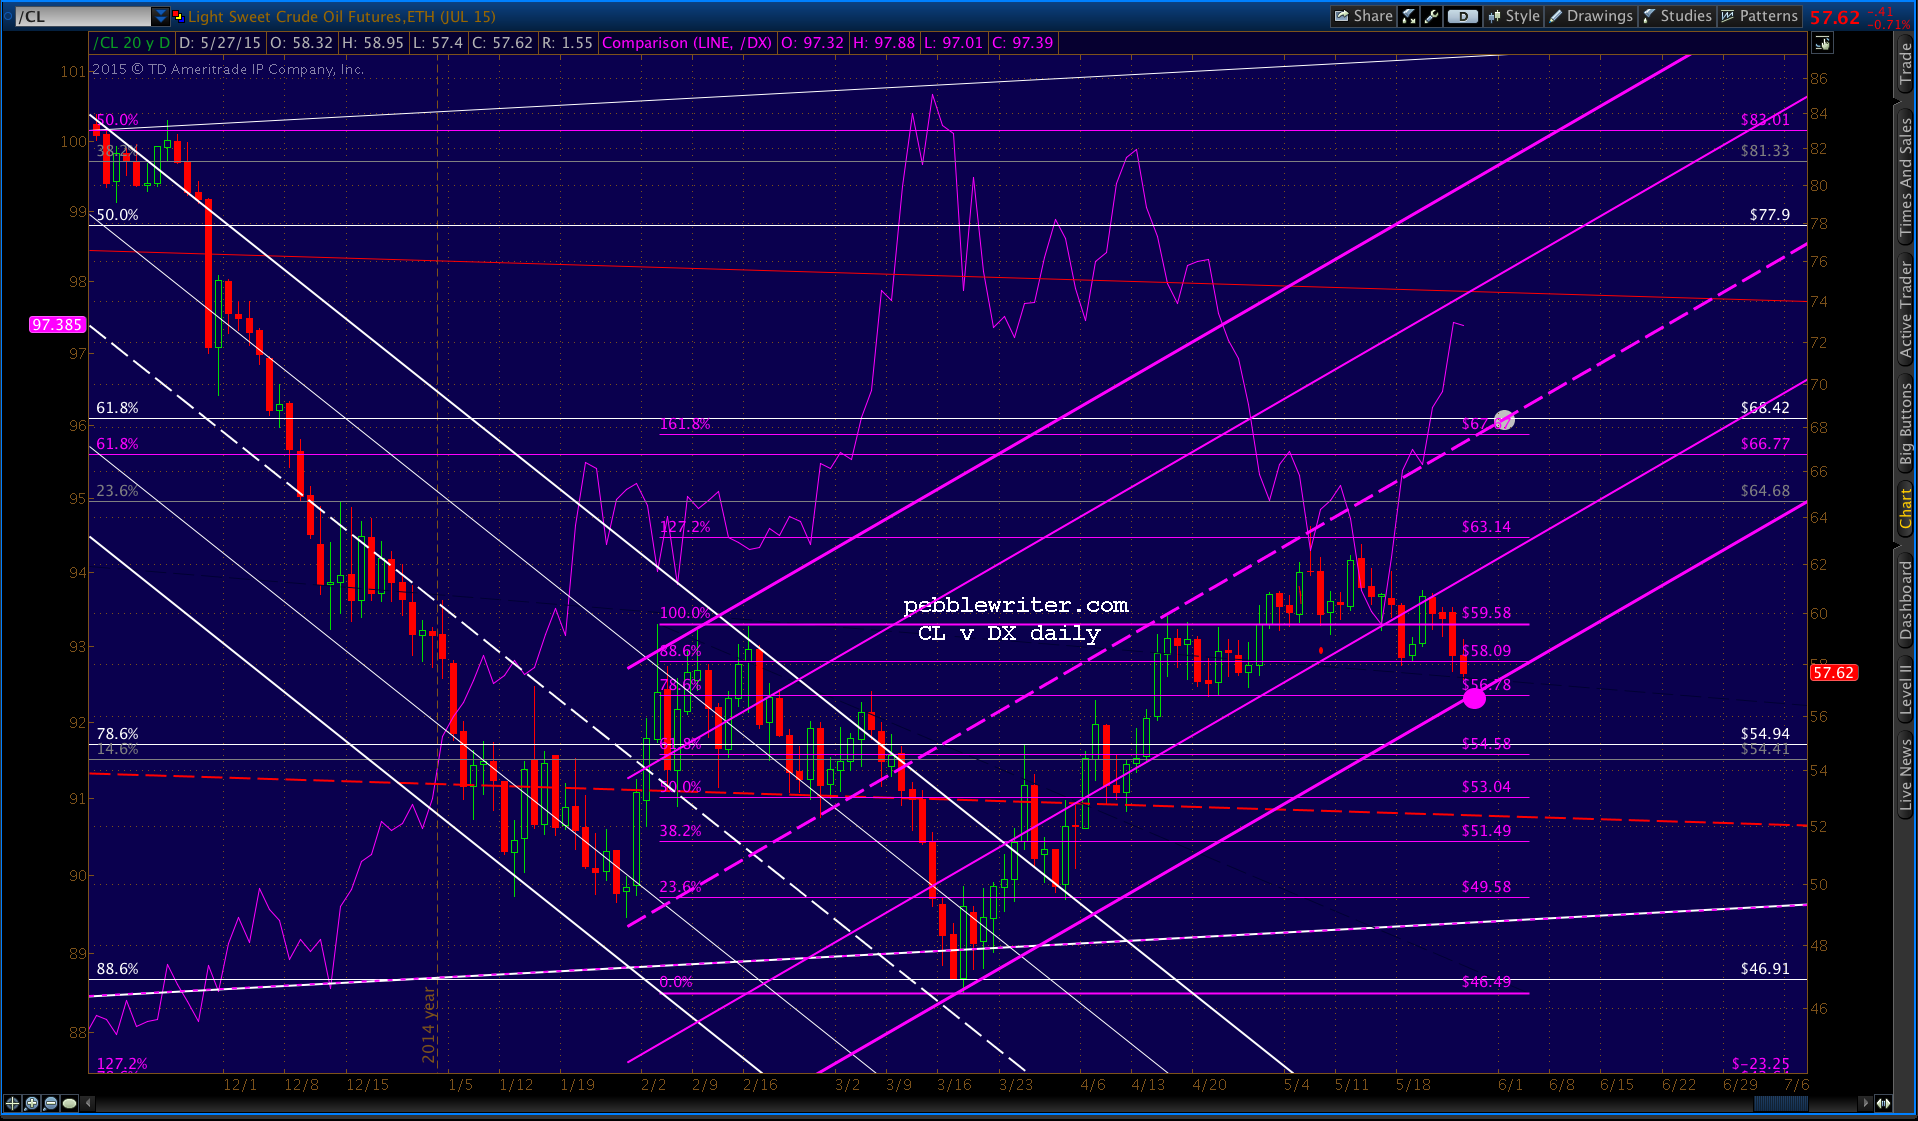
 As Briefing.com points out, the 1.1% decline in retail sales is the biggest quarterly drop since the Great Recession. Then, thanks to the dollar’s lofty levels, there’s the continuing plunge in exports…
 Given all the above, we’re left to wonder whether SPX can defy week-end and month-end convention of a stirring display of all-is-well-ism and follow through to the downside.