I received this excellent question yesterday from Tommy:
 Hello PW, you had the article “Eye Candy for Bears“. It has very good points to show the bear case. However, I wonder how a bear case would play out when the market is so bullish. Almost every day, the market jumps up with no news. (sometimes, it jumps up on good news. More often, it jumps up on bad news). This affects me because I am not bullish among the people I know. I get some complaints and criticism with a tiny bearish view. Every time, the Dow jumps 100 points or more, I get a message “here is your bearish view again”. I feel lost. (It does not mean if the market crashes, I am proven myself right. It is just that I feel wrong and strange for not being with the crowds.)
As the manager of a hedge fund which has been basically bearish since the beginning of the year, I can really relate to Tommy’s point. How can the bear case play out when the market is so bullish?
My philosophy is essentially to participate in both market upside and downside opportunities. My strategy, therefore, is geared to anticipating turning points which, IMO is the one of the toughest challenges in investing (many say it can’t be done.)
In the course of charting the markets for the past three years on this website, I got more major reversals right than wrong. But, I definitely had some missteps — of which there are two varieties: my not seeing a pattern, or the market ignoring the pattern.
I rarely miss recognizing the types of patterns on which I focus: harmonics, chart patterns, analogs, technical indicators, etc. They’re normally reliable, meaning they provide correct guidance most of the time. The failures in this category are generally related to conflicting patterns and the chop that accompanies turning points.
The more dangerous issue is believing markets will follow a pattern — only to see them ignore it. Why does this happen? To understand this is to start down a path of abject cynicism. But, not understanding it subjects investors to much worse fates.
While the traditional explanation of “why markets rise” is fine in the long run, it ignores the often outsized influence of key market constituents. These constituents, with almost limitless funds available at essentially no cost from the Fed, have a very strong vested interest in seeing the market continue to rise.
2013 equity underwriting revenue for GS, JPM, C, BAC and MS totaled $6.8 billion — up about 50% over 2012. With that kind of money (and, much more) at stake, is it any surprise that every once in a while — when the market is declining in response to a real, fundamental threat — these guys step in and prop it up? And, how hard would it be?
 The chart above shows the e-mini S&P 500 for the past two weeks. The dark vertical stripes show prices during the regular market trading hours. The light stripes show the after-hours activity. Total points gained or lost (with some rounding) during the period are indicated.
Total points lost during market hours were 44, or -2.36%. Total points gained during the after-hours: 39 or +2.09%. The really great part (if you’re a big broker-dealer) is that the overnight gains cost them virtually nothing.
Consider the night of Mar 17. The market was up a little earlier in the day, but needed to break through a key trend line. Volume was light (1-2,000 contracts per 30-minutes) most of the night, but started picking up around 4am ET as prices started slipping. At 7:30am ET, the e-minis were bid through the trend line, surged 10 points in 15 minutes on total volume of 43,217 contracts.
 When the cash market re-opened, technical buyers were relieved that the technical hurdle had been overcome. Everyone else was enthused by the fact that the futures were “pointing higher” and the market rallied another 10-points in the first hour of trading. The best part? Volume during that hour was 312,000 contracts. So, even if the “pump” hadn’t stuck, there were plenty of eager buyers on which the newly acquired contracts could be “dumped.”
The math on this is pretty straightforward. Even if the traders involved bought every single contract, total nominal transaction value between 7:30-7:45am would have been something on the order of $4 billion — about half of what ex-Goldman prop trader Matthew Taylor used to play with (supposedly without Goldman’s knowledge.) The first hour of trading almost always sees some follow-through on the futures. Even 2 points of profit per contract would yield a $4.3 million gross profit (0.1%) on that $4 billion “investment.” Ten points (actual gains in the first hour that morning) would yield $21.6 million, or 0.54%.
That’s not all that much money, but there are about 250 trading days per year. And, 250 X 0.1% works out to about 25% annually. But, remember, these are primary dealers we’re talking about. The denominator in their profit calculation is quite different from the rest of us who can’t borrow money from the Fed for free.
Without getting into an esoteric cost of capital discussion, let’s just assume they had to put up 1% of the nominal value (that’s much too high, by the way.) A $4.3 million profit on $40 million nominal is over 10%. For 1-2 hours work. At essentially no risk. Now, we’re talking real money.
And, don’t forget the side benefit, the whole purpose of this article. By ramping the e-minis past a point of technical resistance, the party goes on. IPO’s, secondary offerings, M&A, etc. — all benefit from a rising market.
The only hitch is that once in a while, a drop might be too big to contain. Such was the case in July-August 2011, when our 2011 as 2007 analog completed (right as S&P was downgrading US debt.) Much of 2008 was too big to contain. Natural disasters, bank failures, Russian invasions, etc. would fall into this category.
 Other times, the potential turning points are observable well in advance. The banks position themselves and let prices slide (or give them a nudge), making money on the downside and letting stocks reset enough to maintain the illusion of a free market. Examples include obvious Fibonacci levels, Head & Shoulder Patterns, etc.
The common elements are that the trades occur in the dead of night, on low volume, when the rest of the investing world isn’t watching, and that there is very often an agenda centered around forcing the market up through resistance.
A prime example was the undoing of the e-mini’s Bat Pattern last month. After completing a Butterfly Pattern on Dec 31, 2013, ES sold off by 114 points. As it retraced its losses, it reversed nicely at the .786 Fib.
Those who shorted at that level went to bed safe in the assumption that there would be some follow-through to the downside. Instead, ES zipped down and reversed at and rebounded off the .618 (precisely) in the after-hours.
 It rallied higher the next day, held its own overnight, and then tagged the .886 the following day for a Bat Pattern completion (A.) It vacillated for three sessions, then reversed nicely at (B) — still a valid Bat Pattern. That should have been the extent of it.
 But, the following three nights featured world-class ramp jobs, culminating in a spike up through the former high to (C.) Traders fought over whether or not ES would break out for five full sessions; but, technically, the fight was over. The coup de grace was the precision .886 back test — not once, but twice. My neck is still sore from the whiplash.
Would ES have made a new high without the ramp jobs? Probably not. The Dow, which stopped at a well-formed Bat Pattern, certainly didn’t. It was a well-executed ploy that resulted in new highs and shook out a lot of unsuspecting bulls and bears both. But, ploy is too weak a word. Let’s call it what it was: a manipulation.
This sort of activity has become so commonplace that short-term investing increasingly revolves around discerning the banks’ motives and hidden agendas and trying to anticipate those events that might upset the apple cart. Ramp jobs work better in an environment of complacency and/or indecision, as the rest of us are more compliant.
Waking up every morning to the boob-tube bobble-heads babbling about the latest big deal and seeing the futures up 10-points, who’s to argue or wonder why? Better to BTFATH and ignore the signs of global market distress, the very bearish big-picture charts and the exceptionally high leverage, both via margin and in the banks’ derivatives portfolios.
Are bears doomed? Is the market still capable of dropping an appreciable amount? My charts tell me a very sizable drop will occur between now and mid-May. It may have already started. We know that the big banks (propped up by the Fed) will buy the dips — if not during market hours, then overnight. But, there are plenty of risks out there — a Fed misstep, a war, a bank failure, Asian currency crisis, etc — that could tip the scales too much for even the banks to handle. And, we’ll get our correction…or worse.
It’s definitely hard to be short when seemingly everybody is so bullish. And, it’s no fun at all to be on the losing side of a rally. But, it beats the heck out of being on the wrong side of a crash — the usual outcome of euphoric markets.
Stay tuned…
* * *
I’m traveling for the balance of the week, but will try to post market updates when my schedule permits.


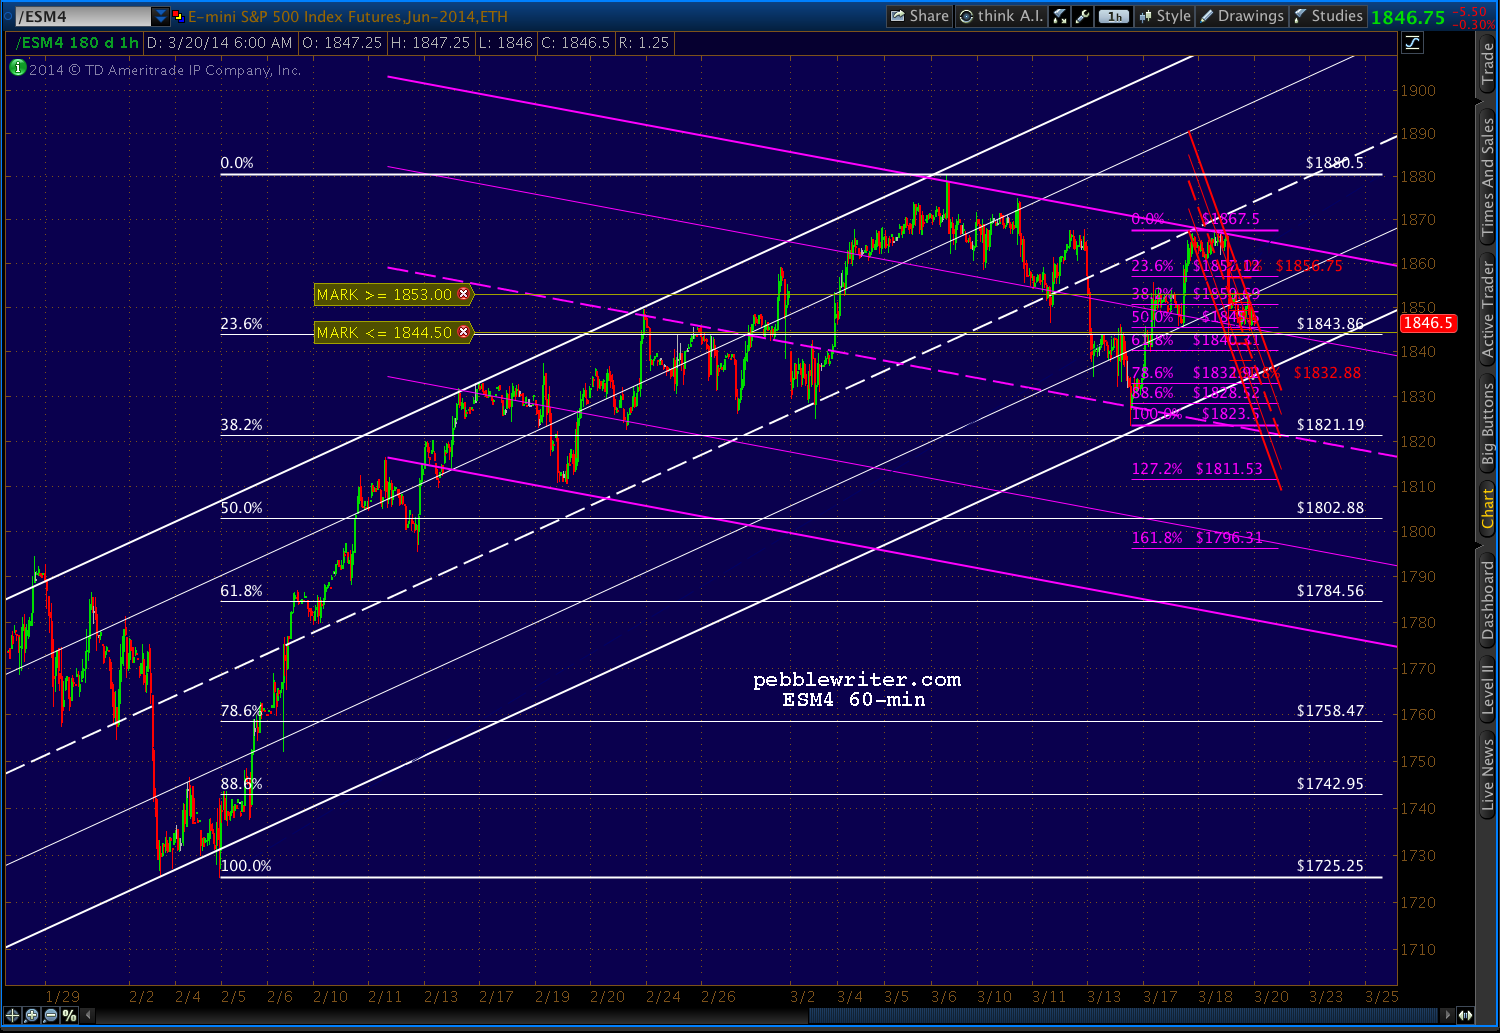
 ES still shows a H&S Pattern (red) within the right shoulder of a larger H&S Pattern (yellow) and the channels we’ve been assuming for the past couple of weeks haven’t yet broken down — though each daily ramp job does its best.
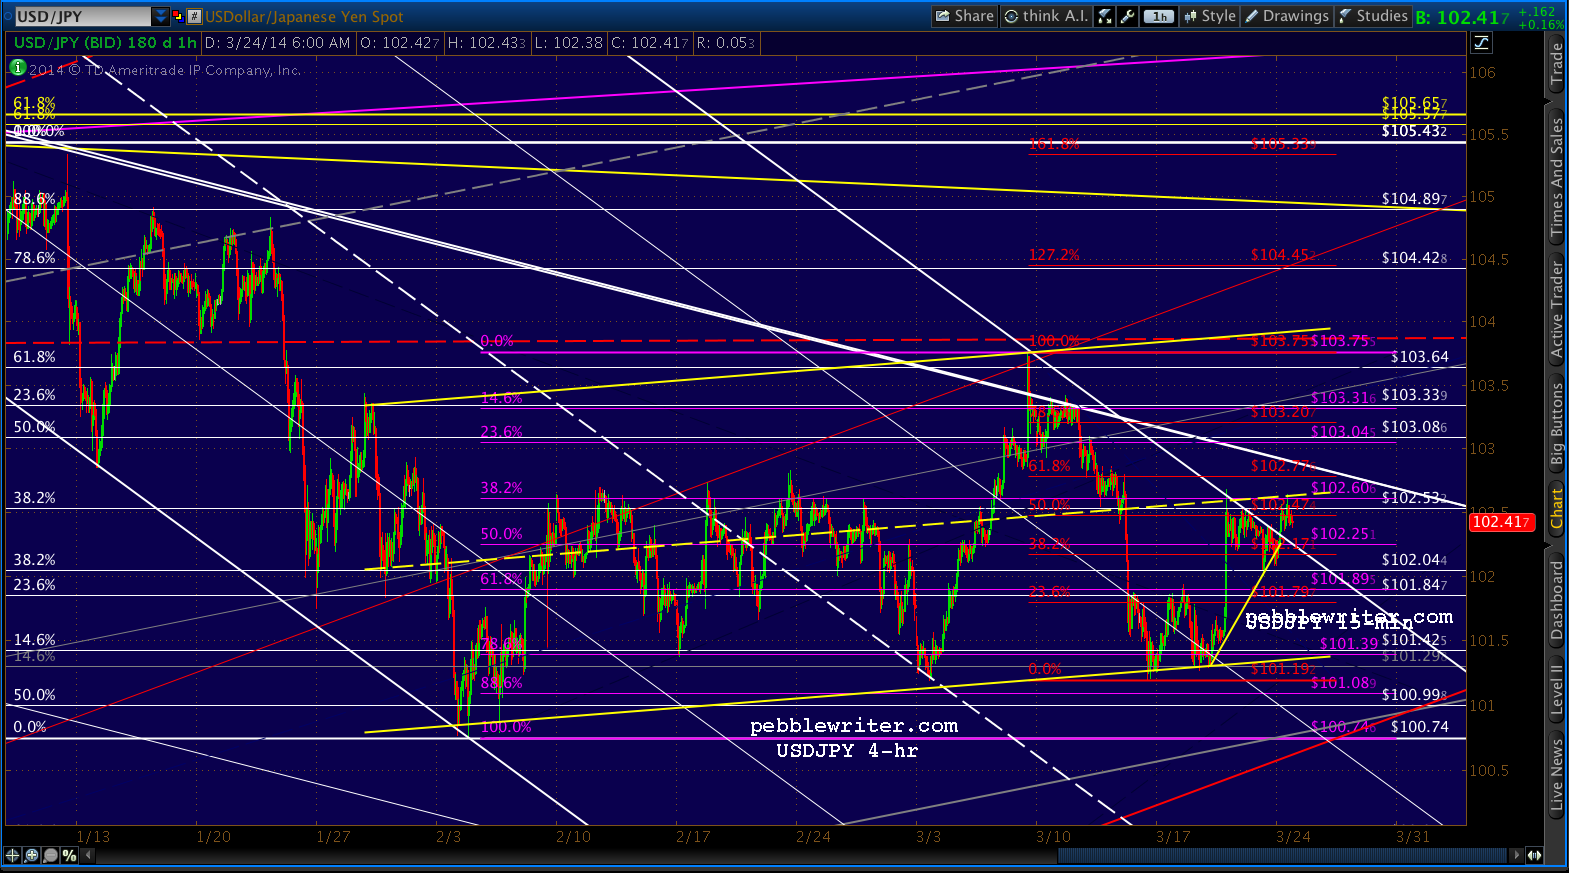
 As we’ve discussed extensively, the pair is moving higher on yen weakness due to: 1) open market manipulation (selling yen, buying USD) by the BOJ; and, 2) market participants’ assumption that continued weakness in the Japanese economy will necessitate additional easing.
 Also, thanks to the delay, the white channel bottom is converging with the purple’s. The white channel bottom intersects with the white .786 Fib level around Apr 9. By tagging the white channel bottom, bulls can hope to extend the rally long enough to reach the yellow 1.618 at 2138. Interestingly, had the markets not consolidated for the past 3 months, that target would have been tagged right about now — as the white midline (dashed) intersects with the yellow 1.618 at 2138 on Apr 2.
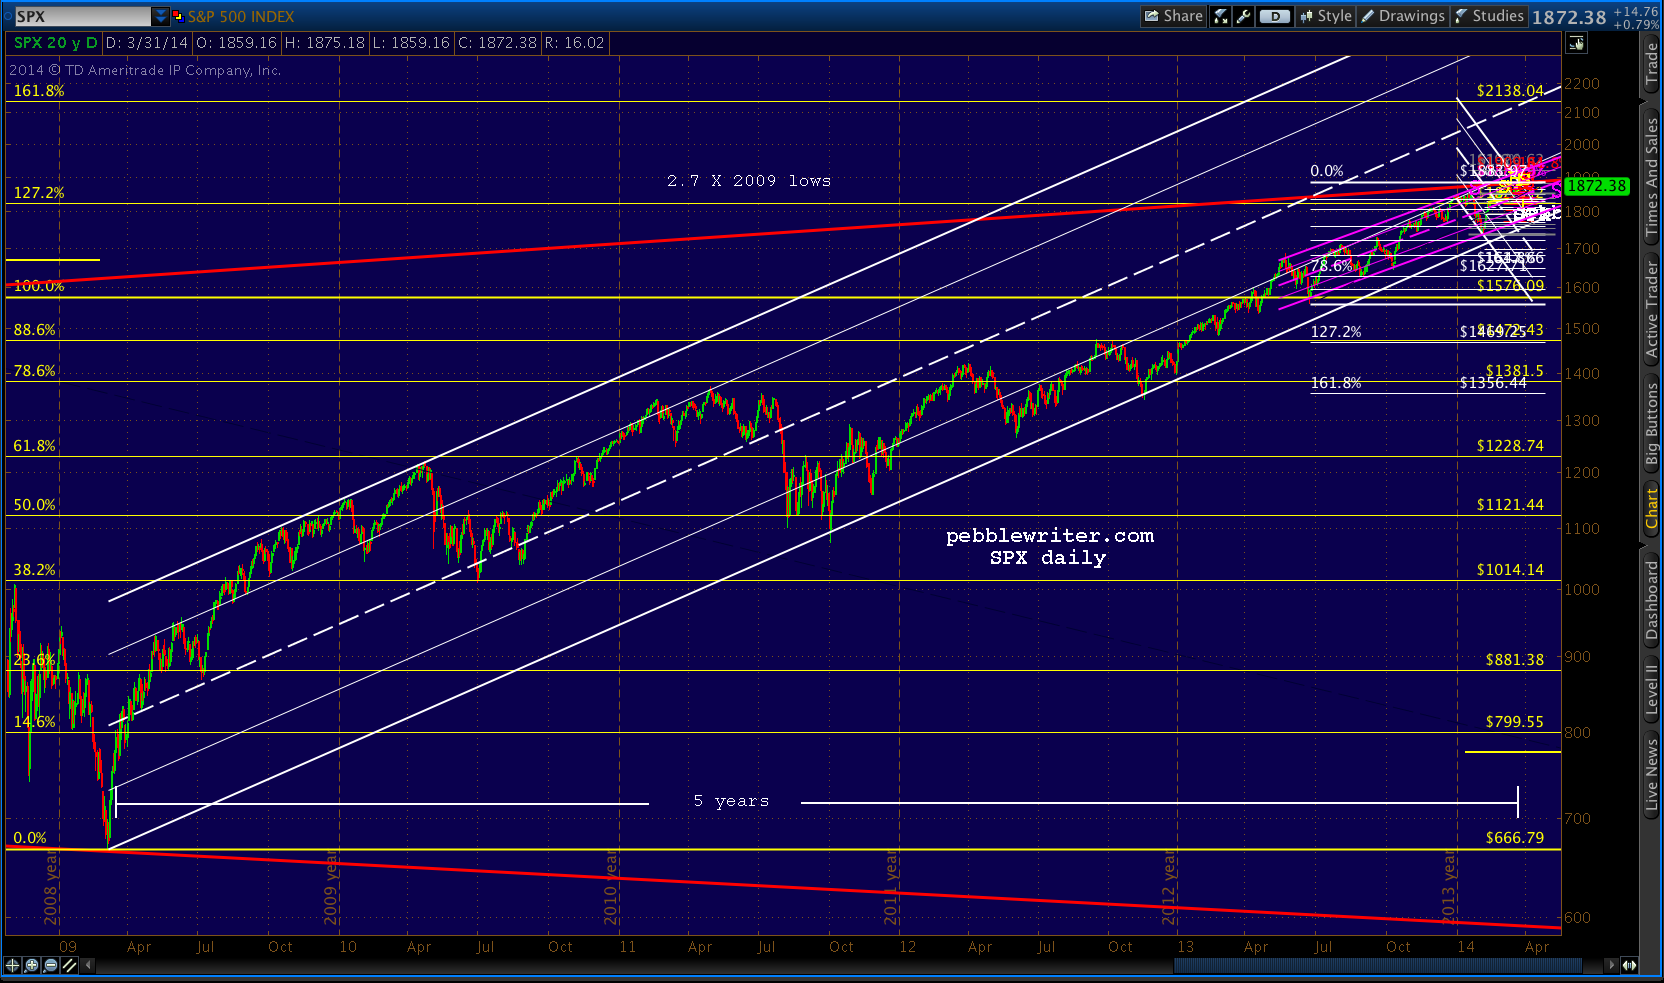 Of course, that would have required a push up through some long, strong channel lines and manipulation of currencies and bonds as well. Note the 10-yr chart patterns are still very much intact, with a series of lower highs held down by the falling channel top.
 Though, a more modest decline in equities would probably translate into TNX hitting an intermediate target such as 2.20%ish (white channel midline) rather than the more aggresive white .786 and red channel bottom intersection at 1.91%.