Month: December 2011

  • Charts I’m Watching: December 12, 2011

    UPDATE:  2:00 PM

    We’re at a critical level in the short run.

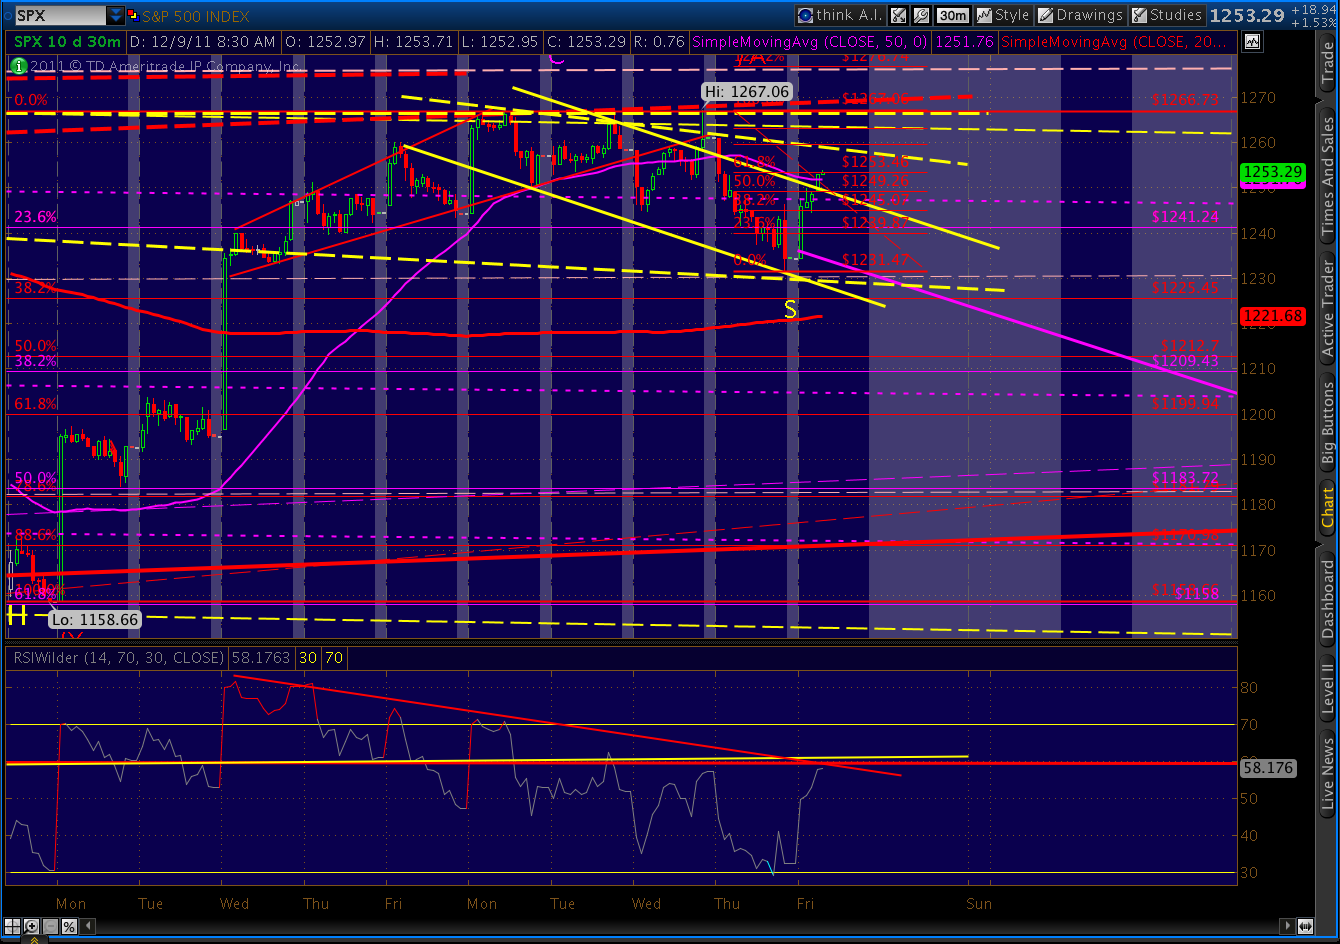
    SPX is paused here at the .382 Fib retracement of the rise we’ve seen over the last two weeks.  It also marks one of our key channel lines (dashed, white.)  A breakdown through the bottom of these support levels would also mark a failure of the wedge to hold.

    One helpful guide is the 5-min RSI.  Here’s it’s forming a little symmetrical triangle.  I’m looking for a breakout one way or the other as an indication of next steps.

    There’s a slight positive divergence going on with the short-term charts, but not enough to be overly concerned.

    UPDATE:  11:20 AM

    A quick review of the channels we’re watching.  As we discussed last week, the descending broadening wedge continues to play out, with another touch of the bottom wedge line threatening to wipe out Friday’s gains.

    Note, the bottom wedge line is also a trend line off the 1292 highs.

    UPDATE:  10.00 AM

    ORIGINAL POST:

    EUR/USD continues to respect the channel line we drew months ago, even completing a nice little head and shoulders pattern on the 60-min chart.

    Why do I have so much confidence in this channel?  It’s at exactly the same slope as the three previous declines.  In other words, this isn’t my bias talking.  Just a three-peat of an established pattern.

    If we continue down the same path, notice that there are some pretty violent crashes in the two previous channels, with .05 – .08 weekly moves after a period of consolidation at the channel boundaries.

  • Charts I’m Watching: December 9, 2011

    EOD:

    Charts to chew on…

    UPDATE:  2:55 PM

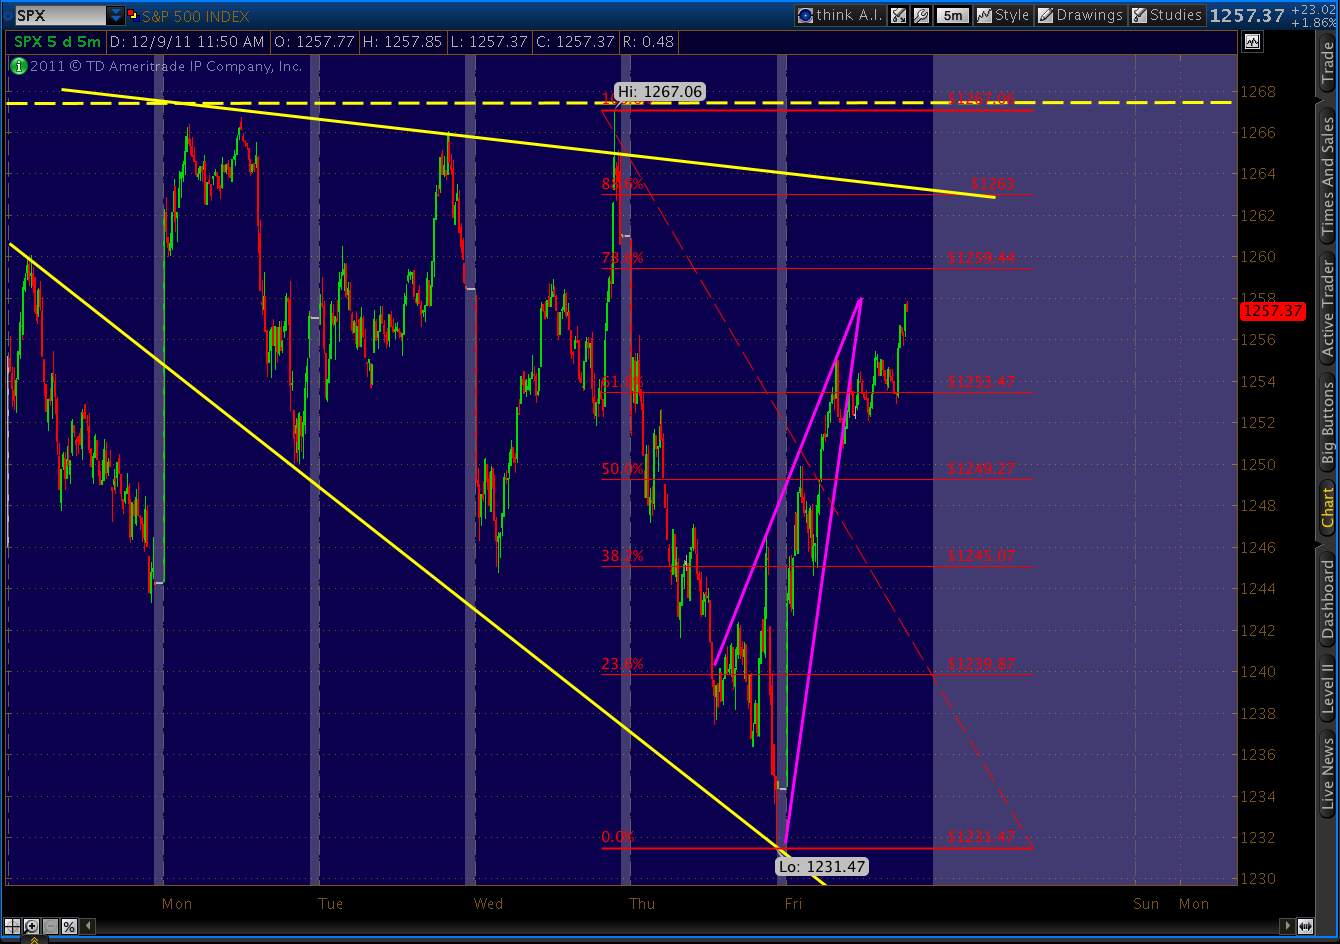
    Here’s an updated chart with the Fib’s clearly marked.  This could count as a sloppy Gartley (which reverses at the .786) or a Bat (reverses at the .886).  Either way, we stay within the wedge.

    UPDATE:  1:10 PM

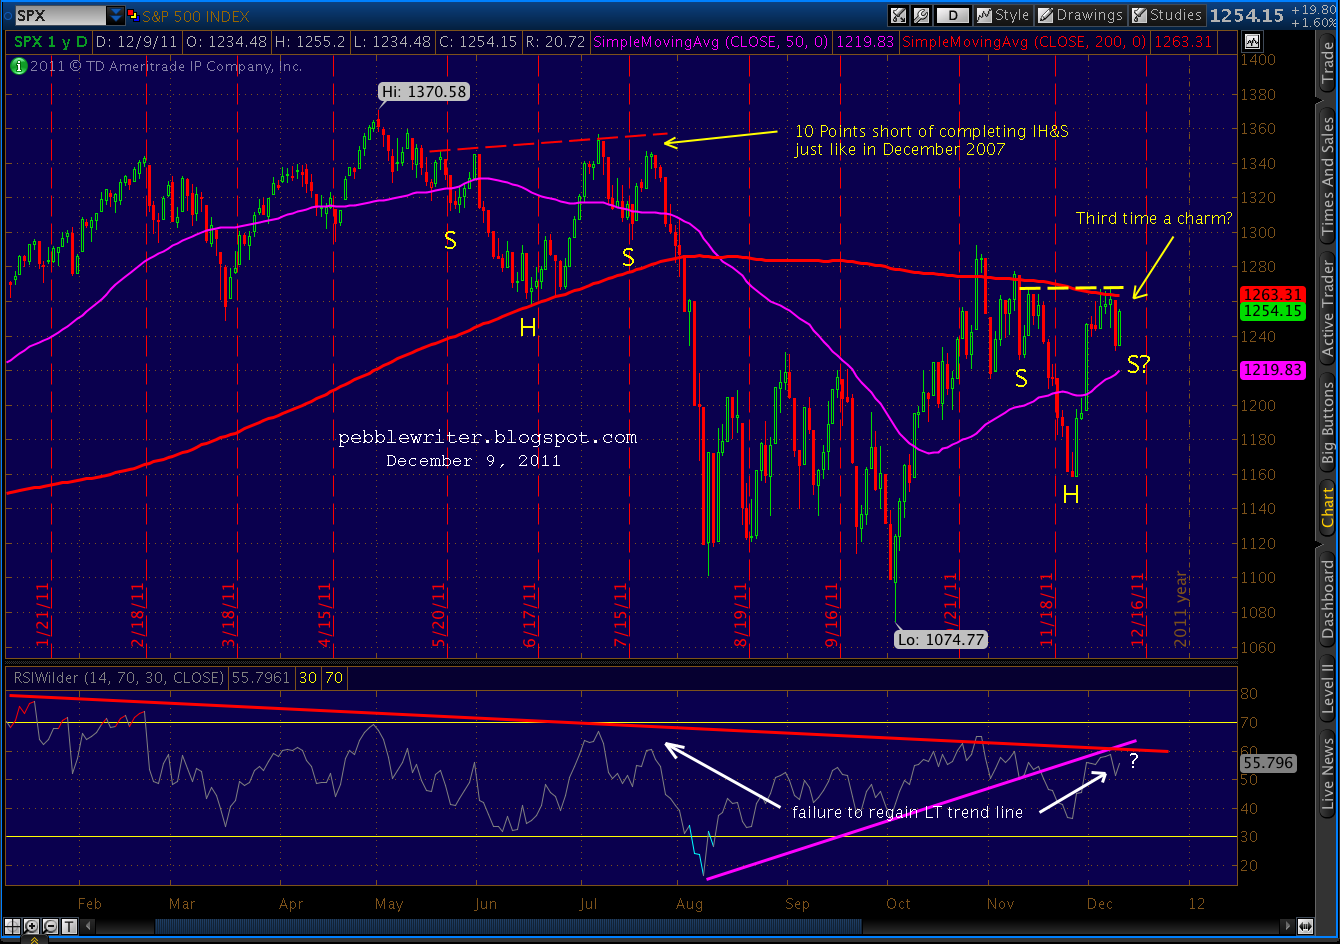
    We’re stalling at 1253 as I expected — 13 points short of completing an IHS.  We could go up to the .786 at 1259 or the .886 at 1263 and still be safely within the wedge.  It would also allow for more negative divergence to set up, typically an effective bearish indicator.

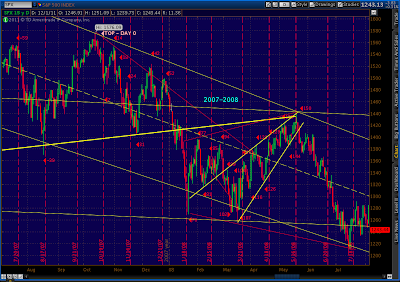
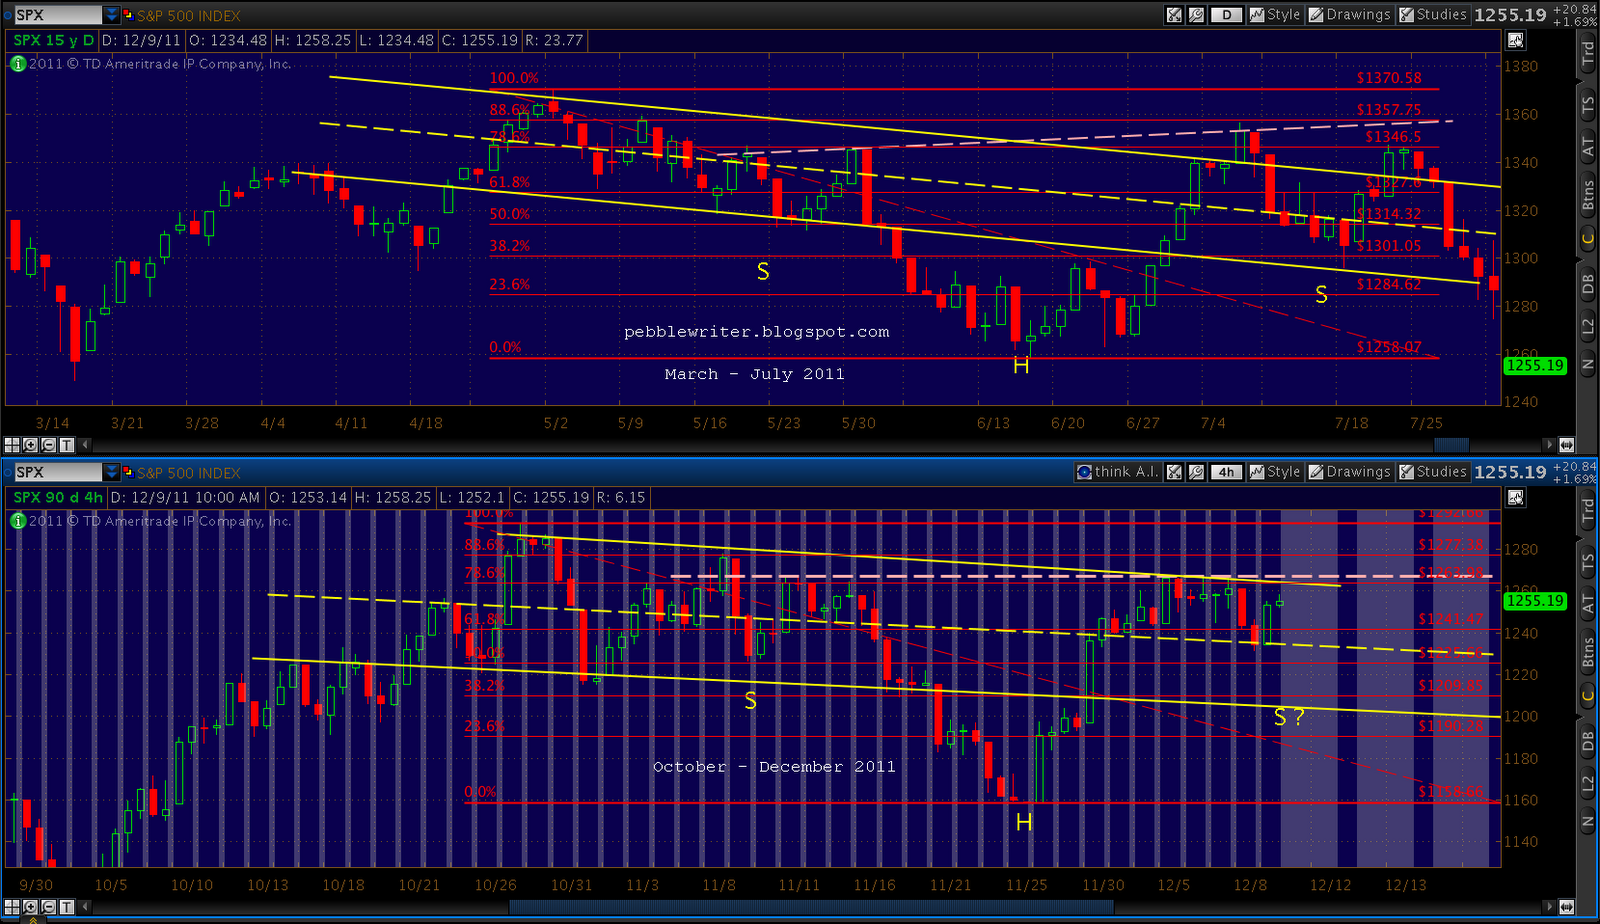
    Here’s a good view of the July and current setups, along with the 2007 version.  Both the previous fakeouts trapped a lot of bulls, salivating over a potential 100+ point rally.

    Thinking like a market maker…can you imagine a better setup to rake in boatloads of money from hopeful bulls?   What’s really changed in Europe that would indicate they’re finally getting their act together?  Another summit, another promise to take things more seriously.  Big whoop.

    And, with all the attention there, what about our own fiscal predicament?  It’s not as though we have a clue (or the political will) to address our very deep-seated problems.  Washington is no doubt thrilled to have the attention focused elsewhere for a change.  But, do you think S&P; has forgotten?

    Here’s the post from July:  [Ten Lousy Points].

    And, a quick peek at a rising wedge setting up within the descending broadening wedge. 

    Just a reminder, if we break out to the upside — which according to Bulkowski happens 55% of the time with descending broadening wedges — I see the limit as 1307-1313.  So, to me, the question isn’t whether but when we head south.

    UPDATE:  11:15 AM

    Here’s the Inverse H&S; pattern the bulls are counting on.  It would complete at 1266, but as we’ve discussed the past several days, I think SPX will come up short — trapping many bulls in the next phase of the decline.

    Potential Fib stopping points off the recent 1267 high are 1253.46 (.618), 1259.44 (.786) and 1263 (.886) — all shy of the 1266 that would complete a potential IHS.

    Looking at the RSI trend line on the 30-min chart, I think 1253.46 is the most likely area for a top.

    If we redraw the channels with that as the daily top, it’s a better fit all around.  Consider what’s going on with the 60-min chart’s RSI.

    It’s a broadening descending wedge — cousin to the broadening ascending wedge the SPX just broke down from.  RSI is bumping up against the top trend line, meaning it has to break through on the upside or a crash down to the much lower bottom TL is just around the corner.  I’m expecting the latter to commence momentarily.

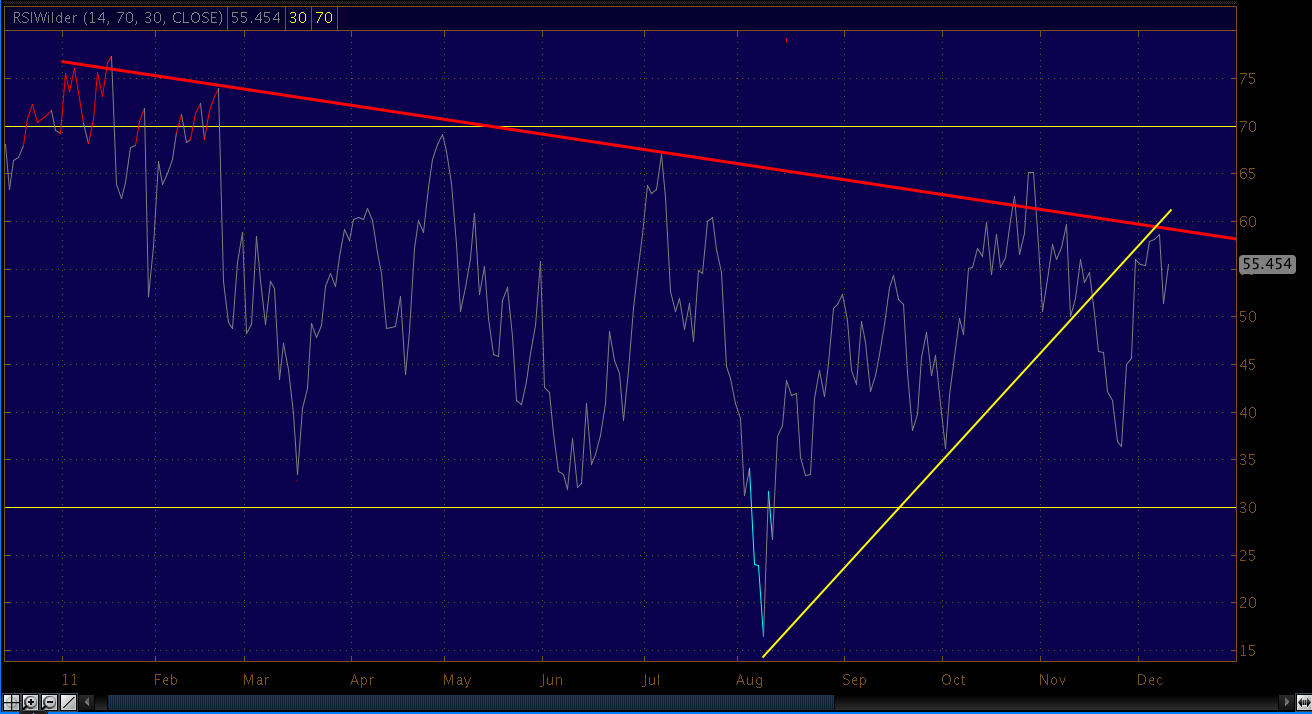
    Just a reminder as to where we are on the daily RSI:

    ORIGINAL POST: 

    Look for this little rally to stall at the upper end of the channel we established after breaking down from the megaphone pattern.  The channel can be drawn two ways, depending on whether we include the shadow from yesterday morning.

    The main takeaway is that we’re making lower highs and lower lows.   Until that changes, the trend remains down.

    More later.

  • Charts I’m Watching: December 8, 2011

    UPDATE:  EOD

    The fractal we discussed yesterday played out perfectly today (the equivalent of July 8-11, 2:3 time ratio.)  Look for more downside (targets discussed earlier today) before a rebound next week.   The cynic in me expects the July 22 rebound high to line up with OPEX Friday, but we’ll see as we move along.

    Clearly someone trading in SPY had the same idea about an IH&S; pattern, and ran up the equivalent of 27 SPX points in the minutes after the cash market closed.   It came right back down, of course.

    ORIGINAL POST:

    We’re seeing the (initial) payoff of all the harmonic patterns we’ve been watching.   SPX is currently off 22 from yesterday’s forecast/actual 1261 close — a little over a 25% retracement of the last rise.  First, the daily picture:

    The reversal at the triple top of 1266 goes a long ways toward validating the primary channel lines (yellow, dashed) I’ve been assuming are correct.  The contra-channel lines (red, upward-sloping) should provide some guidance on the way down from here.

    We know they’re important because lines of the same slope have played such an important role in the past.  Consider the past three years:

    As always, the primary channels become contra after a change in direction, and vice versa.  Naturally, they aren’t the only channel lines that matter — far from it.  But, they’re the ones that have most of the action since the March 09 lows.

    There are many possibilities for how this plays out.  For one thing, this move down says nothing about whether there’s another leg up past 1292 or not.  Some Elliott Wavers are adamant that this is the B wave down in the C wave up of a larger A-B-C move from 1074 to 1307 or so — a corrective wave 2.  Looking at the charts, there is a very good case to be made for 1307-1313.   It’s my top alternate.

    It’s also just as likely that this is the first wave down of an impulsive wave 3 down.  If so, things will get real interesting real fast.  Since we won’t know till we know, let’s look at some near-term possibilities.

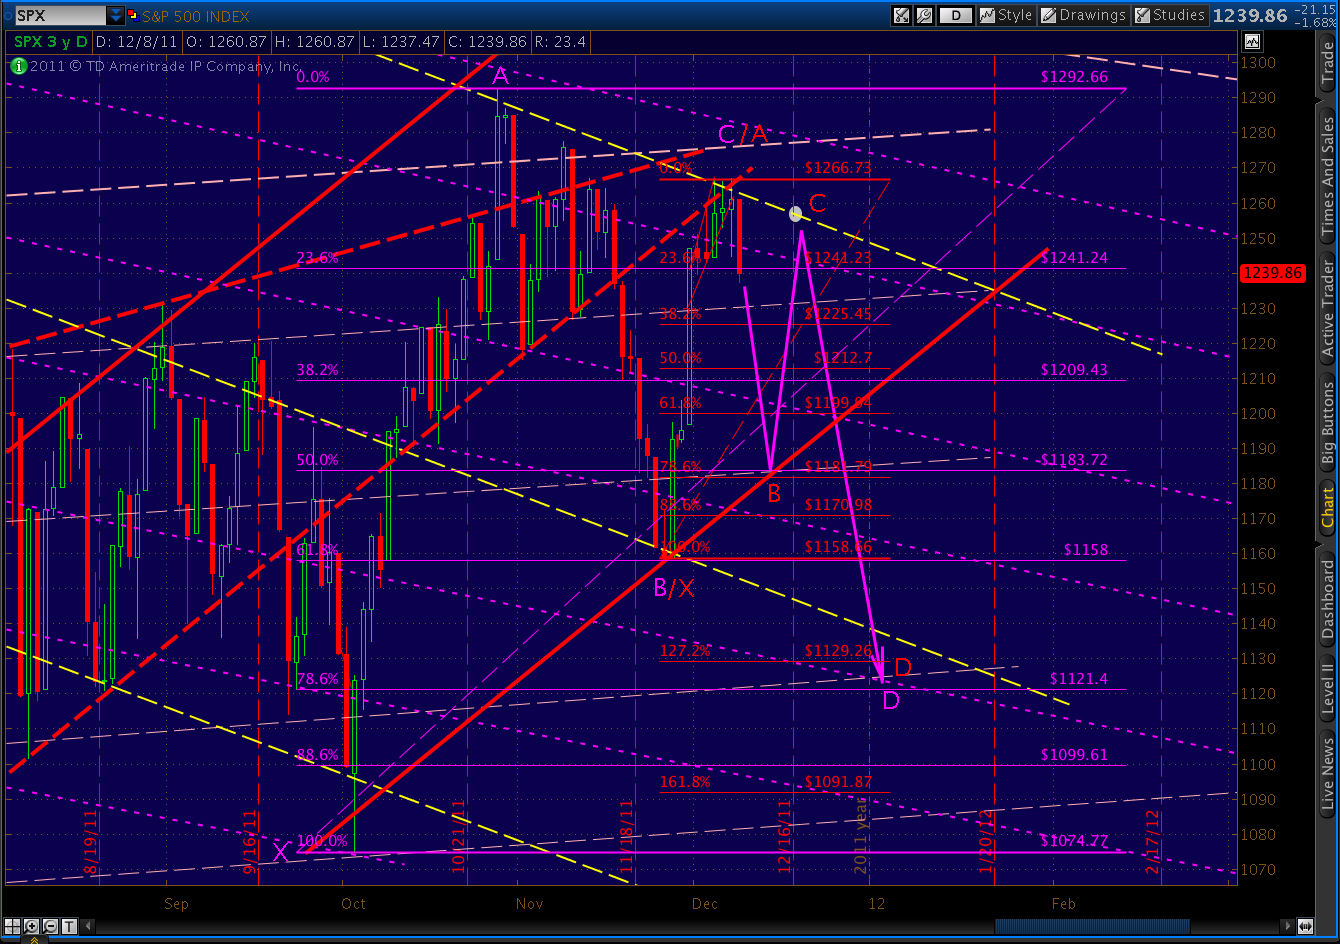
    Remember, we’re working on a large Gartley pattern (in purple, below.)  Our Point D target is 1121.  With that in mind, it makes sense to see how we might get there.

    As can be seen above, 1121 is very close to the 1.272 extension of the 1158 to 1266 rise (1129 is the actual 1.272 fib).  This would suggest a Butterfly pattern, which requires a .786 Point B — which would be 1181.  [There’s no reason these patterns must be in sync, but I like to look for such intersections as they often portend a more likely outcome.]

    The other reason I like this Butterfly pattern — and I’m speculating here –is that it would entail a Point C up around 1256-1258 (the white circle), which would mean we come within 10 points [see: Ten Lousy Points]  of completing a rather large Inverse Head & Shoulders pattern.  [see: Big Pictures]

    We discussed this possibility over the past few days.  It’s an analog to both the July 2011 and the December 2007 markets and would trap an enormous number of bulls.  It would also crush the many bears who would go max short for the move down, only to see a rebound right around OPEX next Friday.

    The same IHS fakeout possibility exists with other right shoulders, BTW, including any of the fib levels between 1181 and 1225.  The key ingredient is a bounce back to just short of 1266.

    If our December as July fractal holds, the move back to C at 1256 would correlate to July 21, meaning the next leg down could be massive.  After July 21, the Gartley I had predicted sailed beyond the .786 Fib retracement level to the 2.618 extension (eventually to the 3.000 at 1074.)

    Reaching even the 1.618 extension on the current Gartley would take us to the 3.00 on the Butterfly, both at 940ish.  Of course, a move below 1085 or so completes a massive H&S; pattern that would target 785 on the downside.  Remember what I said above about things getting interesting?

    With all that out of my system, please understand this is a like a high stakes game of “If You Give a Mouse a Cookie.”  Something benign leads to something else ominous that leads to other stuff that’s just plain ugly.  But, there is absolutely no requirement that we dip all the way to 1182.

    There are plenty of channel, fib and fan lines that could arrest us in the very near future.  The most obvious coming up are 1225-1230 (channel and .382 fib) and 1209-1212 (.382 and .500 fib’s.)

    As I speculated yesterday, we have established a downward-sloping channel (dashed, yellow) that would take us to any of the afore-mentioned targets.  If, however, we place another trend line (purple, dashed) in just the right place, today’s move down looks a lot like a falling wedge.

    A breakout here could go back up and test the upper limits of the channel, or further — finishing off a proper A-B-C corrective wave 2 and thrilling the EW crowd.  As before, the key is 1292 (and, now, 1266.)

    On the downside, the key is 1200.  It’s not only the .618 of the proposed Butterfly, but also marks a critical contra-channel line that, if broken, would likely result in a massive sell-off. (It’s held twice before — 1074 and 1158 — but its days are numbered.)

    Good luck to all.

  • Add China…

    …to the list of countries not coming to the financial world’s rescue.    Fascinating article on a subject we haven’t talked about in a month or two — China’s 64 million empty spec apartments.

    Read the rest of the article, complete with satellite photos  here.

     ***********

    And, just to balance things out, an excellent commentary on the game afoot in euro land.  Is there any chance that Friday’s summit will produce real results?  Steen Jakobsen, chief economist at Saxo bank, details his doubts quite nicely.

    Read the rest of the article here.

    ************

    And, last, thanks to Mish for a totally unrelated chart that perfectly sums up the recovery we’ve enjoyed since this recession officially ended in June 2009…

    Source: http://globaleconomicanalysis.blogspot.com/


  • Another Fractal: December 7, 2011

    EOD:  4:05 PM

    Apart from 20 adrenaline-soaked minutes of rumor-fueled overshoot, the rest of the day went exactly as scripted at 3:25 below.  We closed at 1261.01 instead of 1261 (sorry), completing the now A-B-C backtest of the megaphone and wringing out all but the gutsiest bears (or at least those on a bathroom break.)

    It isn’t exactly a Gartley, thanks to that 20-minute spike, but it closed within pennies of the .786, and clearly outside the megaphone pattern.  Can we ignore the overshoot?  It makes for a very nice downward-sloping channel if we do.

    The daily chart is still looking intact, with today’s brief foray into bullish territory relegated to shadow status.

    I know what you’re thinking… what about confirmation?  Is there any other indication of a reversal after today’s schizophrenic action?  Only if you count the Bat patterns on IWM, COMP and NDX.

    Oh, and the Butterfly on the DJIA.

    And the Gartley on AAPL.

    Isn’t it amazing how many sessions have closed within a few points of 1258-1261?  I count around 30 in the past six months.

    But, looking back further…

    ORIGINAL POST:

    Just discovered another fractal worth keeping an eye on.  The period since October 4 has behaved very similarly to the Mar 16 – July 7 period.

    If the comparison were to hold, we’re due for a 30-50 point downturn in the next day or two, followed by a partial recovery and a strong sell-off next week.  The time ratio is about 2:3, meaning two days in the current market equals about three days in the prior.

    Possible flies in the timing ointment are the euro zone summit this Friday (everything euro, actually) and OPEX next Friday.   Here’s a peek at the very similar megaphone pattern that set up on SPX in July.  The back test and subsequent 50 point fall correlate nicely my expectations for this market.

    July 2011
    December 2011

    And, lastly, here’s a peek of the two together on the same 60-min chart.  Note, especially, the similar RSI pattern.

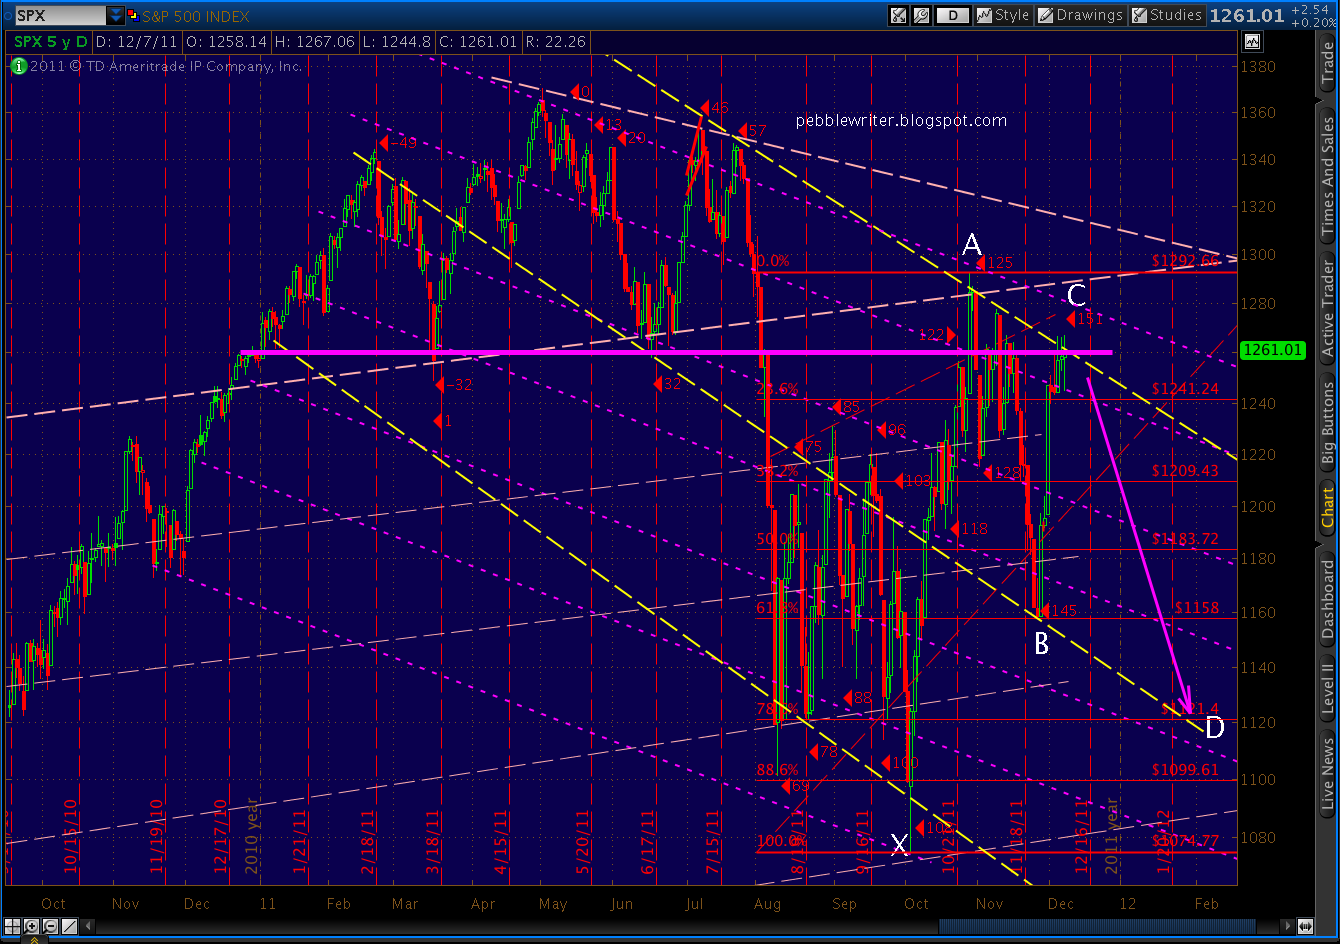
    Here’s an update on the Gartley I’m expecting to take us down to at least 1121.  Seen on the weekly chart, with clearly defined channels and RSI meeting strong resistance, it’s a pretty compelling case IMO.

    UPDATE:  3:25 PM

    The market’s not about to go down without a fight.  On the face of it, I’d say this comeback raises doubts about an imminent decline.  We were supposed to back test the megaphone and head down, right?  Well… look where we are:


    The backtest that could have completed with a simple touch at 1255 is instead working on a C leg of an A-B-C contratrend, and is signalling a Gartley at the .786 at 1261 before the downturn begins in earnest.   IMHO, this is merely an effort to flush out a few more remaining bears before it starts to really matter.

    We will still have a lower high to go with the lower low, establishing a new downward sloping channel to boot.

    UPDATE:  10:00 AM

    So far, so good.  Today’s off to a good start as a proxy for July 7.  We broke down from the ascending broadening wedge, should back test and continue down.

    I’ve put the Fibonacci levels up for this past couple of weeks.  Although we reversed at the .886 level, this isn’t the strongest example of a Bat pattern I’ve ever charted.  The B and C points are there, but not all that discernible.

    Nevertheless, a .618 AD retracement would take us all the way back to 1200, where one would expect a bounce anyway.

    This morning’s decline also invalidates the large inverse H&S; some were promoting.  (I’m not a believer in patterns with such tiny shoulders, so I didn’t share in their enthusiasm.) On the other hand, if we were to reverse somewhere around 1230, there exists the potential to form a proper IHS that would complete back at 1267 or so.

    I think this would get a lot of people excited, just like similar moves did back in July and previously in December 2007.  Each of those IHS patterns trapped a lot of bulls when they came up 10 points shy of completion. [see: Ten Lousy Points.]

    UPDATE:  11:50 AM

    Just executed a perfect little backtest to the wedge.  Last good opportunity to take short positions here around 1255.

    And, 40 minutes later, completing the RSI TL touch on the 5-min chart at 1257, with a better looking A-B-C look to the back test.  Tagging the 200-period SMA, too.

    UPDATE:  2:10 PM

    Still hanging around the 1255-1257 range in a back test of the megaphone.  Drew some fan lines, too, just for grins (purple dashed lines.)  Note the market’s reaction every time it breaks one —  a backtest and search for the next lower low.

    Note that, since the megaphone pattern tilts up to the right, the back test could conceivably run a little higher, too.  But, if I’ve drawn the last fan line correctly, the party’s over one way or the other either today or tomorrow.

  • The Big Pictures: December 6, 2011

    It’s been a while since we looked at some of these longer-term charts.

    1.  EUR/USD

    2.  DX

    3.  SPX

  • Charts I’m Watching: December 6, 2011

    UPDATE:  3:30 PM

    The yellow channel we discussed at 1pm is doing a good job of guiding the market.   Still in the megaphone, still trending upward.

    UPDATE:  2:00 PM

    This churn is getting old… now we’re back testing RSI resistance, meaning the very near-term should be up.

    UPDATE:  1:00 PM

    Should have slept in this morning…  So far, all we’ve really accomplished is the pattern we’ve seen way too much of lately — a symmetrical triangle.  But, it’ll eventually break.  The counter-trend rally has the upper hand until the megaphone pattern is violated to the downside.

    Note that as long as the megaphone remains in play, the market can continue waffling on a general upward path indefinitely.  The lower line of the triangle (yellow) can be paired with a parallel line to construct another upward-sloping channel.

    UPDATE:  12:00 PM

    SPX is still waffling.  A move below 1253 will invalidate the IHS we were watching.  But, so will uninterrupted sideways movement — since a H&S; pattern should be roughly symmetrical.  We broke out above the neckline, but the trend has been down ever since.

    We appear to be backtesting the lower bounds of the green channel.  But, this move also needs to be confirmed.  Otherwise, we can’t know for sure if we’re simply seeing a broadening of the channel.
    The real test will be the red TL off the 1266 high.

    From an RSI standpoint, we’re backtesting both TLs of resistance.

    A break beneath the megaphone pattern at around 1250 would serve as confirmation of a downward move and would be a good intra-day entry point.  After breaking, most patterns back test — another logical entry point to play the downside. 

    UPDATE:  11:10 AM

    SPX showing indecision.  Follow the green upward-sloping channel or the red downward-sloping one? Note the RSI TL’s also reflect a fork in the road.

    UPDATE 10:00 AM

    There’s a tiny little inverse head and shoulders pattern potentially setting up on the 5-min chart.  If we hit 1259, watch out for a run up to 1268 or so.

    ORIGINAL POST:

    SPX has traced out a bear flag and an ascending broadening wedge, commonly referred to as a megaphone.  According to Bulkowski, these puppies break out to the downside 73% of the time.  Although the market seems to be pausing, awaiting for the umpteenth time the follow-through on a miraculous euro stick-save, a downward move is my preferred technical picture.

    We tested the 200 SMA yesterday, but closed beneath it.  There is obviously still some upside momentum waiting in the wings in the event the euro-cure actually produces something meaningful this time.

    Should that occur, prices should be limited to 1307-1313 (the oval), reaching a TL connecting the May 1370 high and the July highs.  (In this market, that could occur in as little as a day.)   It should soon be obvious which of the yellow channels — the upward sloping solid channel or the downward sloping dashed channel — we’re going to follow.

    But, for now, the TL off the 1292 high is doing quite nicely in containing any further upside.   If you’re wondering what the purple lines are, I’m working on updating the longer term picture from a harmonic and chart pattern standpoint.  I’ll post it a little later this morning.

  • Charts I’m Watching: December 5, 2011

    UPDATE:  11:00 AM

    Broke through 200 SMA but pulled back.  Hourly negative divergence getting pretty extreme.  Just reached .886 Fib retracement of the 1277.55 high.

    Daily RSI right up against its two TLs.  Any further and it will start to look like a breakout.

    Given the potentially imminent loss of AAA status by Germany, France, et al, the following FT article is timely.  http://ftalphaville.ft.com/blog/2011/12/05/778301/the-decline-of-safe-assets/

    UPDATE:  10:00 AM

    SPX right up to the 200 SMA at 1264, backing off, still showing negative divergence.

    UPDATE:  9:15 AM

    Markets rallying strongly on more eurofix rumors.  Financials especially strong, but they are tracing out a rising wedge on negative divergence — a good sign of a possible reversal.  The Gartley we were tracking last night fizzled.

    The eminis are back to the same Bat pattern we saw on Friday, with even more negative divergence and a little double top this time.

    We’ll see if this rally has any staying power once the cash markets open.  We’re overdue for a good gap and crap…

    ORIGINAL POST:  2:30 AM

    Gartley setting up on the futures 5-min chart, completes at 1258.31.

    Potential EURUSD and DX RSI trendline backtests on the 60-min charts…

  • Charts I’m Watching: December 2, 2011

    Just to make it official, today is the long-awaited Day 150.

    UPDATE:  2:55 PM

    This morning’s gains fading fast.   At this rate, we’ll have a pretty bearish candle pattern on the day, too.

    UPDATE:  12:00 PM

    SPX has fallen back to a 5-pt gain.  Meanwhile, the EUR/USD slide has continued.  The 60-min chart broke decisively through its 200-period moving average and RSI trend line.  It shows very substantial negative divergence.

    DX, on the other hand, is testing its 200-period moving average to the upside, and is showing substantial positive divergence.

    More later.

    UPDATE:  11:00 AM

    Quick update on EUR/USD.  First, the big picture:

    And, the close up, showing the bearish Bat pattern playing out on the 60-min chart:

    And, here’s VIX, poking way down deep into its lower Bollinger band, and completing a Bat pattern on the daily chart.

    This morning’s spurt actually improves the look of the yellow channel lines I drew yesterday.  The lower parallel trend line does a better job of connecting the previous highs and lows.

    The 5-min RSI we were watching seems to have given up on the TL and is heading back down.  In short, the market is feeling very toppy here. 

    ORIGINAL POST:  10:00 AM

    We completed the Bat more precisely.  It called for 1254.44 and yesterday’s high was 1251.09.  This morning’s high so far is 1257.3.    The little Gartley fell by the wayside, and a bearish Butterfly took its place.

    We have negative divergence setting up on every time frame short of the daily chart.

    And, so far, the failure of even the 5-min RSI to break its resistance trend line.

    A clean break to the upside would be a warning that there’s more upside left.  Otherwise, we may have just seen the top.
     
    More later.

  • Clear the Decks: December 1, 2011

    EOD:  7:00 PM

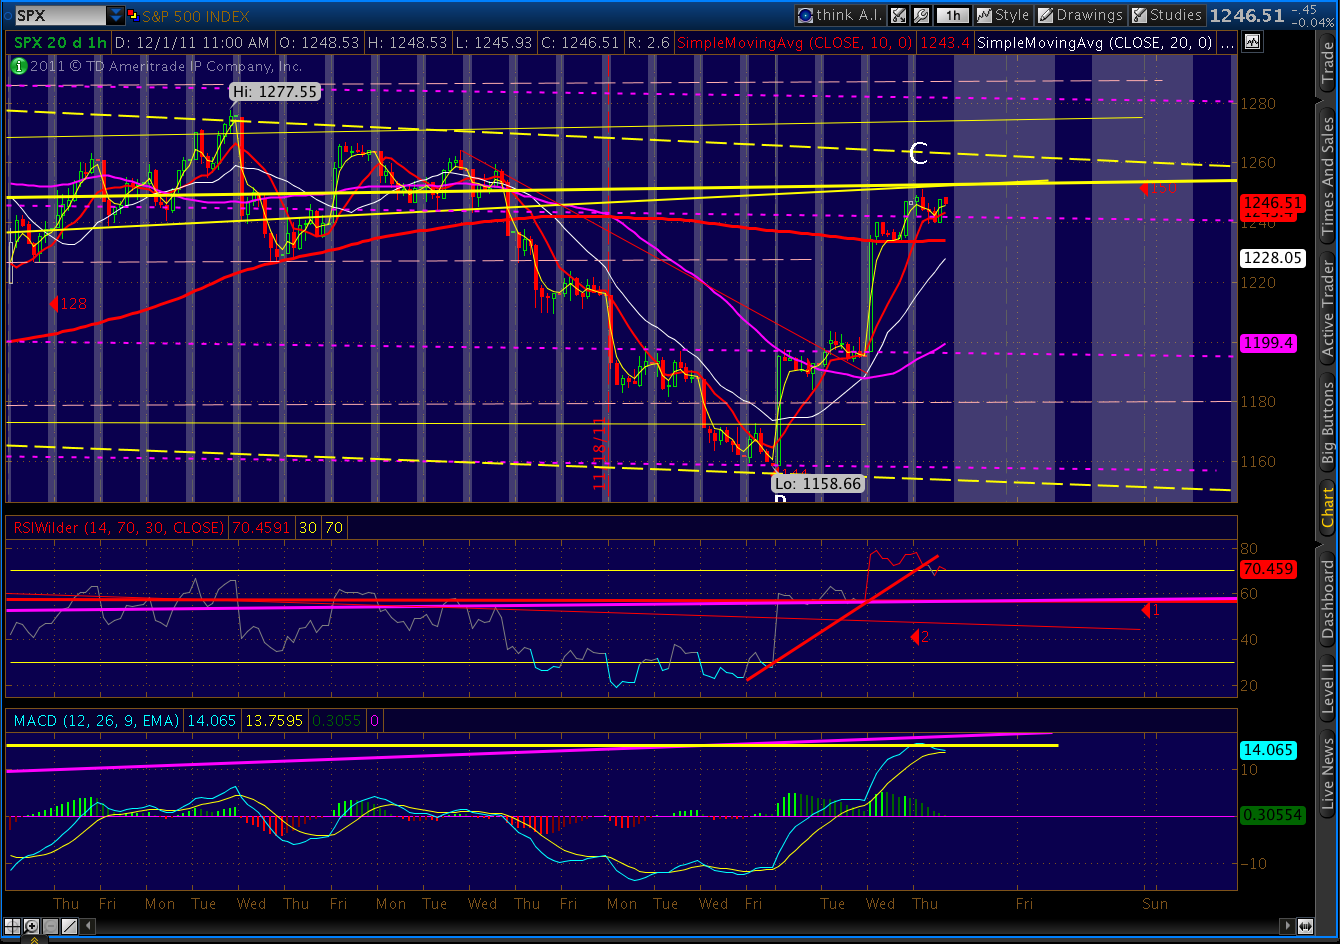
    The broken RSI trend line on the 60-min chart may or may not have completed its backtest.  If so, it was feeble, but may have been enough.  Regardless, the RSI hit a 6-month record high — significant in and of itself.  The hourly MACD also turned negative.

    Another interesting development today, we completed a Bat pattern on the hourly chart and most of a Gartley on the 15-min chart.  The Bat is seen below in green.  The small purple pattern seen at the terminus (near the letter C) is a Gartley, better seen on the 2nd chart below.

    On the 15-min chart, we can also see the makings of a symmetrical triangle.  These can break either way, of course, but the last symmetrical triangle we had broke for 100+ points to the downside.  And completion of this little Gartley could help it on its way.

    Extrapolating out, a competed Gartley could also set up a little head & shoulders pattern that would ultimately target 1215.    I’m always on the lookout for H&S; patterns on the way down after a big run up like we had.  Given the interim stops along the way up, there’s a good chance we get some cascading H&S; patterns on the way down.

    UPDATE:  3:15 PM

    If we do hold at these levels and the reversal begins tomorrow, this is what a Gartley Pattern would portend.  Shown here on the 60-minute chart:

    And, the daily chart:

    I’ve drawn the downdraft to 1121 because it’s the .786 Gartley target.  But, remember, Gartley’s can extend as happened on Aug 1.  The decline stalled at the .786 (1279), resumed falling to the 1.618 (1200) where it stalled again, and didn’t stop falling until it had reached 1101 3 days later at the 2.618 extension.  Lots of money left on the table during that plunge, including by yours truly.

    Just for grins, here are the corresponding values this go ’round:

     .786  = 1121 (-11%)
    1.272 = 1015  (-18.3%)
    1.618 =  940  (-24%)
    2.618 = 722  (-42%)

    If this is a 3rd wave down, any of those numbers is very reachable in the next few months.  Each of them is significant, too, corresponding with horizontal support or a major trend line.  But, I’ll address that topic if and when we head in that direction.

    UPDATE:  1:50 PM

    Just noticed the 60-min chart RSI has broken its trend line.  Not a good development for those waiting for more upside.  The MACD looks like it’s going negative by the end of the day, too.  With any luck, we’ll get a slightly higher high on the day, but a lower RSI on the backtest, setting up negative divergence on the 60-min chart. 

    ORIGINAL POST  10:40 AM

    This feels very much like the quiet before the storm.  Yesterday’s ramp is showing absolutely no follow-through as of yet.   Even the mainstream media, after a day of deep thinking, has realized that the central bank love fest, while leaving everyone feeling all warm and tingly for a day, is likely to result in an embarrassing new rash.

    Here’s a quick look at our daily chart:

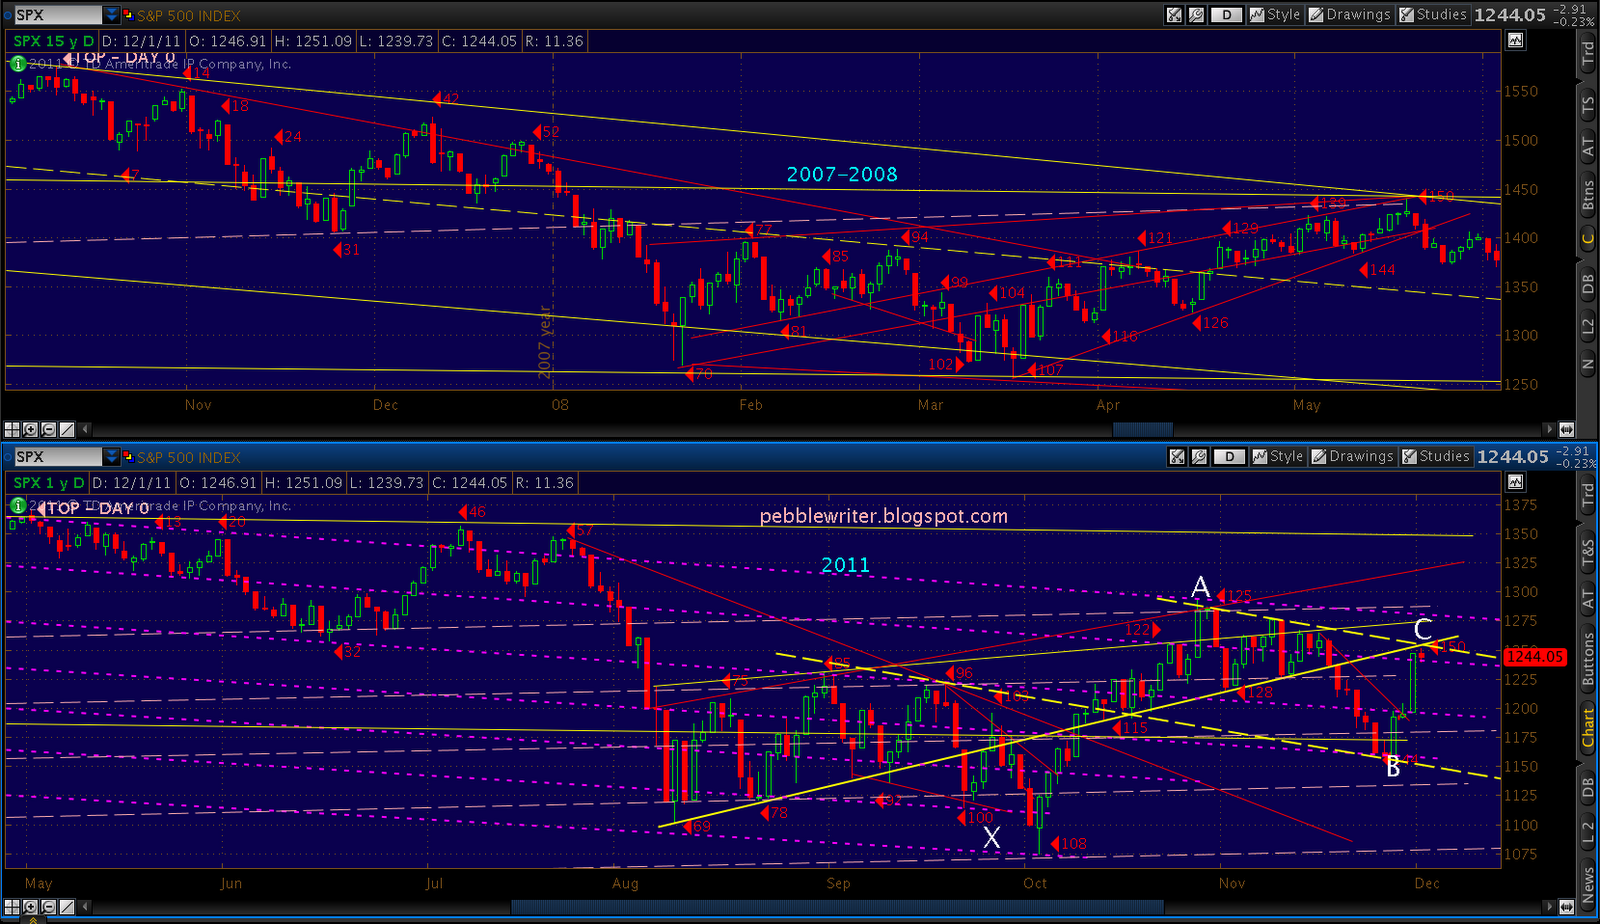
    Note we’re reached the apex of the triangle we talked about so much over the past two weeks.  It’s formed by the trend line down from the Oct 27, 1292 high and another trend line up from the Aug 9 low of 1101.   I originally charted the apex as December 2 or December 5, but it looks to be about there now.

    I’ve labeled this as Point C of a potential Gartley pattern that started with Point X at 1074, Point A at 1292 and the crucial .618 Fib Point B at last week’s 1158.   If the pattern plays out, the next stop is Point D at the .786 Fib level, or 1121.  This is a significant 10% move in the very near future.

    Could we go higher?  Absolutely.  Many Elliott Wavers insist we will.  But, I have very strong reservations.

    Take a look at the descending red RSI trend line.  Note that it’s stopped six advances in their tracks.  The only time the RSI broke through was the 1292 high, which I have always viewed as an overshoot.  We’ve bumped right up against it a 7th time.  The odds favor another downturn.

    The purple RSI trend line, which has acted as support since August 8, was broken on Nov 16.  Since then, it been in back test mode.  Yesterday’s advance brought RSI all the way back to the line, but it couldn’t climb back on top.  This adds to the bearish case.

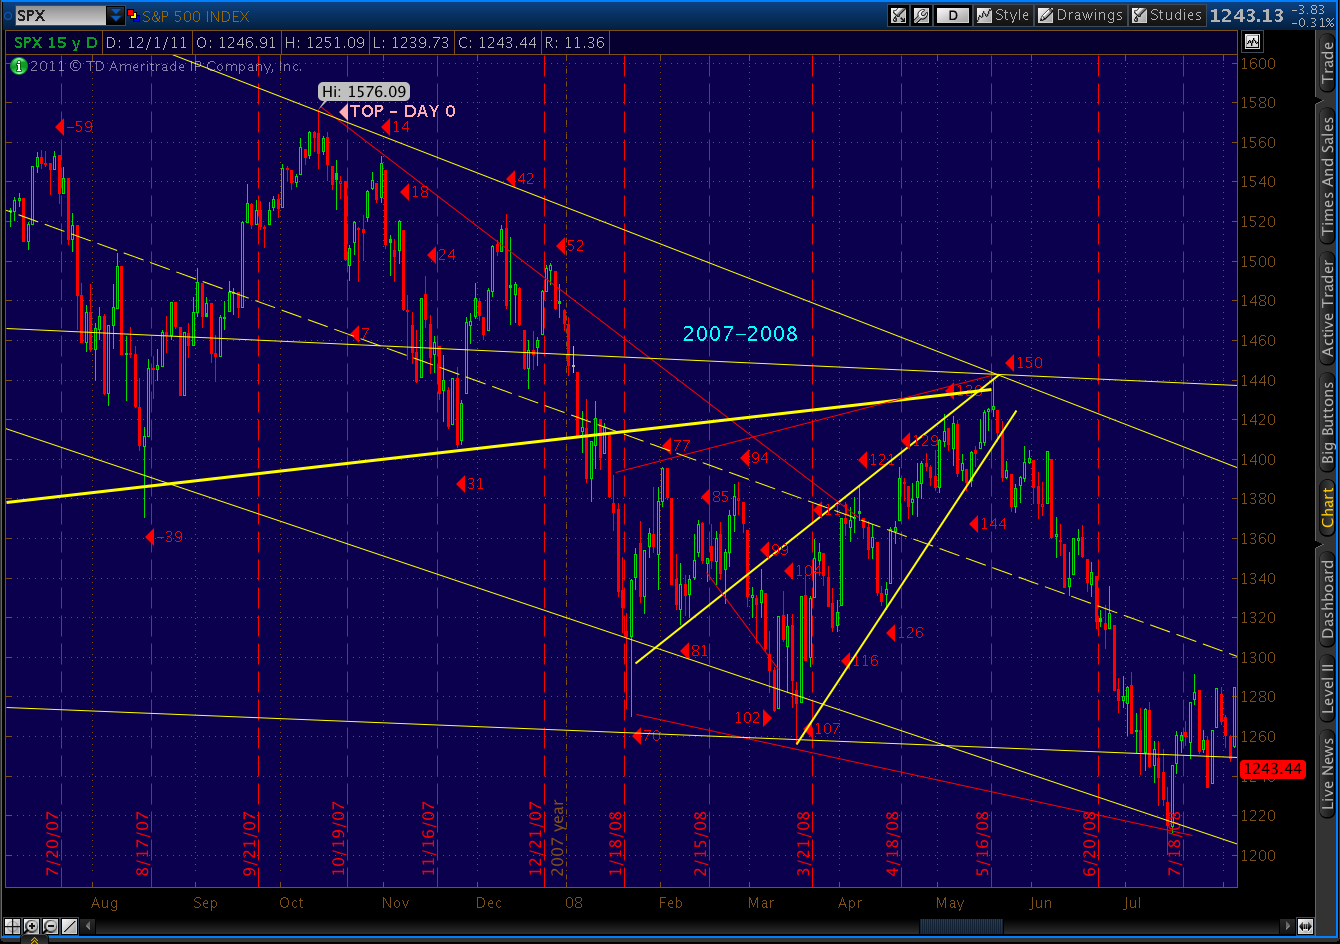
    Tomorrow, of course, is the 150th day since the 1370 May 2 high.  In 2008, the 150th day was the beginning of the final 10-month, 50% plunge.  While the price comparisons have become less relevant over the past few weeks, the timing of several reversals has been in sync.  Here’s a current look:

    BTW, the beginning of the end in the 2000 topping pattern occurred 157 days after the high.  The 2000 equivalent of our 1292 (day 125 in 2011) occurred on day 112.  There are other similarities, such as our July peaks (days 46 and 57), and some pretty major divergence in terms 2001’s days 67 – 112.

    But, the inescapable similarity is that day 157 completed a back test of the trend line off the pattern lows (the solid yellow line coming up from day 15.)  We’ve done the same here in 2011, and I expect the results to be similar.  The 2000 market lost 25% over the next 4 1/2 months, 35% over the next 10 months and nearly 50% over the following 20 months.  Here’s a better view of all three tops:

    2000 Top and Back Test

    2007/8 Top and Back Test

    2011 Top and Back Test

    Next, the parallel, downward-sloping channels (purple, dashed) that have guided this market since last February argue for a reversal right about here.  The line currently in play got the party started when it stopped the Feb 18 advance.

    It subsequently stopped the April advance, several May declines, a June advance, the initial July decline and movements both ways of 8 of the past 28 sessions. There’s something very symmetrically pleasing about a trend line that extends from the first day to the last day of a market top.

    Last, when we add parallel trend lines to those which define the above-mentioned triangle, we can see pretty nicely defined channels.  The pair of solid yellow lines guided the market up from the August lows.  The pair of dashed yellow lines have guided the decline since the 1292 high.  This channel also argues for a reversal at this point.

    The day is young, but we’re establishing a candle pattern that looks suspiciously like those of Jul 22, Aug 22, October 28 and Nov 25.  I’ve taken profits on most of my long positions and am easing into an overall short position.  If I don’t see a resumption of the upside momentum muy pronto, I’ll likely set up for a fairly strong reversal in the next day or two.

    Good luck to all.