Month: July 2011

  • A friend just tipped me to the fact that Elliott Wave International pronounced yesterday that 2011 and 2007 exhibit a “similar topping pattern.”

    OH!  MY!  GOSH!

    I only wish I had had this very valuable information when I posted back on May 31.  Oh, wait, I did.  When I made the exact same observation.  But wait, there’s more.

    Now, only 36 points away from completing an obvious H&S; pattern, EWI says this market has a head and shoulders look about it.  To me, this is like predicting the Giants might win the World Series — as Nelson Cruz started to swing at Brian Wilson’s 3-2 pitch in the bottom of the 9th in game 5. 

    In reality, the pattern was visible when I posted on June 21 and we had just completed the “head.”

    EWI goes on to describe the similarities, including the internal trend lines, broken support line and backtest that I describe in detail in early June [here and here].

    Last, EWI questions if there’s any forecasting benefit in analyzing this chart.  Aside from the limited benefit in showing a similar psychological progression, they “haven’t found any price and time relationships between the two moves that would allow a more specific forecast.”

    HUH!?!

    Pardon me as I set the record straight.

    **********************************************************************************

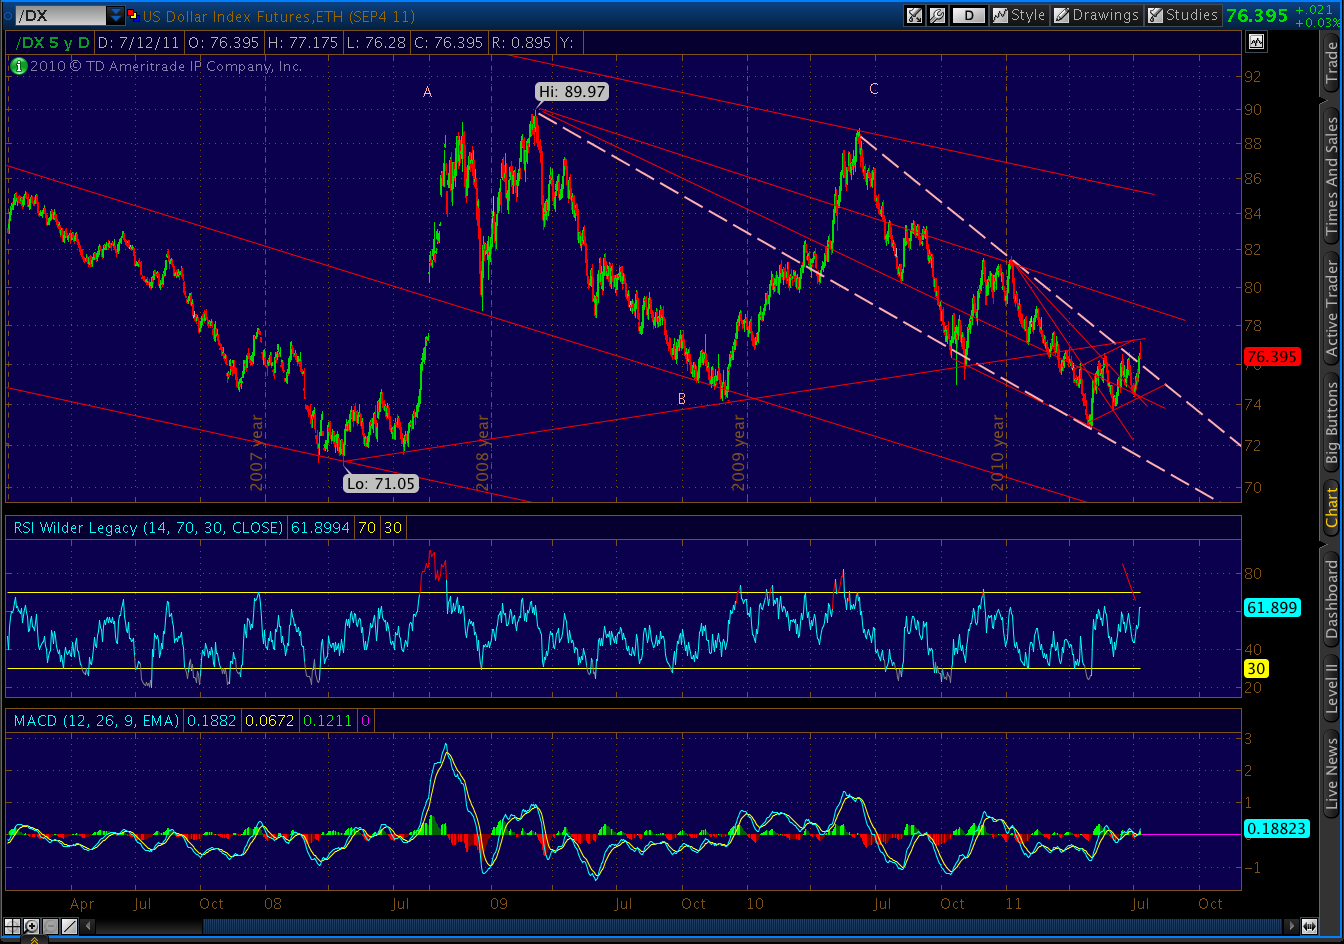
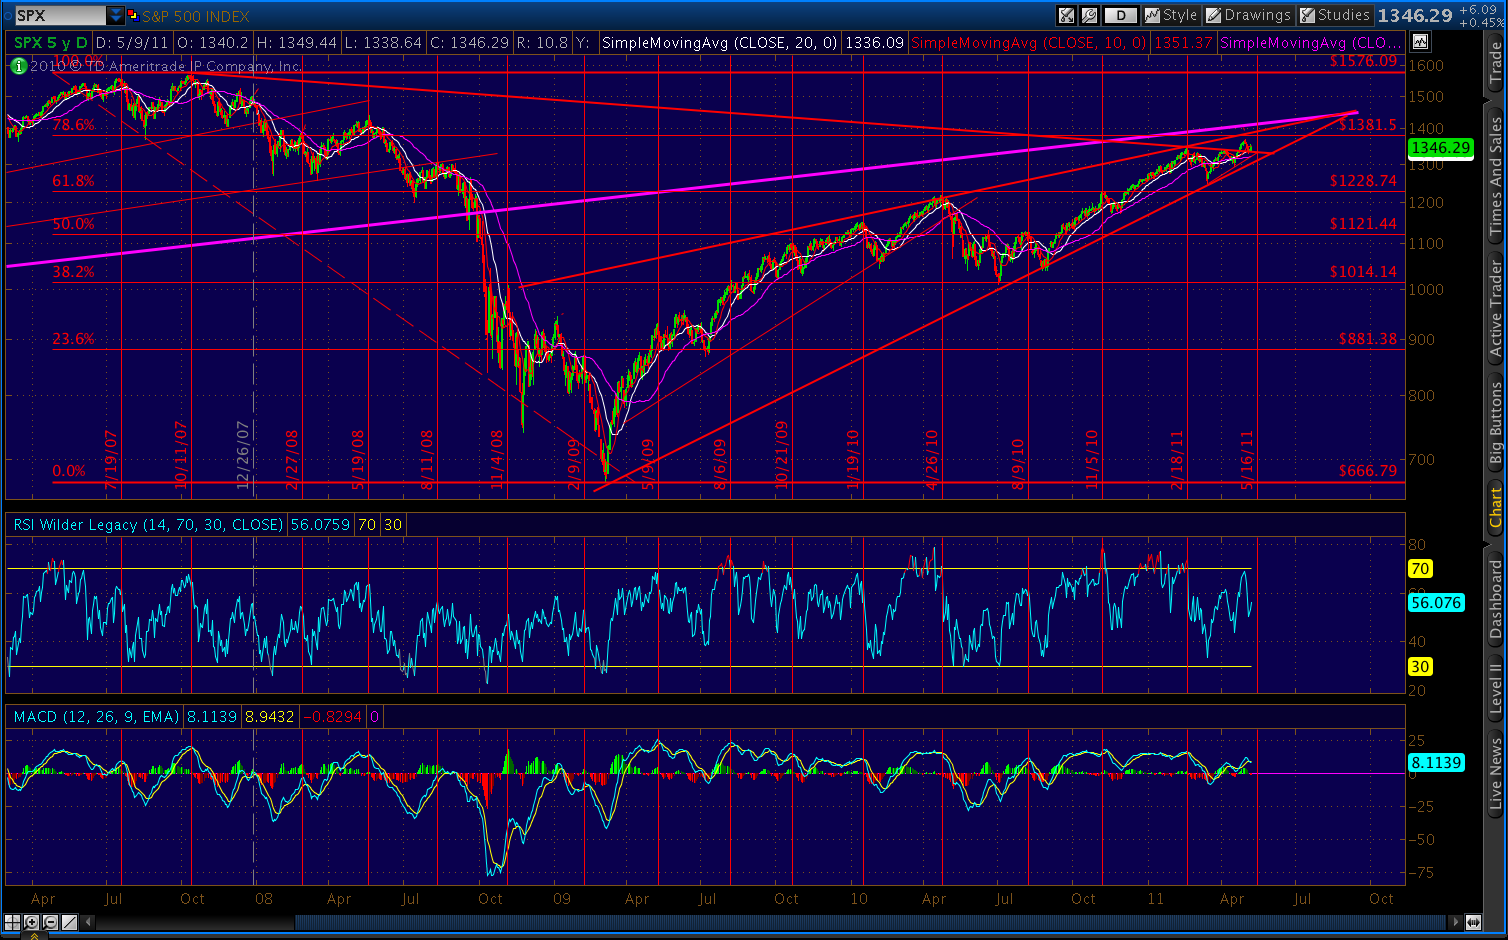
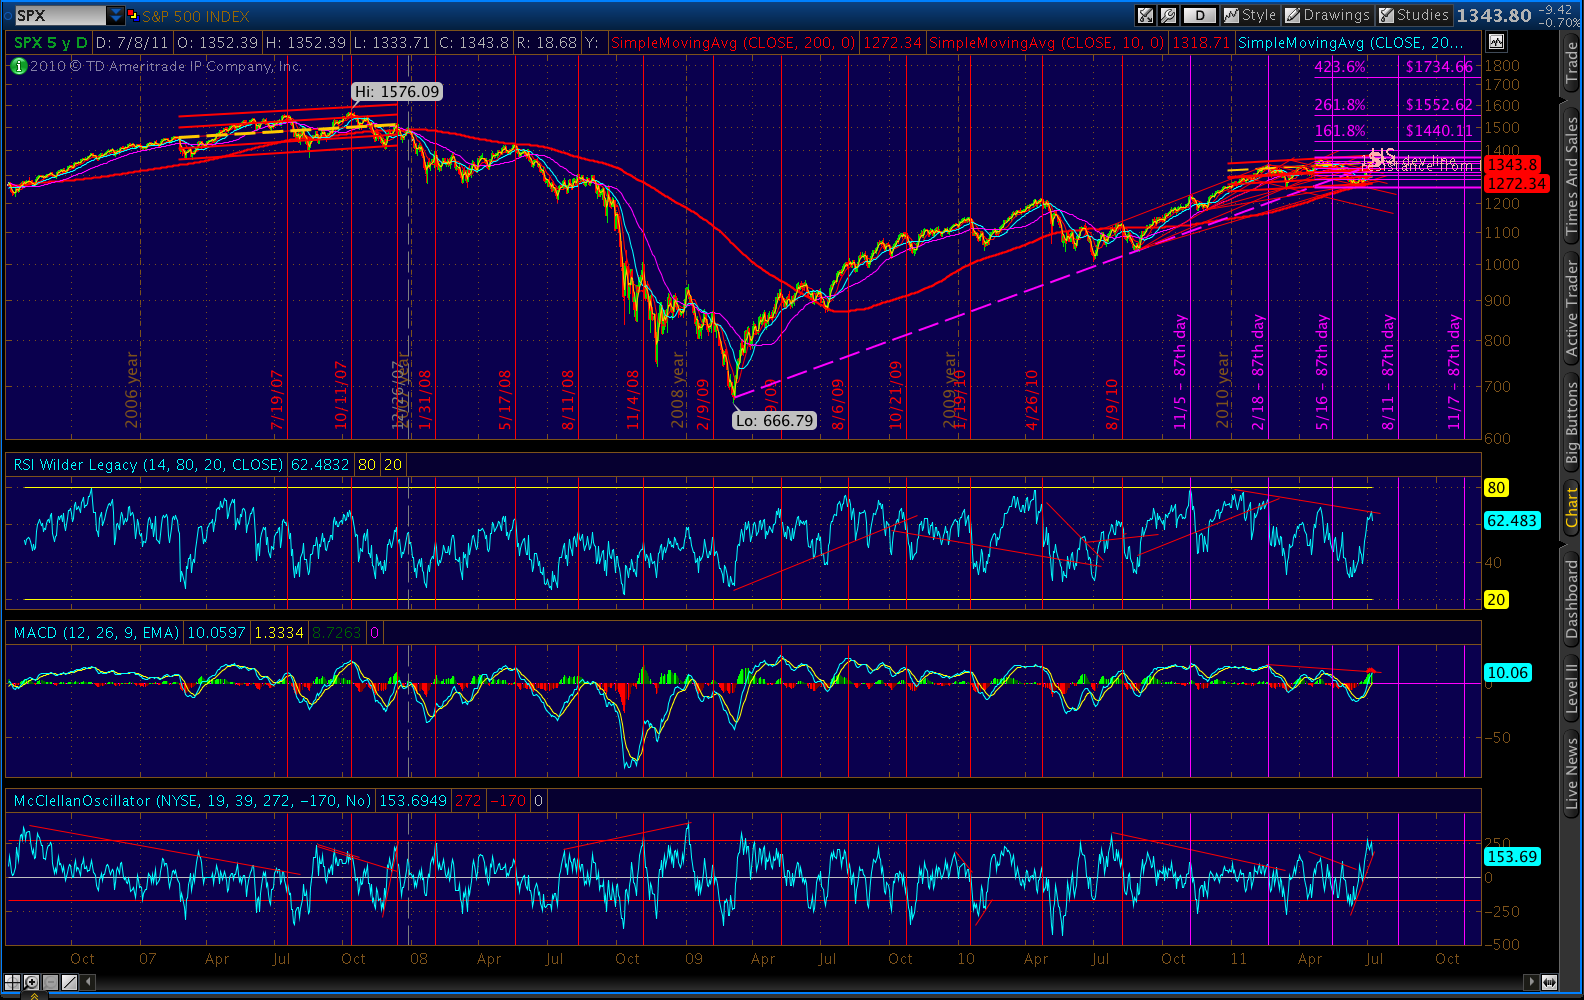
    Back on May 31 [Why P[3] is My Top Bear Count] I noted “significant similarities between the past few months and the tops in 2000 and 2007.” 

    On June 3 [Here We Go] compared the market action between the patterns as related to breaking and backtesting the long term support trendline.

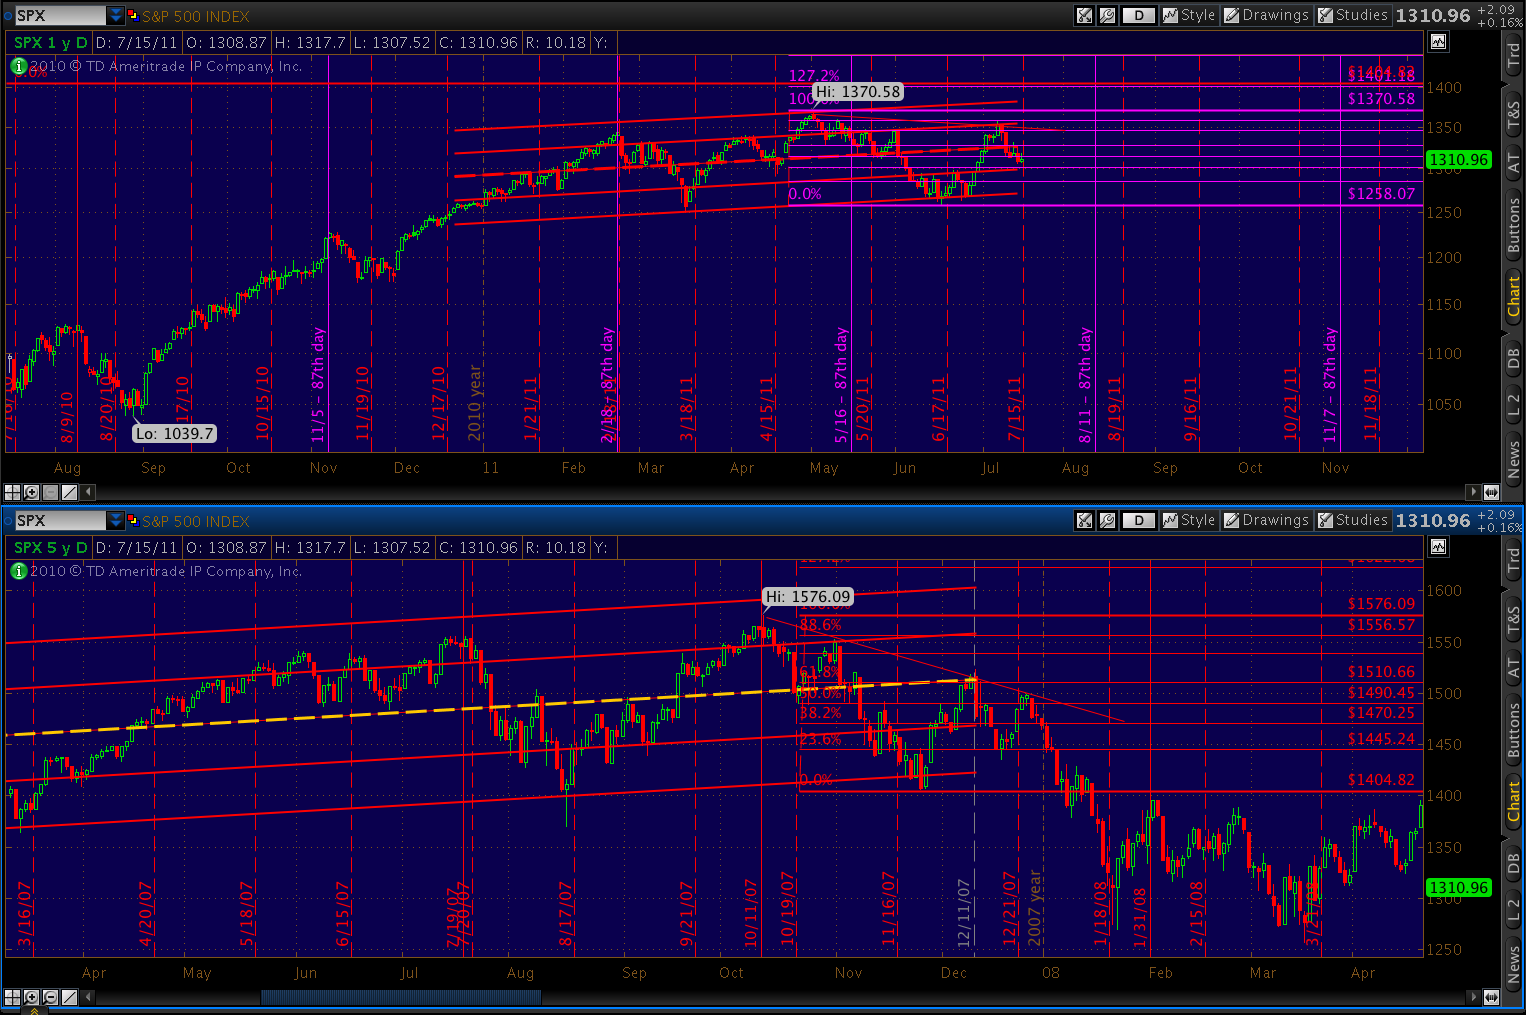
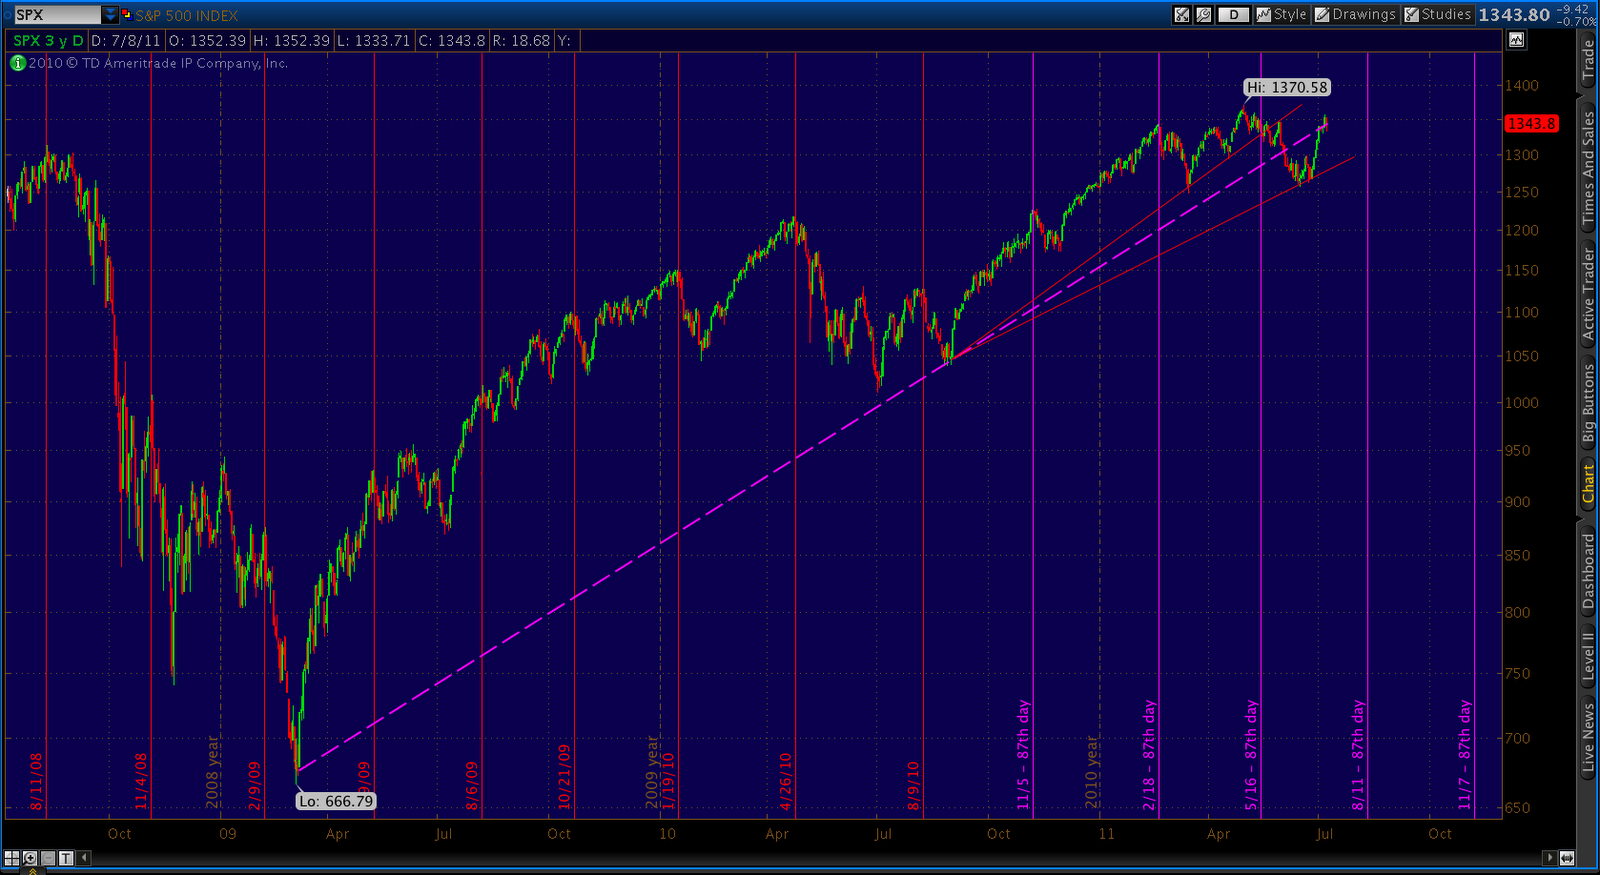
    On June 8 [Deja Vu?] detailed the pattern that the 2000, 2007 and 2011 tops had in common, noting how the market, “once it drops below its long-term support, looks like it’s in for a free fall.  But, it eventually finds new support in a parallel channel as I theorized a few days ago.  The bottom of the channel is drawn off a recent major high and the top is drawn off the two most recent peaks.  It pencils in nicely for 2000 and 2007…”

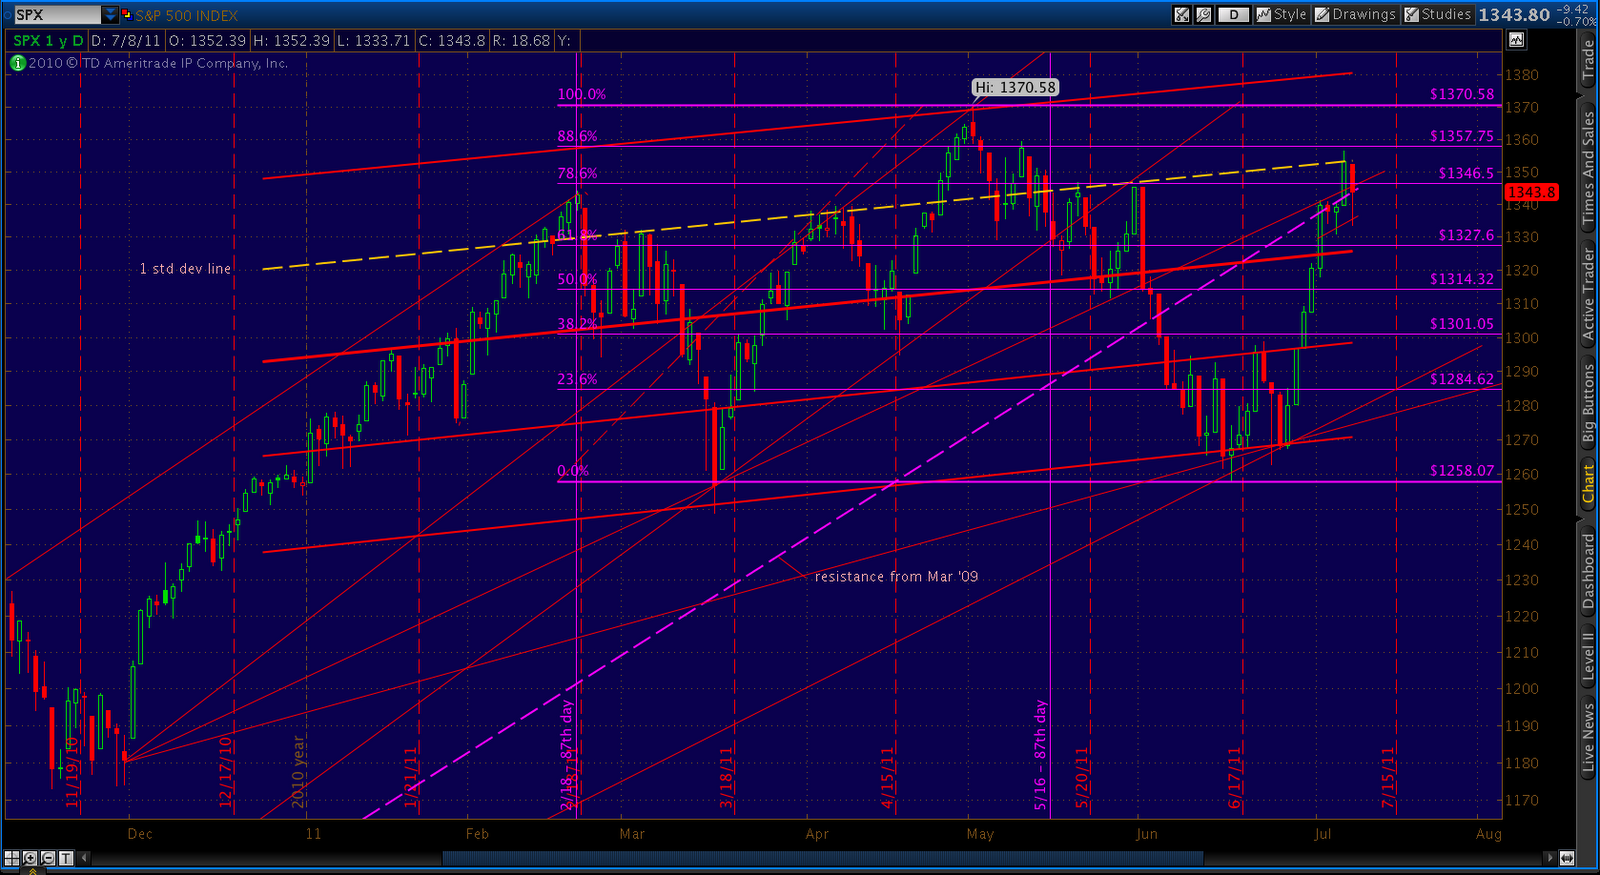
    On June 10 with SPX below 1270 and amidst warnings of “flash crash!”, [Channel Surfing] showed how the pattern (accurately) promised one last return to the midline of the regression channel at around 1330.  I showed how the channel I’d drawn corresponded well with a 2-standard deviation regression channel.

    On June 12 [Update: Channel Surfing] reported that almost every major top since 1928 exhibited the same pattern.  I suggested that the pattern was not only characteristic of tops, but a requirement.  I formalized the description as:  “…characterized by a multi-month pattern within a rising market that has at least two significant touches (of the index or its Bollinger Band) of at least 1.5 standard deviations on the upper and lower extremes of a regression channel commencing after a post-correction new high.  It’s capped off by a third touch on the lower boundary and subsequent return to at least the midline before a final plunge to new lows. “


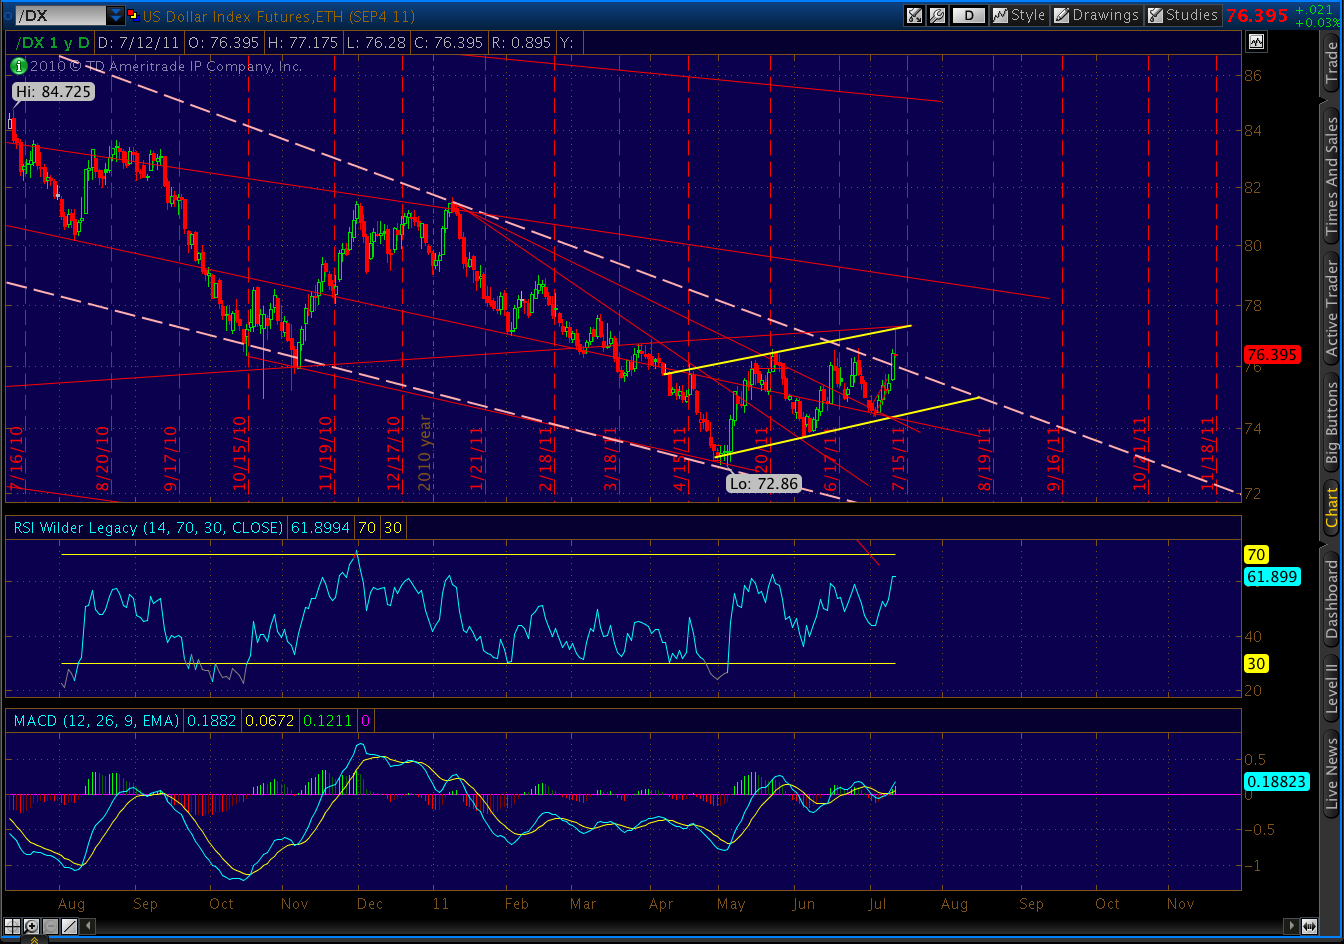
    On June 16, [You’ve Got a Fan in Me] showed how the regression channel could also be defined in terms of fan lines from significant previous high and low pivot points.  I used examples from 2007, 2000 and 1937 to demonstrate.  The prior day’s post [Playing the Bounce] used the pattern to call the bottom at 1261.90 (it was the next day at 1258.07.)

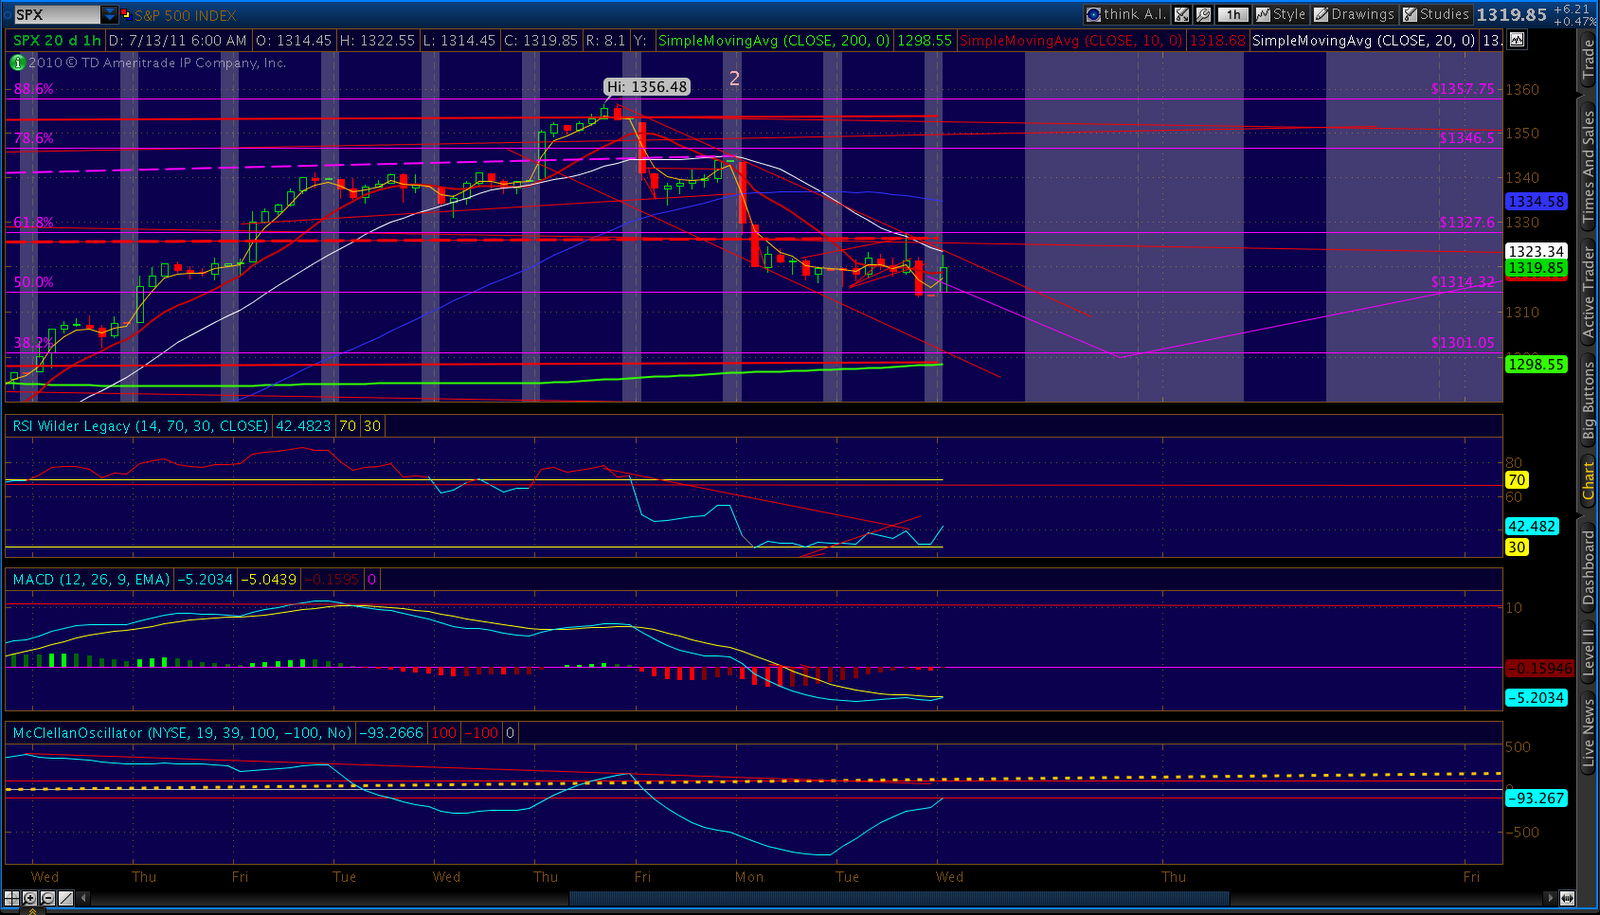
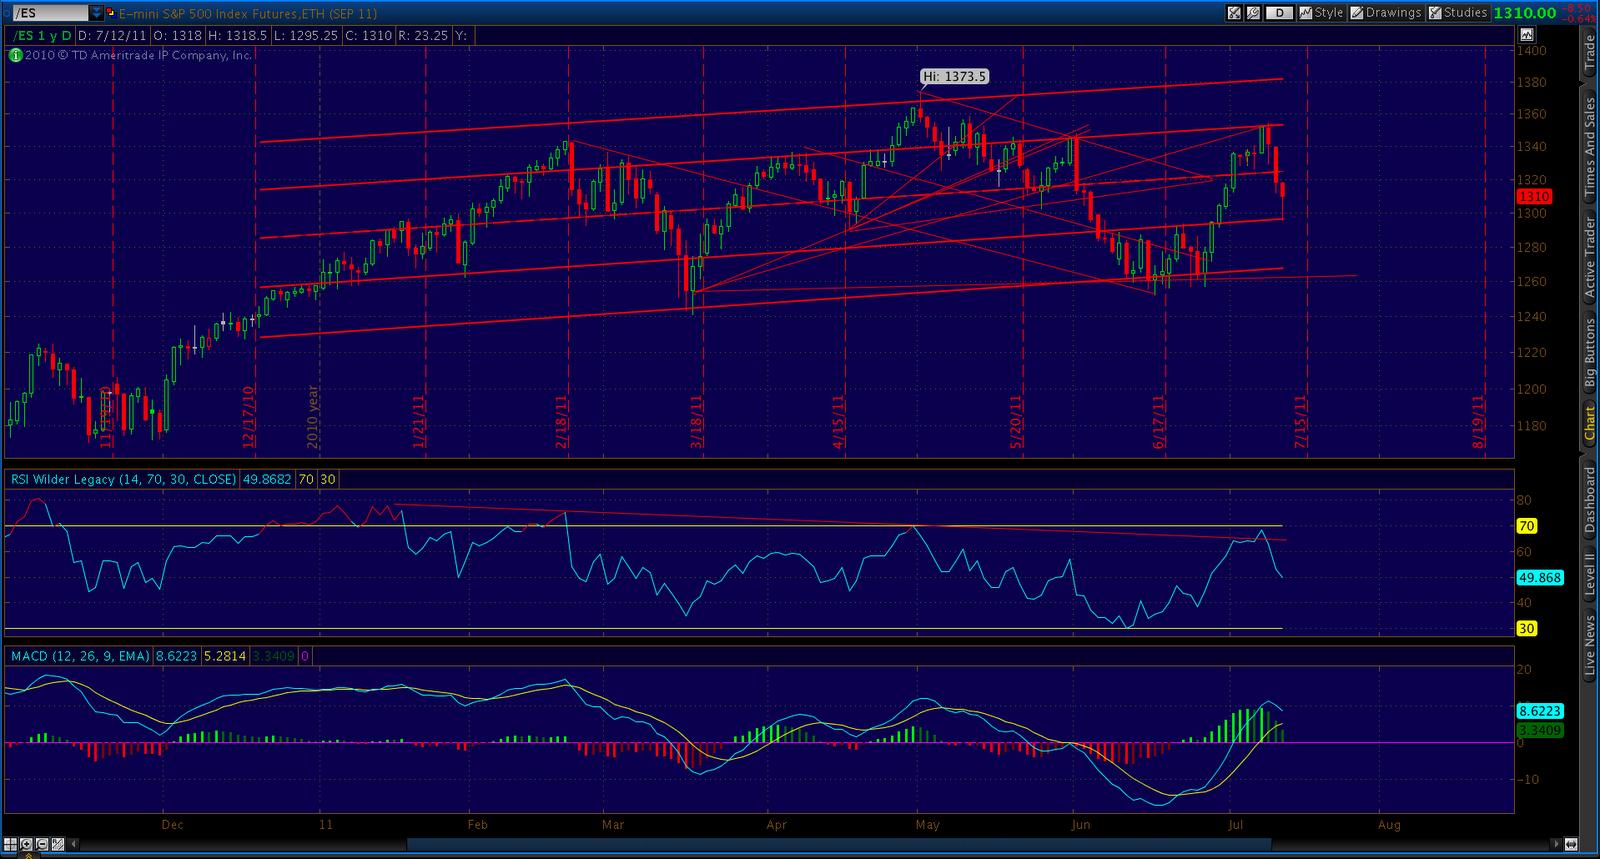
    On June 21 with SPX at 1294, [A Different Perspective] discussed how a return to the pattern midline around 1327 and subsequent fall would create a huge head and shoulders pattern that, by mid-August, would begin a decline to around 1200.

    On June 23 [Deja Vu, All Over Again] showed how the 2000 and 2007 patterns corresponded, beat for beat, and charted the various trend lines that would govern the pattern’s completion.  With SPX at 1287, the pattern still indicated a 1320-1330 target.  I reiterated the pattern prediction the following day in the midst of the 25 point intra-day plunge triggered by the strategic petro reserve decision.

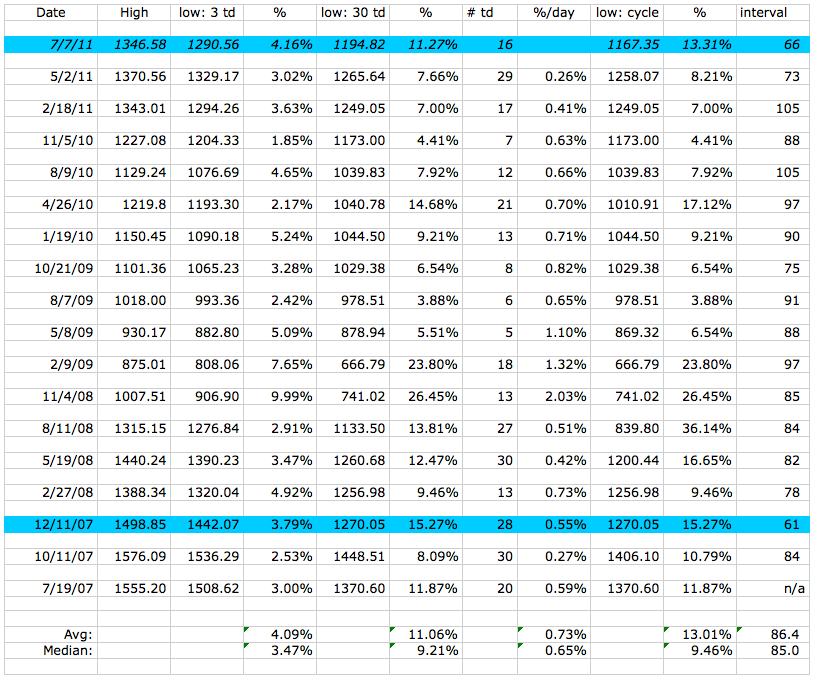
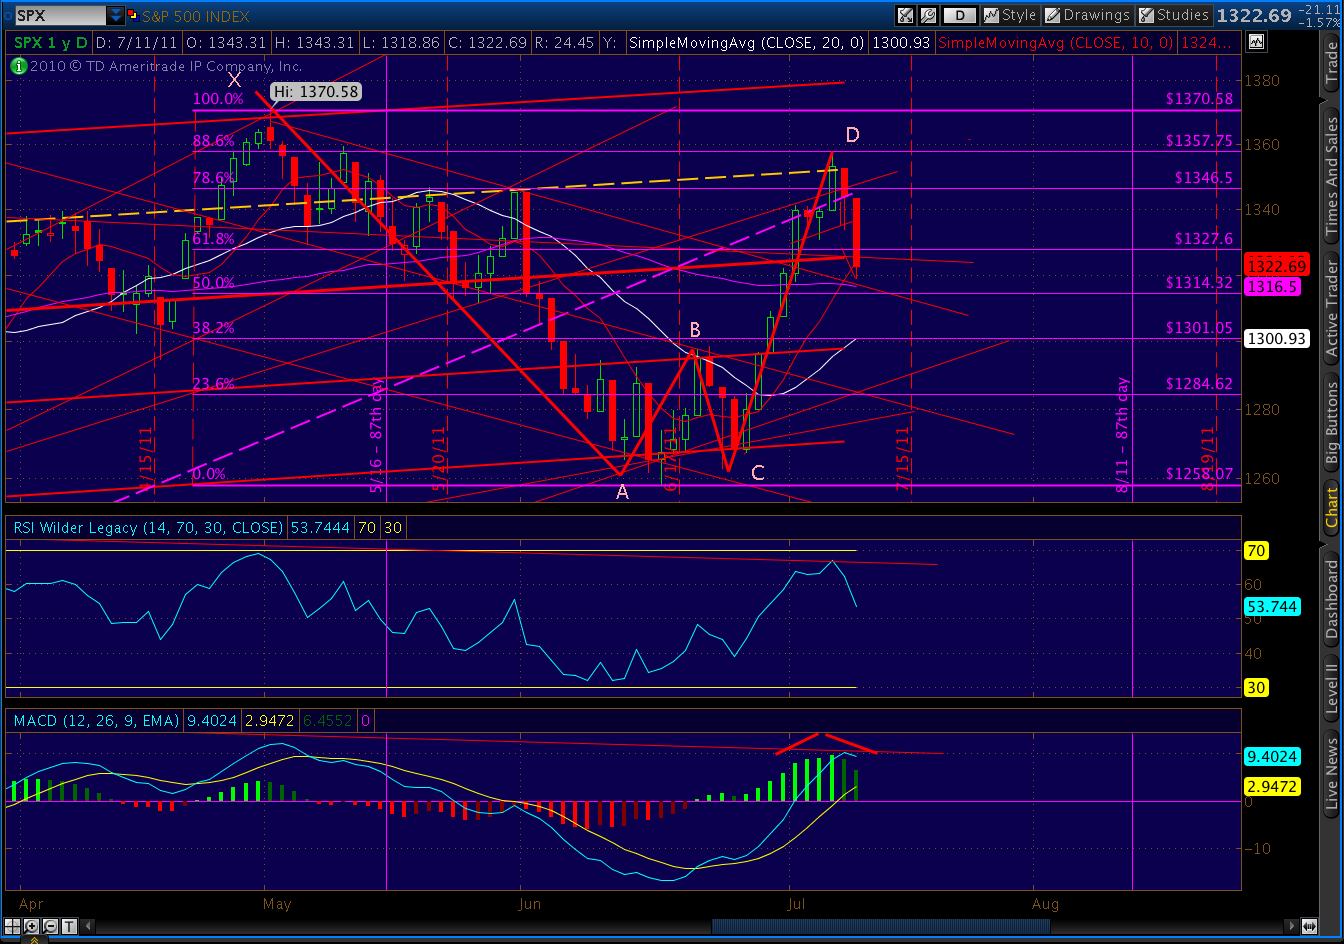
    On June 26, [Cliff Diving] defined the decline from 1370 to 1258 as 1 of (1) of P[3], and the subsequent rise a corrective wave 2.  I suggested the pattern interim target might also follow fibonacci guidelines.  The midline, at 1322, was virtually the same as the .786 Fibonacci retracement line.  With the market back to 1268 and bearish sentiment through the roof, I suggested the pattern would take us up 54 points in 5 days.  It took 4.  As I suggested on June 29, we would likely even overshoot (we did, hitting instead the .886 Fibonacci retracement.)

    In June 29th’s post [Lunatic] I restated that contrary to popular opinion, the rally would not lead to new highs, but would merely complete a corrective wave 2, followed by wave [i] of 3 to around 1300 (it’s reached 1306, so far.)

    On July 4, [Final Destination] suggested the next move down would stop north of 1298.61 in order to keep the bullish count alive.  So far, so good.

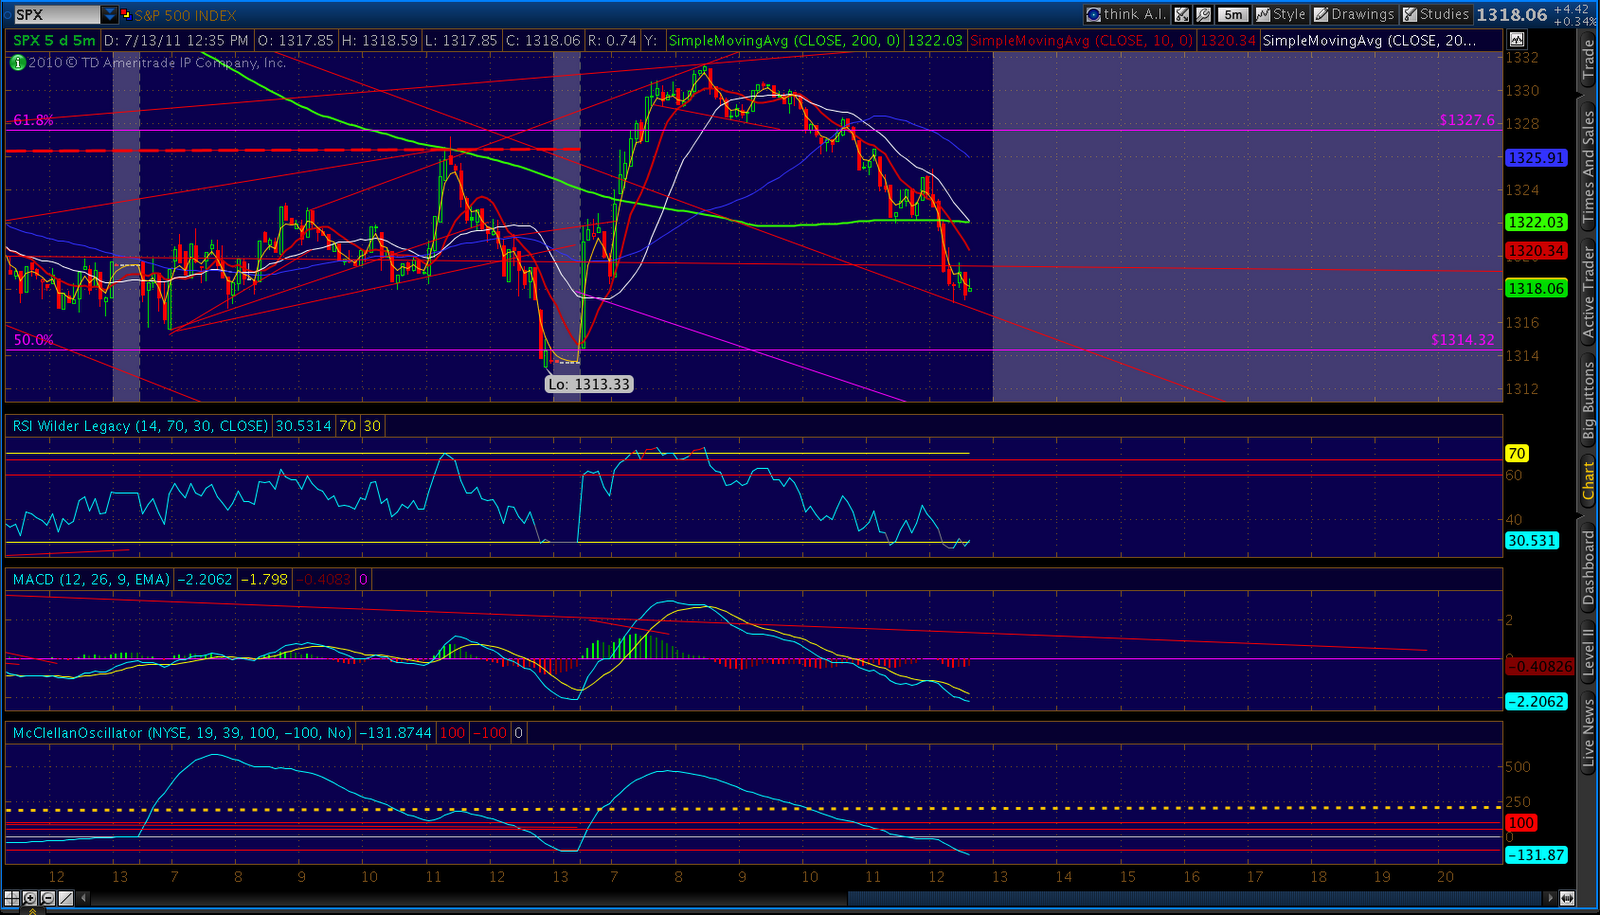
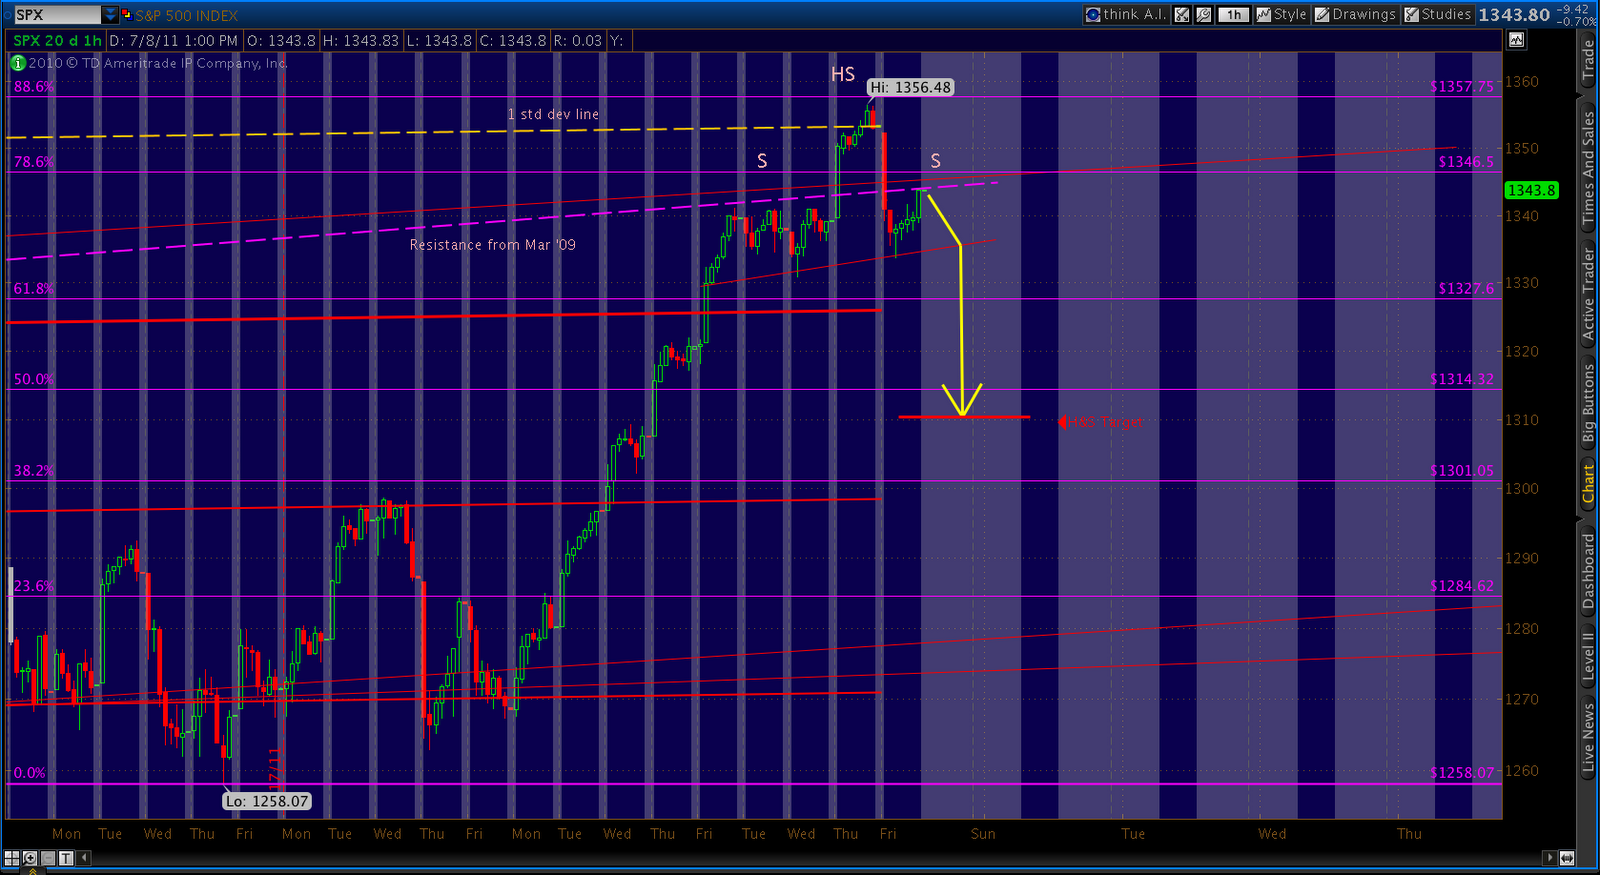
    On July 7, [Confidence Fairies] and [Then and Now] suggested we had reached the pattern high at 1356.87 right at the .886 Fibonacci level.   The next day began a 5-day, 46-point decline.  In [Friday the Bear Came Early], I suggested the peak was in — earlier than the 87-day cycle would indicate because that’s what happens in market tops.

    When a big decline the next morning was quickly reversed and seemingly everyone turned bullish [She’s Come Undone]  explained this was simply a throw-over, and that the pattern 1-standard deviation line had stepped in for 2007’s channel midline in defining the top and preventing any further advances.  SPX declined 27 points the next day.

    ***********************************************************************************

    We haven’t yet completed the pattern, and anything could happen between now and then. 

    But, pardon me for observing that a pattern that correctly predicts three bottoms and two tops in less than 60 days has some freakin‘ “forecasting benefit.”

    I

  • Intra-day July 15, 2011

    UPDATE:  11:45 AM PDT

    Just a quick recap of where we are:

    Fairly neutral at the moment, other than some longer term bearish bets I established last week.  Took profits yesterday on most of my shorts, and actually bought a few SPY calls this morning, nothing big. We have to get OPEX out of the way first, as prices are caught in that tractor beam.  But, until the debt ceiling issue is resolved, I can’t see a lot of big moves either way.  Looks like we’ll close at 1315 or 1310.

    The MM’s make money on volatility, so we keep seeing these little breakouts that go nowhere (just a minute ago, TICK was -982, no follow-through) just to bring suckers into the game.  In the meantime, we just range down into this falling wedge, currently bounded by 1305-1313.  The apex is Monday, but that doesn’t matter as we’ll just redraw it until there’s resolution.

    I can’t imagine that we wouldn’t get a good-sized pop when the news breaks, but after the celebration dies down we’re still in a sucky economy with even bigger debt problems, euro problems, political stalemate, etc.  The USD should rally up and keep going, only because it’s (at least temporarily) in better shape than the EUR.  But, I’m expecting the equity rally to die off pretty quickly, probably no higher than 1345.  I think by mid-August at the latest, we’re looking at 1200-1230.

    Just want to reiterate, go back and look at 2007.   We don’t have to trade every expected move.  Those that missed the 110 pt runup from 11/27/07, got a 70 pt runup 2 weeks later.  Those that missed the 12/11 top got another shot two weeks later.  Even bulls who clung to their longs got bailed out when the market backtested the channel bottom for FIVE MONTHS before finally rolling over for good. 

    Many expect a flash-crash kind of crack, and sure it could happen.  But, history is on the side of gradual declines, 1% day after day over weeks or months before capitulation by the big guys makes huge declines possible.  Remember that the bulk of investment capital is with institutions that have an equity allocation that varies very little from day to day, even year to year.  It takes a lot to get them out of stocks, especially when the alternatives are equally bleak.

    Good luck to all.

    ORIGINAL POST:  6:30 AM PDT

    Today’s dominant themes are the expected debt ceiling breakthrough, lukewarm economic news and options expiration.  It’ll be a battle to see which exerts the most pressure, although any debt ceiling news should trump.

    Stocks have formed a narrowing/consolidation pattern typical of OPEX, taking the form here of a falling wedge, while DX has formed a rising wedge.  As discussed yesterday, both should break out on news of a resolution, but only the dollar should be able to sustain the bump.  I’m working on a more precise target for stocks, but I suspect it will be in the 1345 area.  It should test, but not break, the 1356 highs from the 7th.

    I used yesterday’s lows to take profits on riskier downside bets, and swap out trades to better position myself for the updraft that could occur any minute.   Today, I expect we’ll follow the pattern of the past two days, where we open higher but drift back towards the bottom of the falling wedge around 1300-1305.  The 1298 high from 6/2 appears safe for the time being.

     There’s a pretty stiff penalty for being wrong on timing as volatility remains high.  There is also still a small, but real risk that Congress blows it, and we don’t get a deal on time.  The safe stance is to scale back on short-term bets and use price swings to establish or add to longer-term positions if opportunities present themselves.

    More later.

  • Intra-day: July 14, 2011

    UPDATE:  10:25 AM PDT

    The hourly MACD and histogram just went officially bearish.  But we should get a bounce soon, as 1298.61 is just around the corner.  That level is important to bulls still looking at this as a corrective wave for the bull run.

    UPDATE:  7:30 AM PDT

    Here’s the H&S; setting up on SPX.

    UPDATE:  6:15 AM PDT

    There’s a possible H&S; pattern setting up on the S&P; 500 — seen here on the hourly futures chart. If it completes, it points to 1283 on the downside.

    With any decent decline today, we should finally see the SPX histogram turn negative and a bearish STO cross on the daily charts.

    ORIGINAL POST:  4:40 AM PDT

    The market seems to like what it sees in the JPM earnings report.  Haven’t sorted through it yet, but I wouldn’t put much stock in it, as bank earnings reports are masterpieces of obfuscation lately — particularly with respect to loan loss reserves.

    In the meantime, I’m watching what could turn out to be another bearish Bat Pattern evolve.

    If the market rebounds strongly over the next few days with a debt ceiling solution, watch for a reversal in the 1342-1348 area (/ES).

  • Dangerous Waters

    UPDATE:  9:30 AM PDT

    Despite generally better than expected economic and earnings news this morning, we formed most of a Head and Shoulders pattern in the futures prior to the cash market opening.  I decided to wait and see how it played out before scaling back my shorts.  We have since completed it, and a downside to 1283 is indicated.  I’ll stay short to play this out, but lower stops in order to protect profits in the event of a debt ceiling breakthrough. VIX is trading at its highs for the day, so I’m not the only one expecting greater volatility ahead.  The OPEX gang will have their hands full trying to keep things in check.

    ORIGINAL POST:  4:00 AM PDT

    There is a dizzying array of cross-currents at work in the markets, now.  The sharks ripping into the Euro have finally noticed the Dollar’s lifeboat is leaking.

    Thanks to Bernanke’s testimony (more today!) before Congress, the prospects for additional QE refuse to fade.  I believe the Fed would face a very difficult political battle in instituting an additional round unless markets were to take a serious tumble.  But, as we’ve learned on many occasions, just the hint of QE is often enough to accomplish the Fed’s goals.

    Equity markets, however, are at risk of decoupling from the dollar’s fate.  In recent weeks, a bull run in the Dollar meant a risk-off environment.  Investors turned our cash as a safe haven (ludicrous, no?) from Euro concerns, for instance, dumping equities and other “riskier” assets such as commodities.  With the dollar increasingly suspect, will the inverse occur?

    A dollar that’s weaker due to the Fed’s manipulation — sure.  But, a dollar that’s threatened by Congressional failure to address the debt ceiling, I have my doubts.  If the worst case scenario were to occur and the US actually did default, there would be immediate and catastrophic effects.  One obvious effect would be skyrocketing interest rates — hardly positive for stocks, or for the economy from which US companies still derive half their earnings. 

    I have little doubt that Congress will ultimately pull the trigger on the debt ceiling.  My concern is how much damage they’ll do in the meantime, waving loaded guns around without the safetys on.  As markets grow increasingly alarmed about the possibility of a default, we could see a scenario where stocks, the Dollar and the Euro all tumble at the same time.

    When a deal is reached, the relief could be immediate and powerful.  The Dollar would be “out of danger” and will soar — at least relative to the Euro.  Equities would, too, but how much?  An immediate relief rally would be tempered by the realization that the forces threatening the US economy are still with us.  From a macroeconomic standpoint, of course, the risks are much greater as debt increases.  At some point, printing more money won’t cure that ill.

    The net outcome, as I see it, is that we experience a brief but dazzling relief rally in equities to accompany the Dollar’s more sustained push.  But, as it dawns on investors that we’re now heading for an even worse fall from a greater precipice, equities should resume their downward march.

    Will the Bernanke put come to the rescue?  Of course he’ll try, pulling out whatever stops are necessary.  But, it’s possible the markets are finally on to him.  We had a hint of that during his testimony today, when the rally during his remarks faded as quickly as it arose.

    As these cross-currents swirl about us, I expect markets to be exceptionally volatile.  In addition to the above factors, we have loads of important earnings and economic data coming today and tomorrow.  And, to add to the machinations, Friday is an options expiration day.

    My personality is to try to anticipate each and every turn, reacting with cat-like reflexes and pouncing on opportunities nano-seconds before the markets catch on to my master plan.  The reality is that I’d likely make my broker a lot of money in commissions as I flail about, blindly reacting to headlines, always 5 minutes too late to avoid losing money.

    Thus, I think this might be an excellent time to rein things in a bit.  I have been net short for several days, but will pull some money off the table and hedge the rest for the next week or two.  I’d rather miss some profit opportunities than lose a bundle when the futures move against me overnight or over a weekend.

    As for today, I think it could go either way.  Indications are that stocks will drift lower today and tomorrow, possibly to 1295-1300.  At that point — sooner if the debt ceiling impasse is resolved — we should get a bounce.  If the impasse gets uglier and/or the earnings/economic news even worse, expect the plunge to get uglier.  Remember, we have the above scenario where everyone heads for the exits at once.  While I’m expecting cooler heads will prevail, it remains a distinct possibility.

    A month from now, equity markets should be significantly lower.  But, I think it’s going to be a wild ride.

  • Intra-day: July 13, 2011

    UPDATE:  12:40 PM PDT

    The rally looks to be almost done, with SPX giving up almost all its gains and back to 1318.  We’ve completed a rounding top here, but could complete a larger one if the drop continues to 1313 — where we started the day. 

    If, as I expect, it breaks out to the downside, the target is 1295.

    http://thepatternsite.com/roundingtop.html

    UPDATE:  10:30 AM PDT

    Watching the /DX, which fell pretty hard during BB’s comments.  It seems to have been an overreaction to the possibilities of QE3.  We went down and tagged the 10, 20 and 50 SMAs, are bouncing back now.  I continue to think we’re backtesting the falling wedge breakout and will see the move up continue to at least the 77.5 area by the end of the week.

    UPDATE:  8:45 AM PDT

    Divergence setting up on Gold intra-day charts.  Could be topping right about here.

    SPX appears to have peaked at 1331.48.  Will load more shorts here.

    ORIGINAL POST:  7:00 AM PDT

    Opened up this morning in what seems to be a corrective wave for the 5 fives down from last Thursday’s 1356 interim high.  We’re also likely bouncing off the 50 SMA at 1314.63.

    I don’t think this is the larger bounce we’re expecting, as that would ideally start from lower levels — perhaps 1300 or so.  But, anything is possible.  If so, key resistance would be at the 78.6% Fib, also marking a TL down, at 1346.50.

    But, for now, key resistance includes the channel top/trend line down from 1356 and, more importantly, the regression channel midline and 61.8% Fib level — both at about 1327.

    Key Moving Averages:

    3 EMA:      1321.88
    10 SMA:    1329.60
    20 SMA:    1304.52
    50 SMA:    1314.63
    200 SMA:  1275.03

    The 20 is below the 50, which is bearish.  The 3 also moved below the 10, which is bearish.  The next piece of the puzzle for bears would be for the 10 to cross beneath the 20, which likely won’t happen for a few days.

    I suspect all eyes will be on Bernanke’s testimony before Congress today.  Key indicator?  The sheen on his forehead and the quiver of his upper lip as he figures out how to put a positive spin on “we’re screwed” — the abbreviated version of “I took $600 billion to fix the economy and all I brought back is this lousy t-shirt.”

    More later.

  • Which Way the Dollar?

    I’ve been watching the dollar’s patterns for months, and yesterday we broke out of a falling wedge that’s been in the works for ages.

    We’ve made many attempts before, but back in late April we started forming a rising channel that’s been guiding us directly to this spot.

    With the weakness in the Euro and flight to safety (ironic, no?), the “mighty” US dollar finally broke out of the wedge, spiking to 77.175 before falling back to  76.38 as of 9:30AM PDT.

    While a fall back to the channel bottom is possible, I think we’re currently backtesting the falling wedge.  I expect this pullback to run out of steam by 75.97 (the circle above) and /DX to begin a strong move up.   Though, its possible the turn will come sooner.  Looking at the intra-day chart, there’s a small falling wedge that looks just about played out.

    From a fundamental standpoint, the Fed finds itself locked into a tough position, unable to print money at the same pace as before.  At the same time, the Euro’s troubles are bound to get much worse.  We’re probably not far behind them (if at all); but, for the time being, there are no good alternative safe havens to the USD — currently 60% of global reserves.

    I know, Gold bugs will argue otherwise.  And, I’m pooh-poohing that idea in the medium/long term.  It’s probably a good investment to hold, even as just a hedge.  But, the other strong currencies are not available in sufficient amounts to act as a global reserve at this point.

    My favorite is the CHF, for instance, but there’s only 50BB of it out there — .1% of all global reserves. The Euro makes up about 26%.  The Pound Sterling and Yen are only about 4% each.  And, does anyone really believe the world is ready to embrace the Renminbi?  It may eventually happen, but not anytime soon.  Like it or not, the world is stuck with the USD…for now.

    When the dollar does finish backtesting, it’ll be a sure-fire chicken/egg signal that equity markets are ready to roll over for good.   It could happen as early as this afternoon, so it bears a very close eye.

  • intra-day: July 12, 2011

    EOD COMMENT:  10:30 PM PDT

    Nothing much to add at this point.  Many of the 60 minute charts look like they’re about to roll over to the bearish side — VIX, SPX, RUT, etc.   Most of the 60-minute charts also feature 10, 20 and 50 SMA’s in a bearish configuration, while the daily charts are getting there, with a 10 day still above the 20, but the 20 below the 50.  The 3 EMA crossed the 10 SMA today, and that’s an excellent bearish signal (once confirmed.)

    Still looking for a bounce, possibly at the 50 SMA at 1315, but more likely the -1 std deb regression channel line, which coincides with the .382 Fib at about 1301.  We should continue to see /DX gains, as the situation in Greece, Ireland and Italy continue to concern investors.  Will this be 2011’s Lehman Bros?

    UPDATE:  11:20 AM PDT

    Just hit 1327, which is the channel midline AND the .618 fib level — a logical top for the day.  The /DX did a swan dive following release of the Fed minutes, but seems to have caught itself at the bottom of the falling wedge — which I’m now broadening.  Doesn’t change the bigger picture, but it buys dollar bears (and stock bulls) a little more time.

    UPDATE:  7:55 AM PDT

    Confusing situation.  The move I was expecting down to the -1 std dev line on the regression channel happened perfectly — but in the futures overnight (1296 on /ES).  The bounce back was supposed to be to the midline (1325 on /ES, 1326 on SPX).  But, we’re just shy of that now.  I think the algo’s are wondering if a dip in the futures “counted” or not. 

    If we get back above 1325, I’ll be looking for additional short entry positions.  But, I think there is likely to be another, larger bounce on the way down — maybe at 1300 still — to take the place of the one that didn’t happen in the cash markets.   Just be aware that a bigger bounce doesn’t mean the bull market is back.

    In terms of 2007 comparisons, yesterday was likely our December 11th — pretty clear cut.  But, on the 12th, SPX put in a rickshaw man, basically a doji with very long tails and a tiny body in the middle — indicating indecision.  http://thepatternsite.com/RickshawMan.html   The market opened up 10 over the 11th’s 40 pt plunge, soared 25 points in 5 minutes to recover almost all the previous day’s losses.  But, it gave them up to close down 1 point.  Talk about driving investors crazy…

    The next 4 sessions it dropped 42 points, to complete a 6-day 90 pt drop from the top.  It was followed by a 5-day, 64 pt retracement that took prices to their final pattern high of 1499.  This move was incorrectly assumed by some to be the start of [iii] of 5 up.  Nine days later, the market was down to 1376, testing the previous lows.  It bounced a bit there, but hit 1270 9 days later. 

    2007 TOP

    ORIGINAL POST:  6:27 AM PDT 

    In overnight action, the futures declined to touch the -1 std dev line in our regression channel.  This was exactly what I expected from the cash market when I wrote last night’s update — just didn’t think it would happen that fast.

    REGRESSION CHANNEL ON /ES

     We’ll keep an eye on the cash market opening to see if there’s a follow-through, or if all the fun happened overnight.  If we do get a bump up, I expect it to be the last best opportunity to add more short positions.

  • The Deathly Hallows

    In Harry Potter, these are the three magical objects which make their owner a master of death.

    Tonight, we’ll look at three technical indicators that, while they may not grant immortality, will hopefully guide us safely through a dangerous market.

    (1)  Our harmonics patterns are working out exactly as expected.  As we forecast in Patterns, Patterns and More Patterns back on June 27, SPX went on to form an extremely well-formed Bat Pattern (the big W in orange in the chart above.)  The downside targets are devised by applying Fibonacci ratios against the DA measurement. In this case, that translates to:

    61.8% retracement:   1295
    1.618 extension:        1231
    2.618 extension:        1197

    (2)  The regression channel has done an amazing job of defining almost all of the tops in this pattern.  Look at the number of times one of the parallel red lines served as a limiting factor on either an advance or decline.

    As the chart shows, the +1 standard deviation line limited advances on no less than 17 trading days since Feb 22.  The midline was even more effective, defining tops or bottoms on about 20 trading days.  The -1 and -2 lines defined about 19, and the +2 line marked the 1370 high.

    Now that we’ve dropped beneath the midline, I think there’s a good possibility the -1 channel line will mark our next bounce.  At 1299, it captures all of the Head and Shoulders downside (target is 1310) we anticipated in this past weekend’s update.  And, the -2 channel line will ultimately mark our fall from this topping pattern.

    (3)  The Fan Lines have been phenomenal at guiding the action on both the upside and downside.  Combined with downward sloping channels, they allowed me to accurately forecast the highs on 2/18, 4/6, 5/2, 5/31, 7/6 and within 12 points of our latest top.  More important, they gave me the conviction to initiate or hold positions when there was tempting evidence to the contrary.

    Going forward, I expect the fan lines from Aug 31 to play an important role in determining turning points and bounces on the way down.  If the regression channel midline doesn’t catch the next bounce, I expect the fan line through the Jun 15 bottom will do it.  The downward-sloping channels drawn in the above chart will also consolidate our declines into predictable patterns.

    NEXT:  As we talked about last Friday, the 87-day pattern I uncovered back in May [Sure, It Works in Practice] seems to play out on an accelerated basis in market tops.  It happened in 2007, which is my model for this topping pattern, and it’s happening so far this time. Here’s my original chart from May 9.

    The pattern has been remarkably effective at marking interim highs.  On average, every 87 days the market declined by an average of about 4% within 3 trading days and 11% within 30 trading days.

    On 12/26/07,  a 15% drop came along after 76 days.  But, here I fudged a little.  In reality, the decline started 10 days earlier on 12/11/07.  The market dipped 88 points in 5 days, and recovered 63 of them by the 26th.

    I initially thought to use the 26th as the starting point because: (1) the decline really picked up steam then, and (2) it was closer to 87 days.  If I had used the 11th, it would have been only 61 days since the previous peak.  Interestingly, the next peak came only 63 days after the 26th.  I wondered, at the time, if the cycle duration “compressed” at market tops for some reason.

    In retrospect, it seems obvious that the final interim high of a topping pattern should arrive after a shorter interval.  After all, the reason it’s only an interim high is because it fails to go on and become a new pattern high.  BTW, with this latest addition to the study, the cycle average has fallen from 87 to 86 days (I need a new name for it.)  A decline that unfolds per the averages from here would reach 1290 by Wednesday and 1194 by August 18th. 

    Last, the huge H&S; pattern that’s been playing out since the start of the year indicates a downside of 1150.  These targets coincide nicely with those suggested by my other indicators.

    Good luck to all.

  • Intra-day: July 11, 2011

    ORIGINAL POST:  8:35AM PDT

    Watching the bearish Bat Pattern unfold, with Fib targets based on the DA measurement:

    .618   — 1295
    1.272 — 1231
    1.618 — 1197

                                              Bearish Bat Pattern

    And, for those who have been following my 2011 = 2007 posts, today is putting in a bid as a candidate for December 11, 2007.  Here’s how that day unfolded on an hourly basis:

    Despite SPX losing about 40 points that day, it wasn’t straight down.  For a read on the market’s vibe before, during and after the fall, check out yesterday’s post She’s Come Undone.

    Very instructive to see what reactions were like back then, particularly the disbelief.

  • She’s Come Undone

    While backtesting the trend line from the Mar ’09 lows, the market did a little throw-over last week — exceeding the resistance by 14 points on Thursday, but giving it all back on Friday.  As we discussed in Confidence Fairies and Snowballs, this throw-over was a function of the government’s attempt to intervene in the oil markets.

    While doing little to contain energy prices, the move threw a monkey wrench into the bulls advance, meaning the market went father and faster than it otherwise would have.

    A quick look at the big picture, showing the trend line going back three years to the Mar ’09 lows.  

    A close-up of the daily graph shows the relation of the trend line to the fib levels and the regression channel that stopped the most recent advance (and four others before it.)

    While it’s entirely possible that the market is gathering momentum for another move higher, I don’t believe we’ll exceep May’s high of 1370.  A quick look at the 60-minute version of the above chart illustrates where we are relative to resistance.

    As mentioned above, there was a throw-over on Thursday.  As shown above, the advance was stopped dead in its tracks by the one-standard deviation line of the regression channel that’s defined this top.  Friday we quickly and forcefully reversed back below that line.  Friday’s slide ultimately lost steam, but the move back up was halted by the above-mentioned trend line. 

    Where to from here?  The market has a lot of momentum going, for sure.  But, the resistance shouldn’t be underestimated.  It includes:

    (1)  the trend-line from Mar ’09
    (2)  the regression channel
    (3)  the rising wedge
    (4)  a very extended bearish Crab Pattern off the 1258 lows
    (5)  a perfectly formed bearish Bat Pattern since the 1370 high
    (6)  the 88.6% Fibonacci level off the May 2 highs
    (7)  the 87-day pattern coming up.

    If we can eek out another 10 points to the downside, we will have completed a little head and shoulders pattern that should take us back to 1310.   That’s a decline of 33 points from Friday’s close.  It should be enough to kick start the next wave down.  If we complete the H&S; pattern setting up since the first of the year, we’re going much lower.

    I’ve also been studying breadth, looking for comparisons to the 2007 top that, so far, is serving as a blueprint for this market.  Take a look at the following chart.

    Focus on the bottom study, the McClellan Oscillator — derived from the 19 and 39-day exponential moving averages of the daily difference between Advances and Declines.  At its current level of 275, it’s an indication of a strong upside move or, more likely, a very overbought condition.

    As the graph shows, this is a relatively high reading.  In 2007, the oscillator spiked up to 233 on the final high of that topping pattern.  This spike followed a long and then a short downward-sloping, divergent move from previous highs.  The same pattern has developed in today’s market.

    It got me to thinking about expectations.  What were we all thinking on December 10, 2007; and, how does that compare to today?  I’ve assembled a handful of links for market commentary from a few days before until a few days after that important day.

    The market had made a strong move up, and bulls were out in force — even in the face of increasingly disturbing economic news.  But, a key Fed discount rate announcement was expected on the 11th.   The market hoped for a .50% rate cut, but got .25% instead.  The DJIA shed 300 points, and the SPX nearly 40. 

    Obviously, we have issues that loom at least as large as 2007’s right here in 2011.  Instead of a rate cut, we’re waiting on news of a deficit ceiling increase — so we can borrow trillions more to keep the economy afloat.  Instead of  WAMU, we’re worried about Greece, Ireland, Portugal and maybe even Italy failing.

    I could go on, but I encourage you to take the time to skim through them yourself, paying particular attention to expectations and sentiment.  It’s very instructive reading. 

    Oh, and for any Guess Who fans who are salivating over title of this post, enjoy:

    December 8, 2007:
    http://www.safehaven.com/article/9013/market-update-the-remedy-to-sideways-markets
    http://caldaro.wordpress.com/2007/12/08/weekend-update-146/

    December 9, 2007:
    http://caldaro.wordpress.com/2007/12/10/monday-update-136/
    http://www.econbrowser.com/archives/2007/12/a_curious_marke.html

    December 10, 2007:

    http://www.hussmanfunds.com/wmc/wmc071210.htm
    http://prudentstockinvestor.blogspot.com/2007/12/daily-market-recap.html
    http://webcache.googleusercontent.com/search?q=cache:Rivq0pyH2pwJ:www.credit-suisse.com/news/en/media_release.jsp%3Fns%3D40604+%22stock+market%22+%22december+10,+2007%22&cd;=19&hl;=en&ct;=clnk≷=us&client;=firefox-a&source;=www.google.com
    http://caldaro.wordpress.com/2007/12/11/tuesday-morning/
    http://www.democraticunderground.com/discuss/duboard.php?az=view_all&address;=102×3097484
    http://online.barrons.com/article/SB119707193637917765.html

    December 11, 2007:

    http://www.wavechart.com/2007update.htm
    http://caldaro.wordpress.com/2007/12/11/tuesday-update-145/
    http://webcache.googleusercontent.com/search?q=cache:dKBNFc7M4QYJ:oldprof.typepad.com/a_dash_of_insight/2007/12/alice-rivlin-on.html+stock+market+update&cd;=80&hl;=en&ct;=clnk≷=us&client;=firefox-a&source;=www.google.com
    http://www.actionforex.com/archives/action-insight-archives/daily-report:-carry-trades-gain-ahead-of-fed-rate-cut-2007121133276/

    December 12, 2007:

    http://www.econbrowser.com/archives/2007/12/a_curious_marke.html
    http://caldaro.wordpress.com/2007/12/12/wednesday-update-147/
    http://www.democraticunderground.com/discuss/duboard.php?az=view_all&address;=102×3099056

    December 13+:

    http://afterhourtrades.com/aht.htms
    http://www.investmentpostcards.com/2007/12/16/words-from-the-wise-for-the-week-that-was-dec-10-%E2%80%93-16-2007/