Month: July 2011

  • Intra-day: August 1, 2011

    UPDATE:  3:00 PM EDT

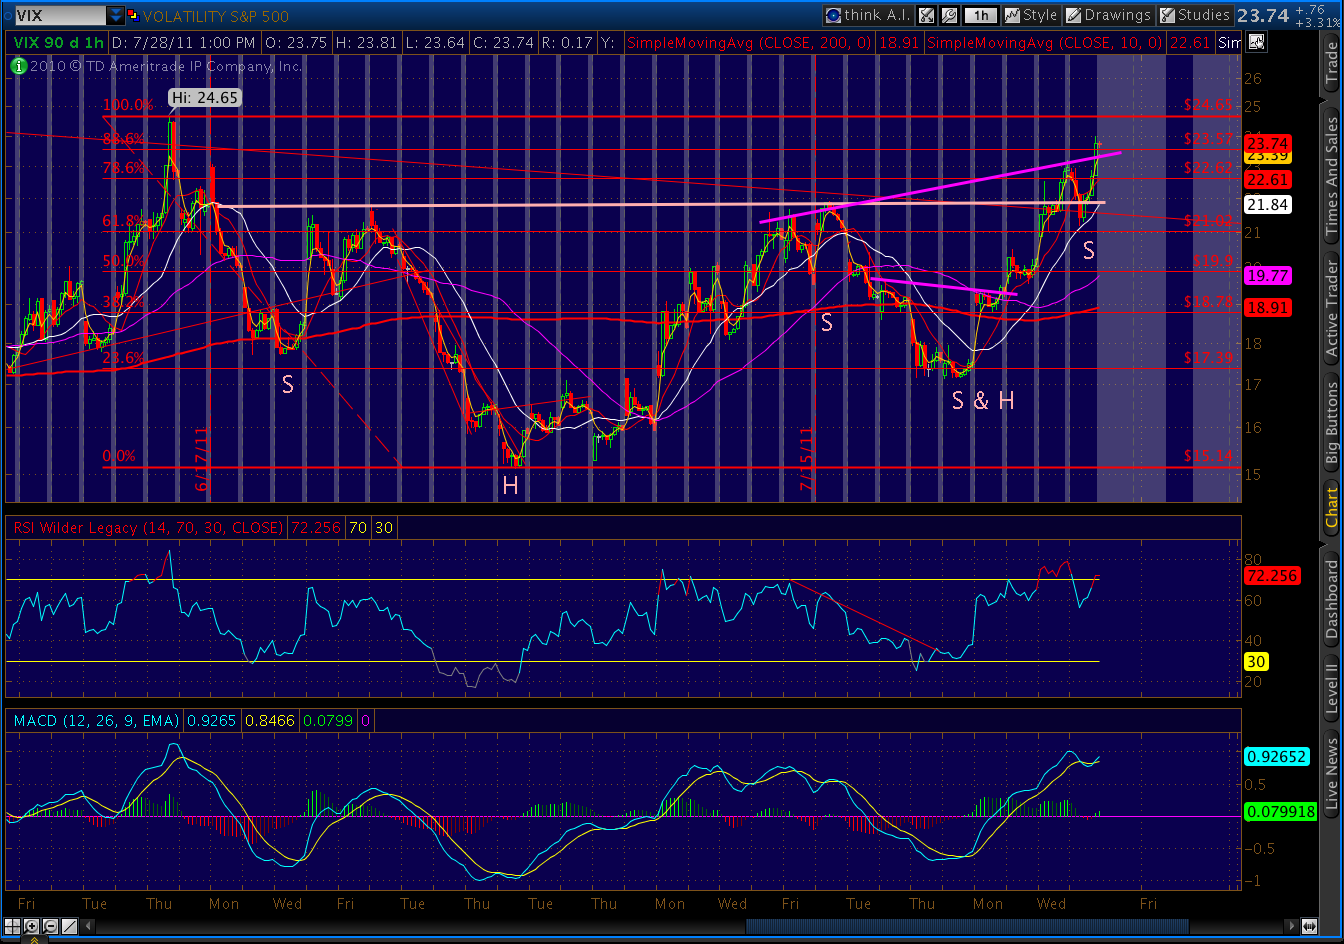
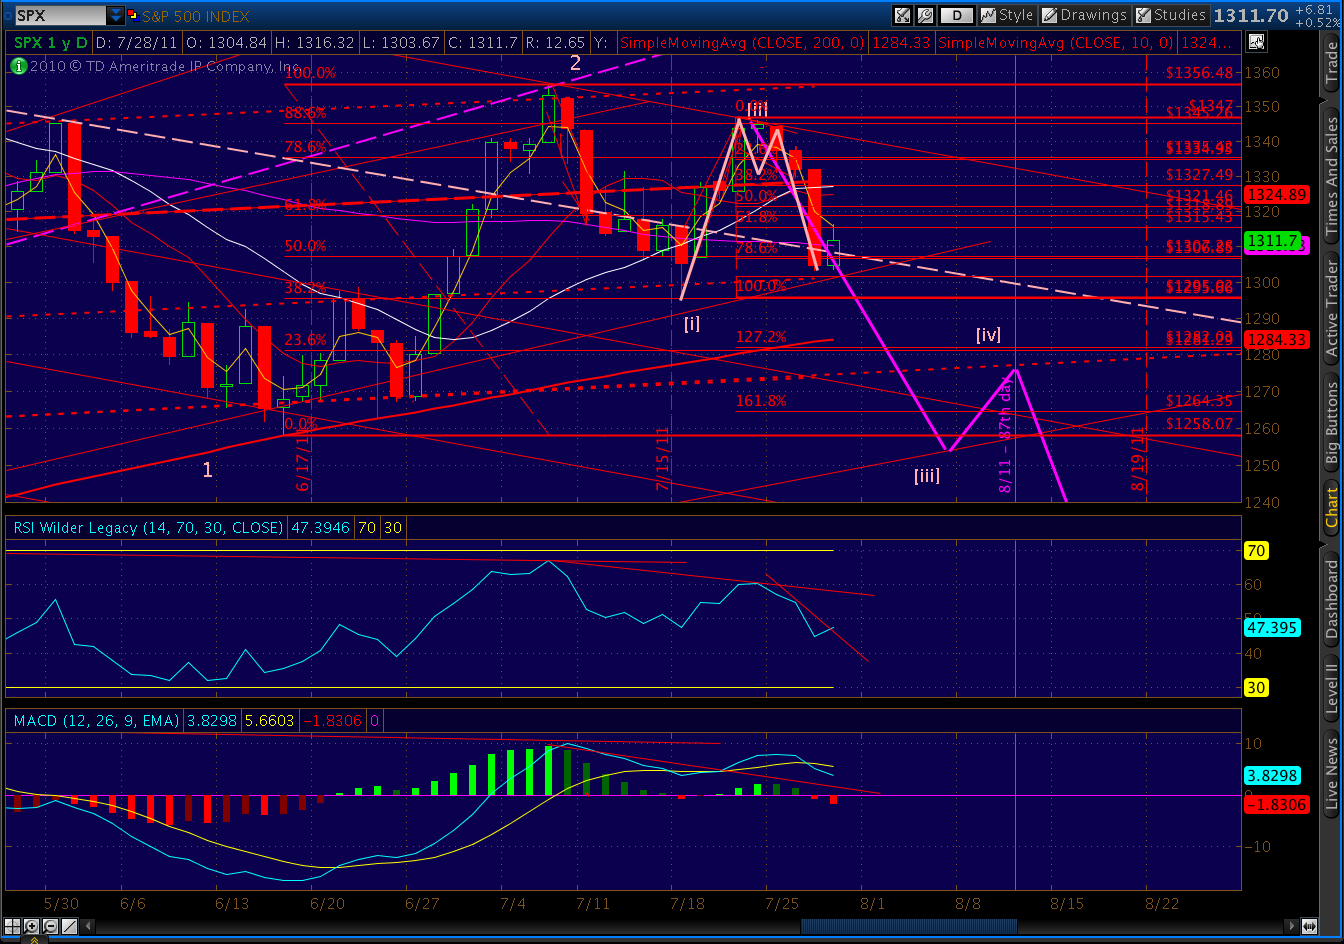
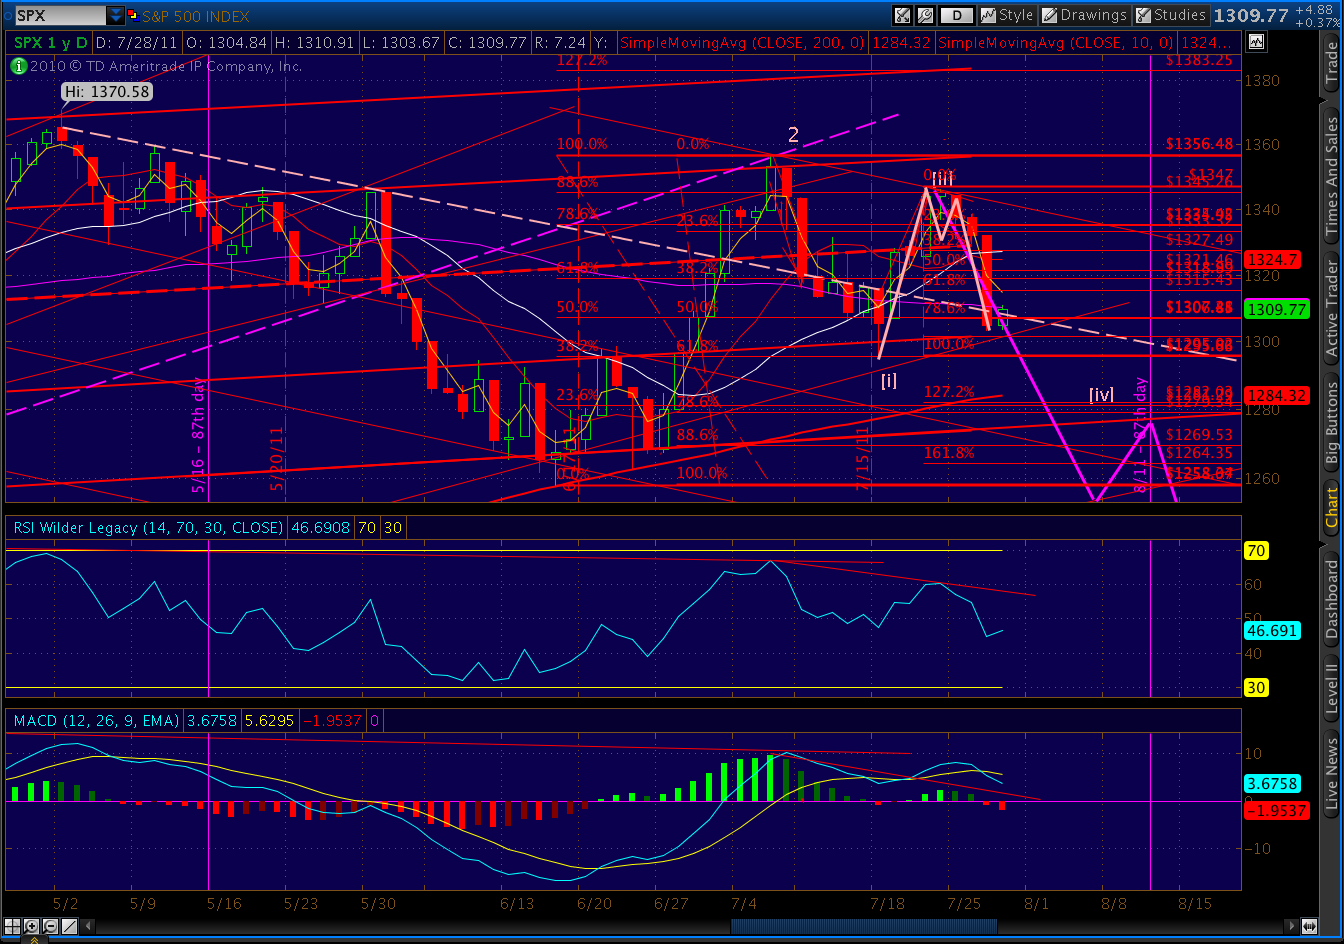
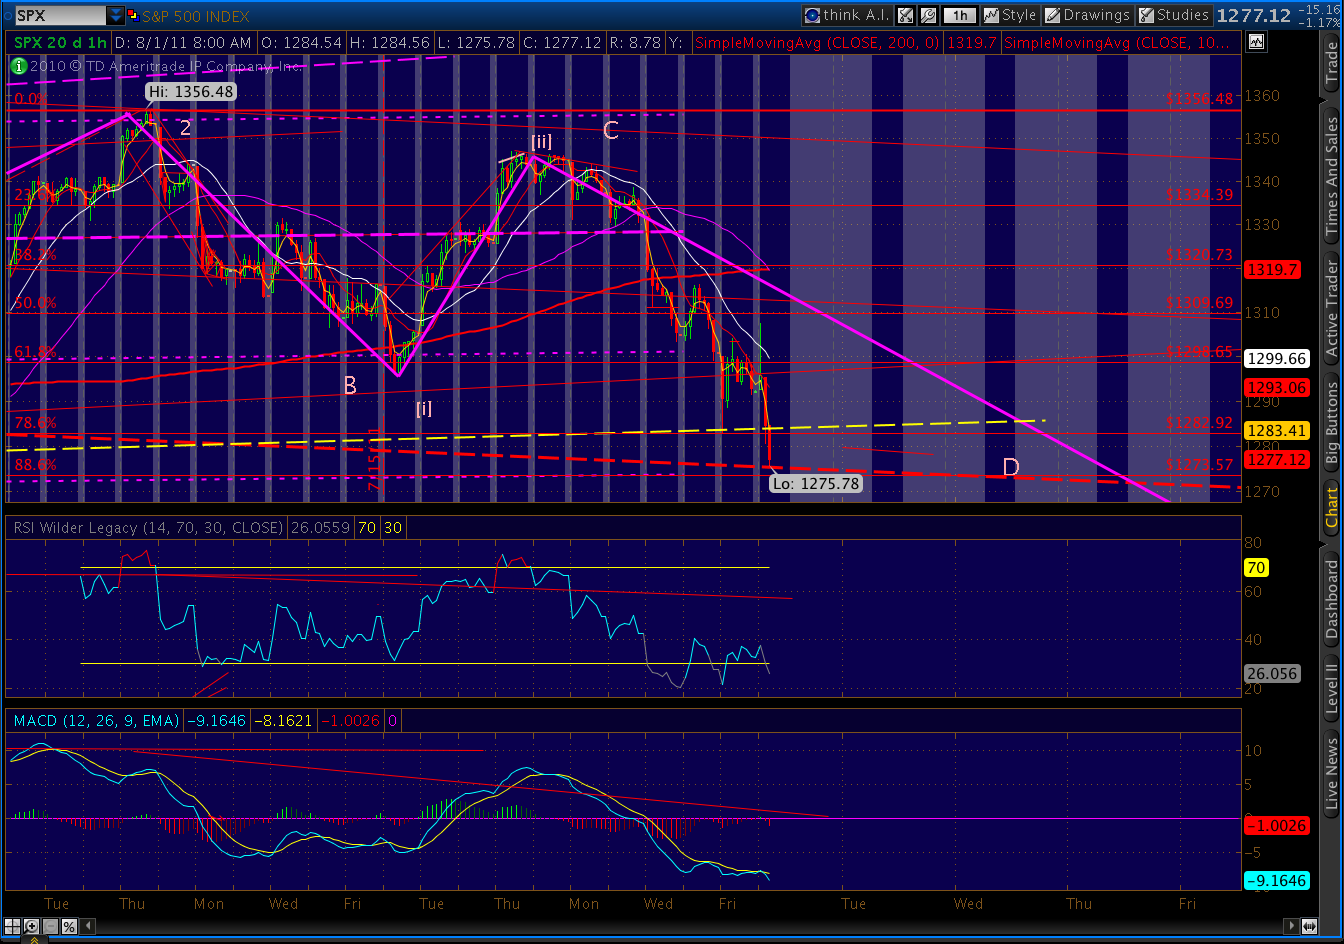
    In coming back to the -2 std deviation line of our regression channel at today’s low of 1274.73, we’ve finally completed one of the H&S; patterns I’ve been following.  This one has a sloping neckline (blue, dotted), and is the 2nd cousin to the one everyone’s been watching.  Here’s a peek:

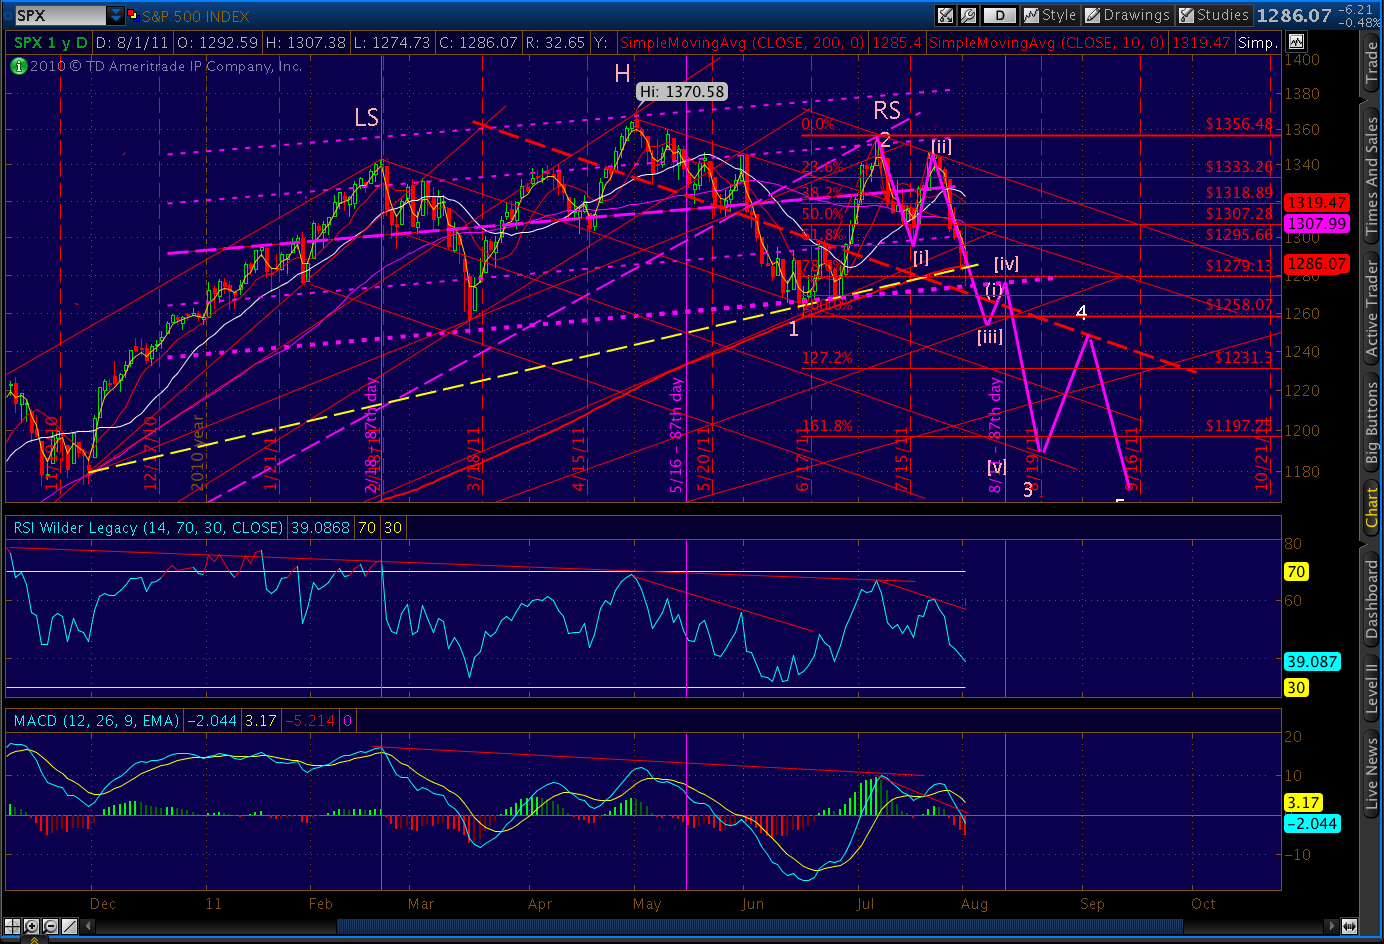
    The other, better-known but equally valid pattern has a flat neckline and completes at 1258.07.

    The only practical difference between them is the price objective, which is established by the distance between the pattern high and its corresponding neckline value — about 112 points.

    The first pattern objective, therefore, would be 1163, and the second would be 1146.  Either will help get us to the new lows coming later this week.

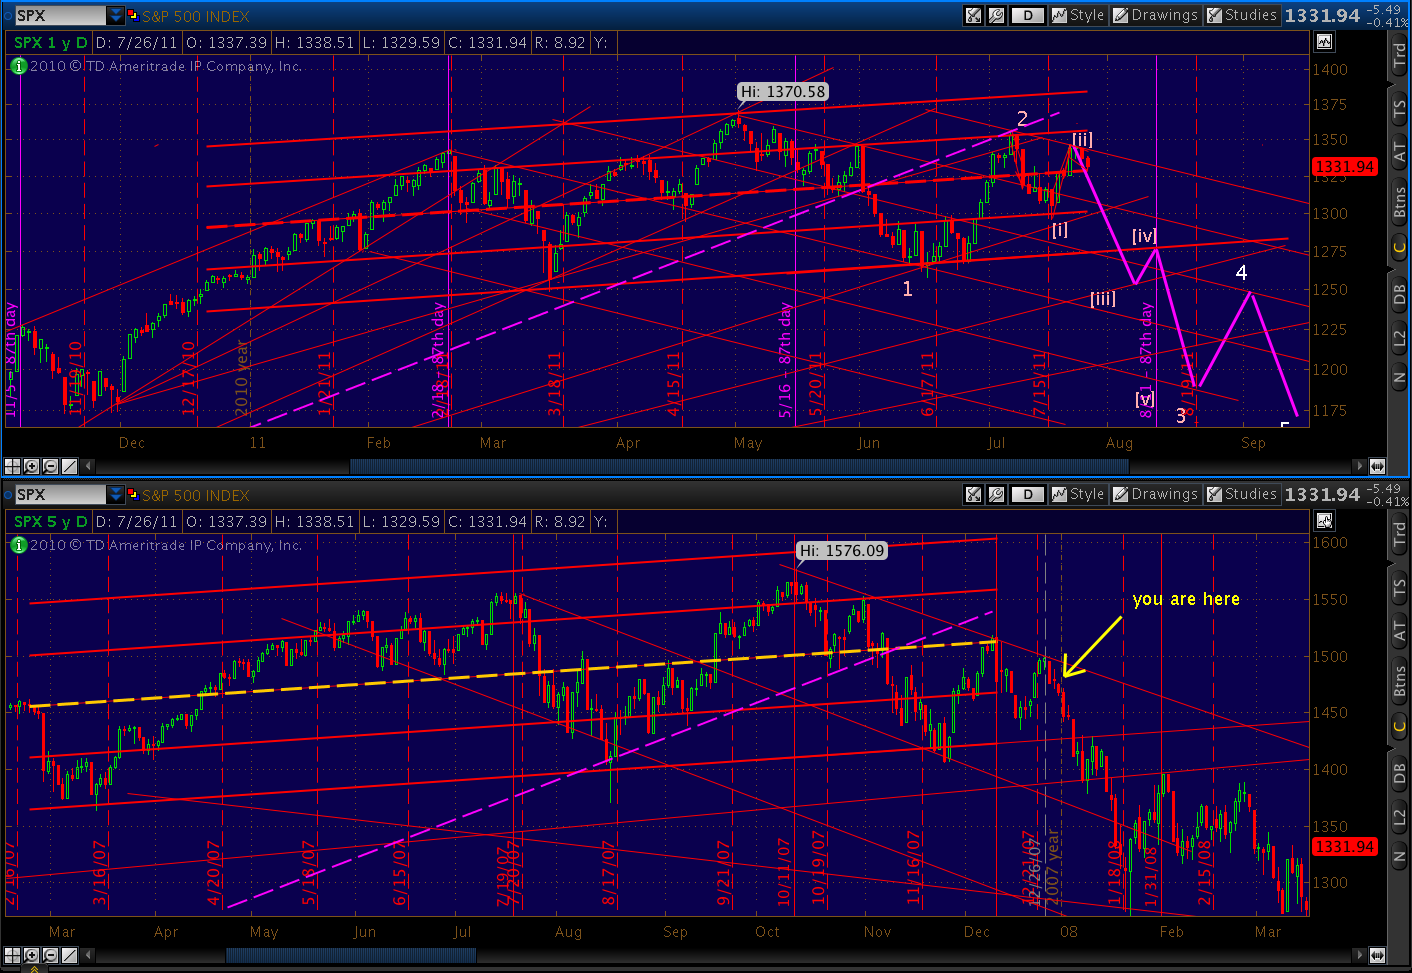
    In terms of targets and timelines, we’re still following the 2007 script.  The direction and speed has been spot on, as the purple line above indicates.  This is the exact same trend line drawn 10 days ago and has done a remarkable job of showing us the way.

    We might get another pop up when the debt deal is finally done, but the anti-deal sentiment is so strong now, it’s hard to imagine more than 20-30 points if that.  It’s more likely we go down and test the 1258 lows before any meaningful bounce occurs, probably to backtest the -2 std dev line (purple dotted) before beginning the next wave down.

    UPDATE:  12:40 PM EDT

    Thought for the day… The argument has been made that US stocks are able to advance in the face of a crummy US economy because “the stock market isn’t the economy.”  How many times have we heard that refrain?  US companies are global now, and conduct 40% of their business in other countries where everything is hunky dory.

    With PMI confirming a pretty ugly global economic picture (see below), it seems that argument isn’t quite as compelling.

    UPDATE:  11:45 AM EDT

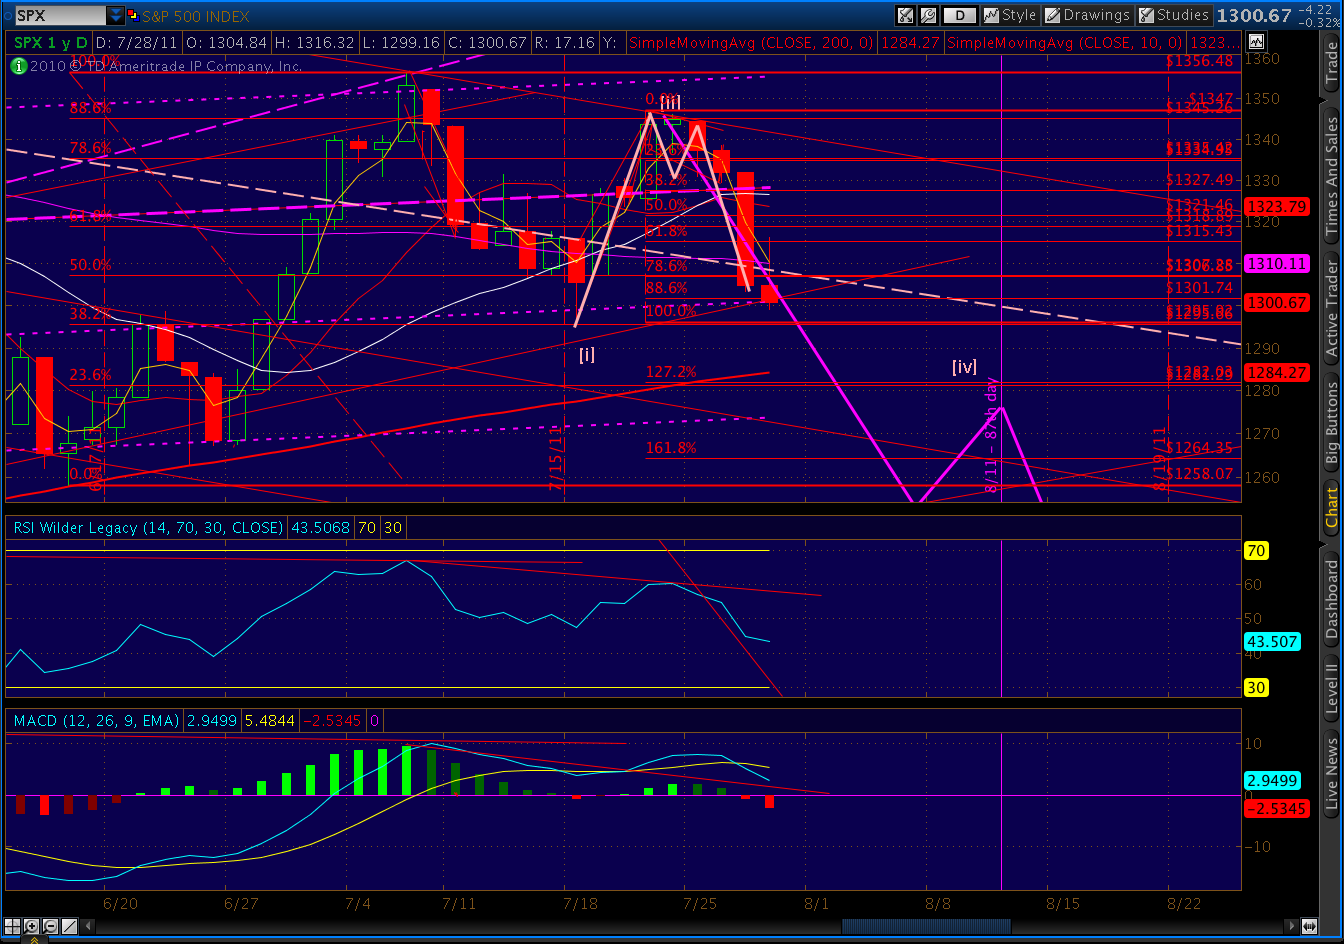
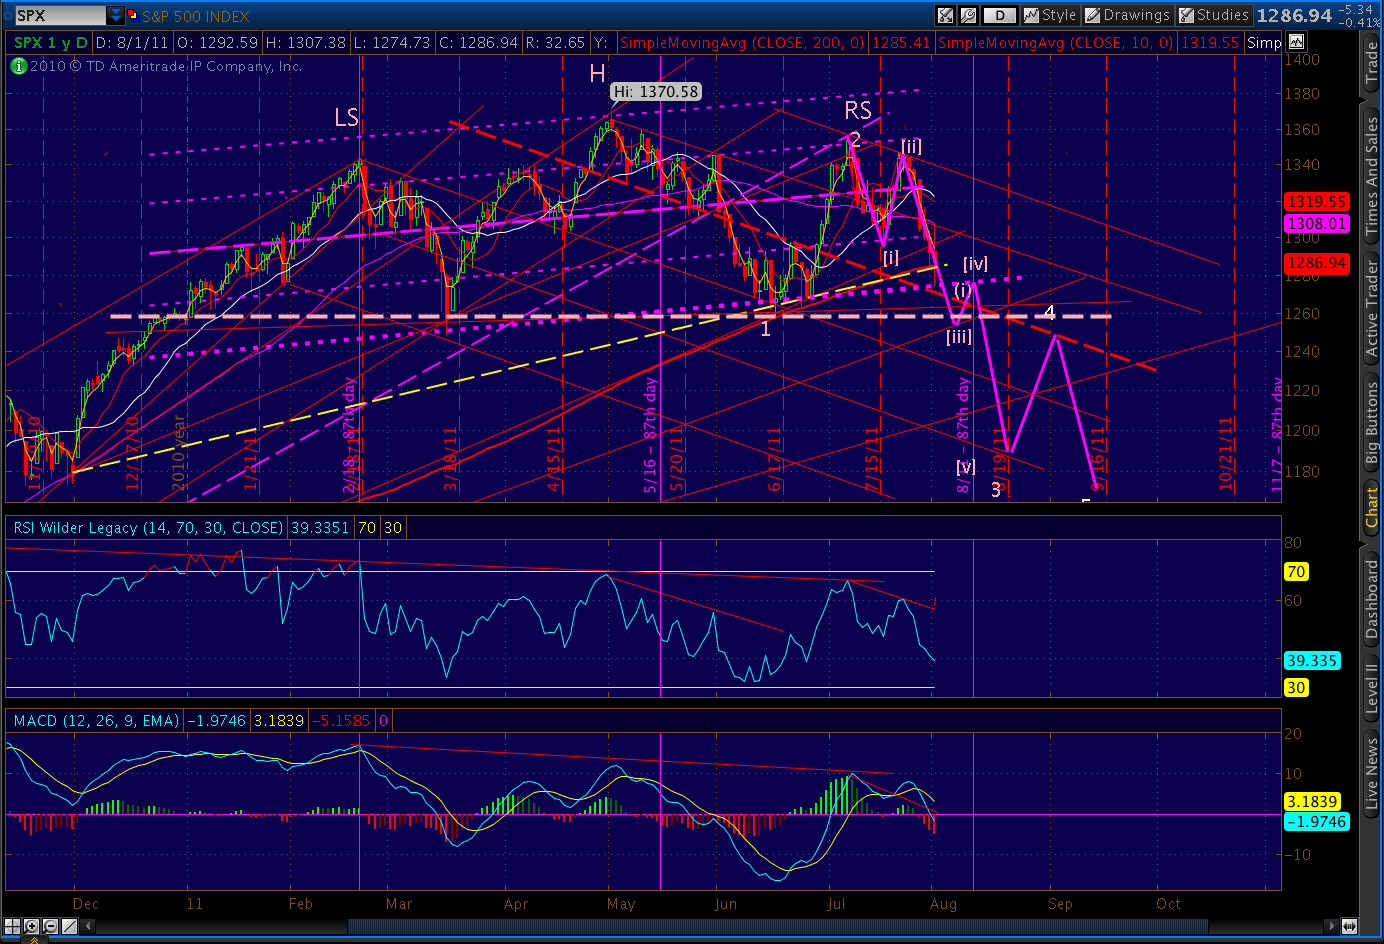
    SPX thought about respecting the Gartley .786 retrace and TL at 1282.92, but it looks like the economic news is just too overwhelming.  Here’s the daily chart.  Note we’ve broken through the trend line from the last lows I mentioned in yesterday’s post (yellow dashed line).

    Next up is the TL from the Apr 21 gap (orange dashed line.)  It’s stopped plenty of declines before, but its days are probably numbered.  
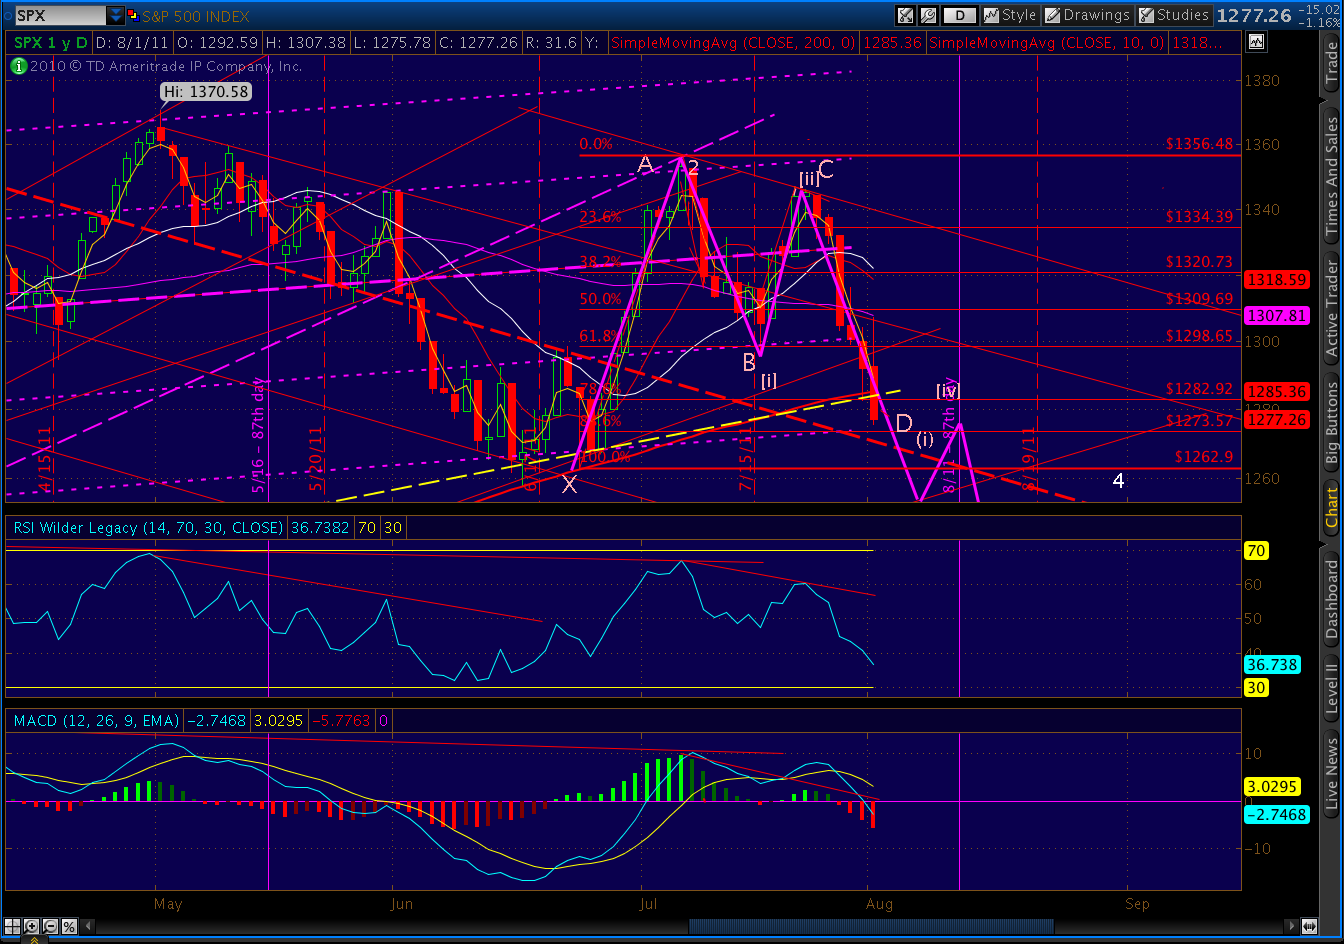
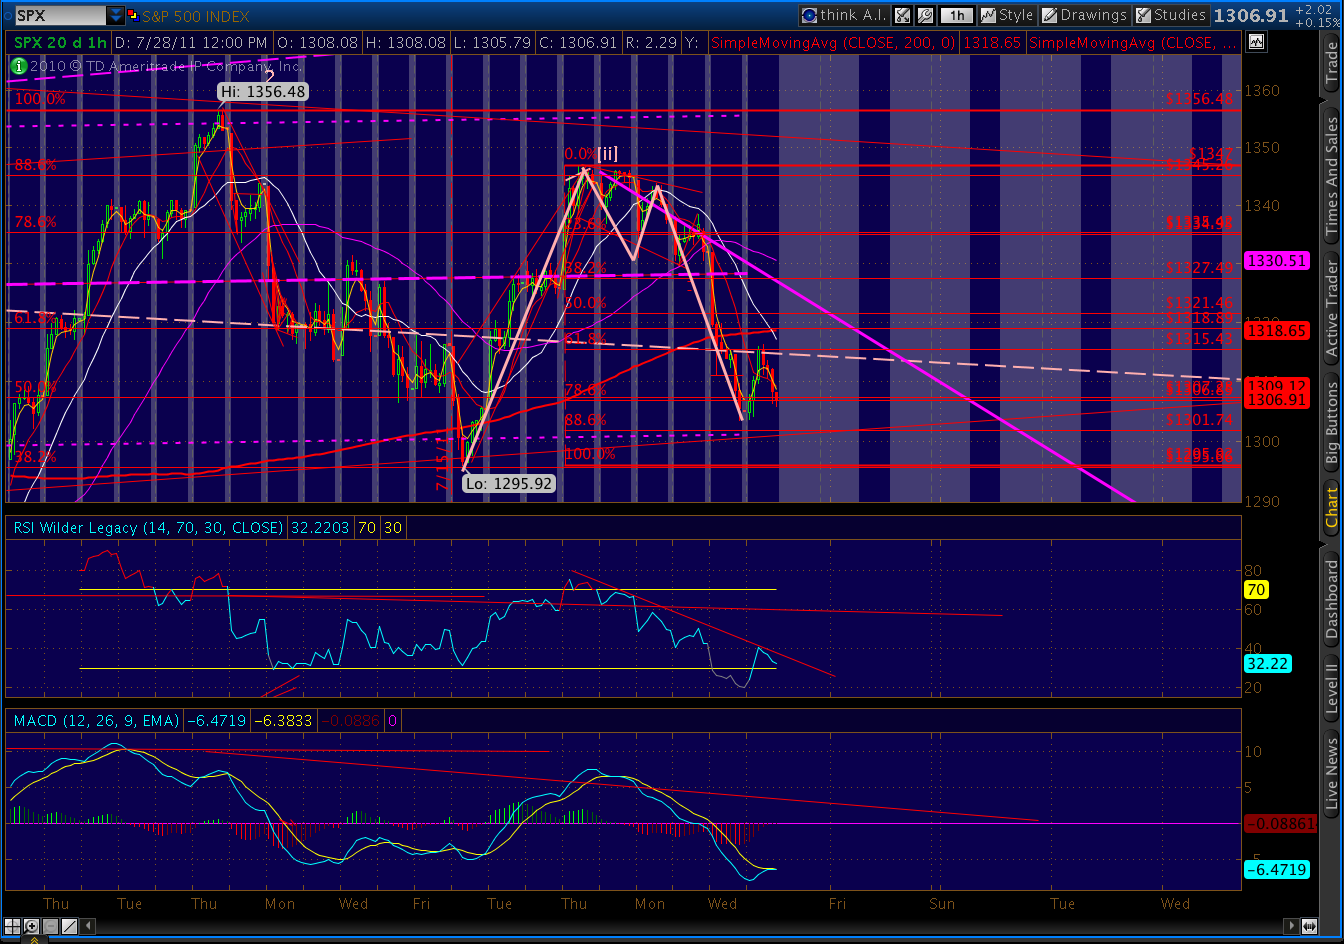
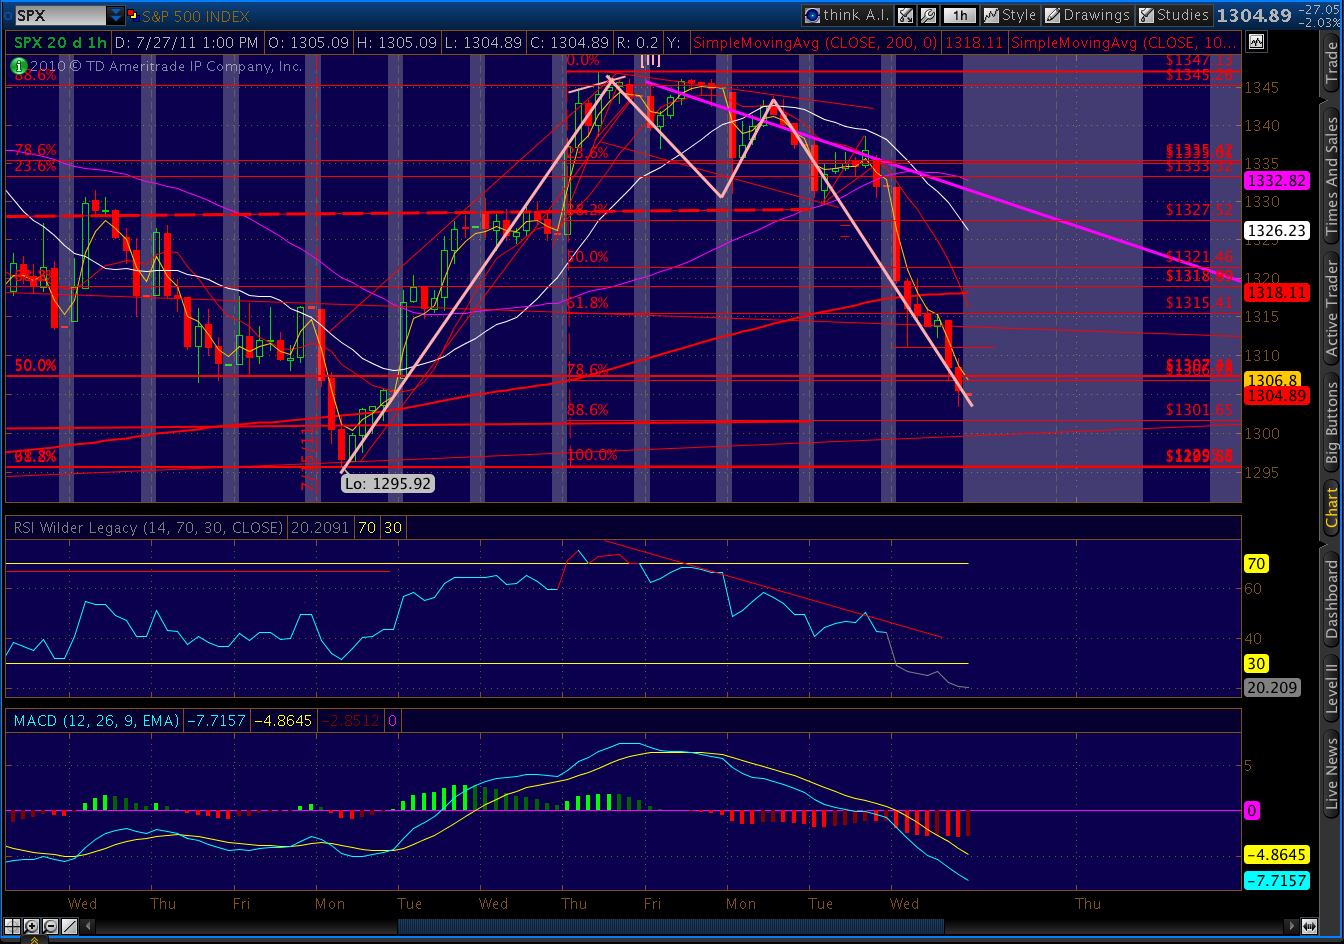
    And the 60-minute.

    UPDATE:  10:45 AM EDT

    As I mentioned in yesterday’s post, the last two times the US PMI came in negative like this were May 2 (the 1370 high, prompt reversal) and June 2 (a 31-point decline in SPX.)

    The Eurozone PMI report came in even worse than the US.  It’s worth a read.

    UPDATE:  10:10 AM EDT

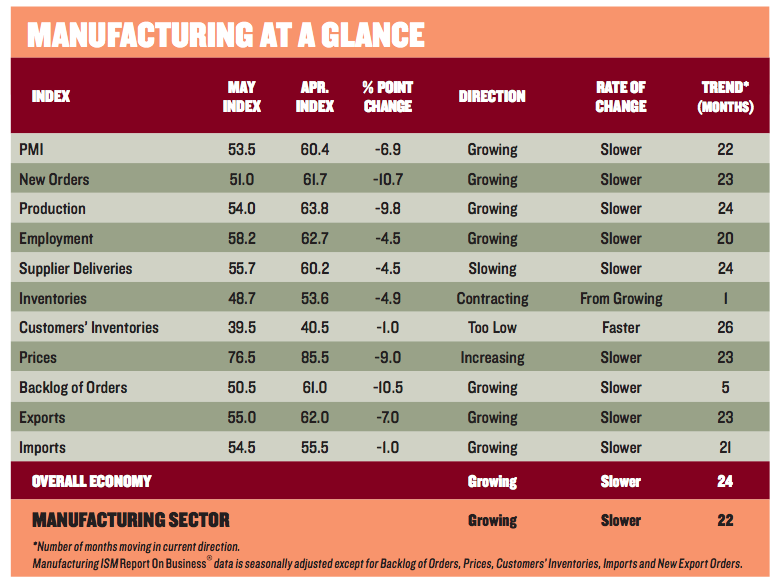
    The ISM Manufacturing Report on Business came in every bit as negative as I expected.  The PMI is at 50.9, a 4.4 point decrease and well below the 54 the market expected.  It totally negates June’s increase.  The breakdown:

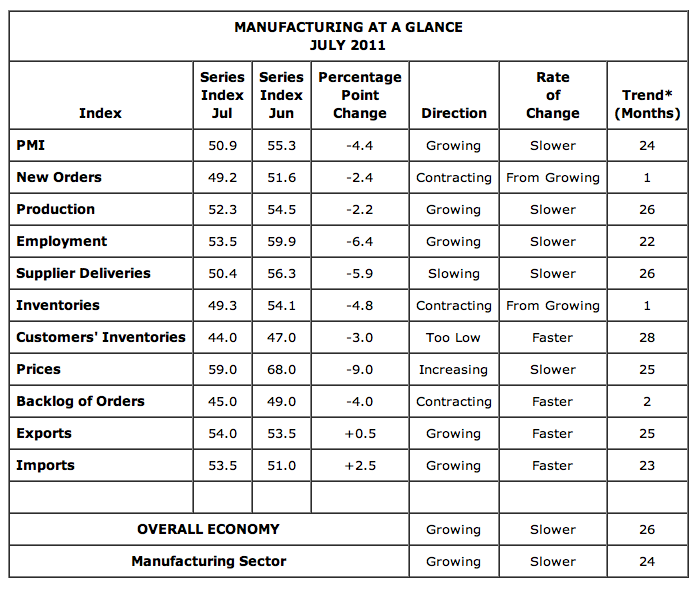
    Import/export activity was up slightly.  Every other category fell off, indicating a slower rate of growth, or outright contraction.  New orders contracted for the first time since June of 2009.   And, backlogs and customer inventories are contracting at a faster rate.

    The 50 point level is the division between growth and contraction, so the index still represents a slightly positive outlook.  But, the trend is clearly moving down again, indicating a contracting economy in the very near future unless something dramatic happens on the upside.

    Here’s a link to the full report.  The non-manufacturing report is due out Wednesday morning.

    ORIGINAL POST:  July 31, 2011

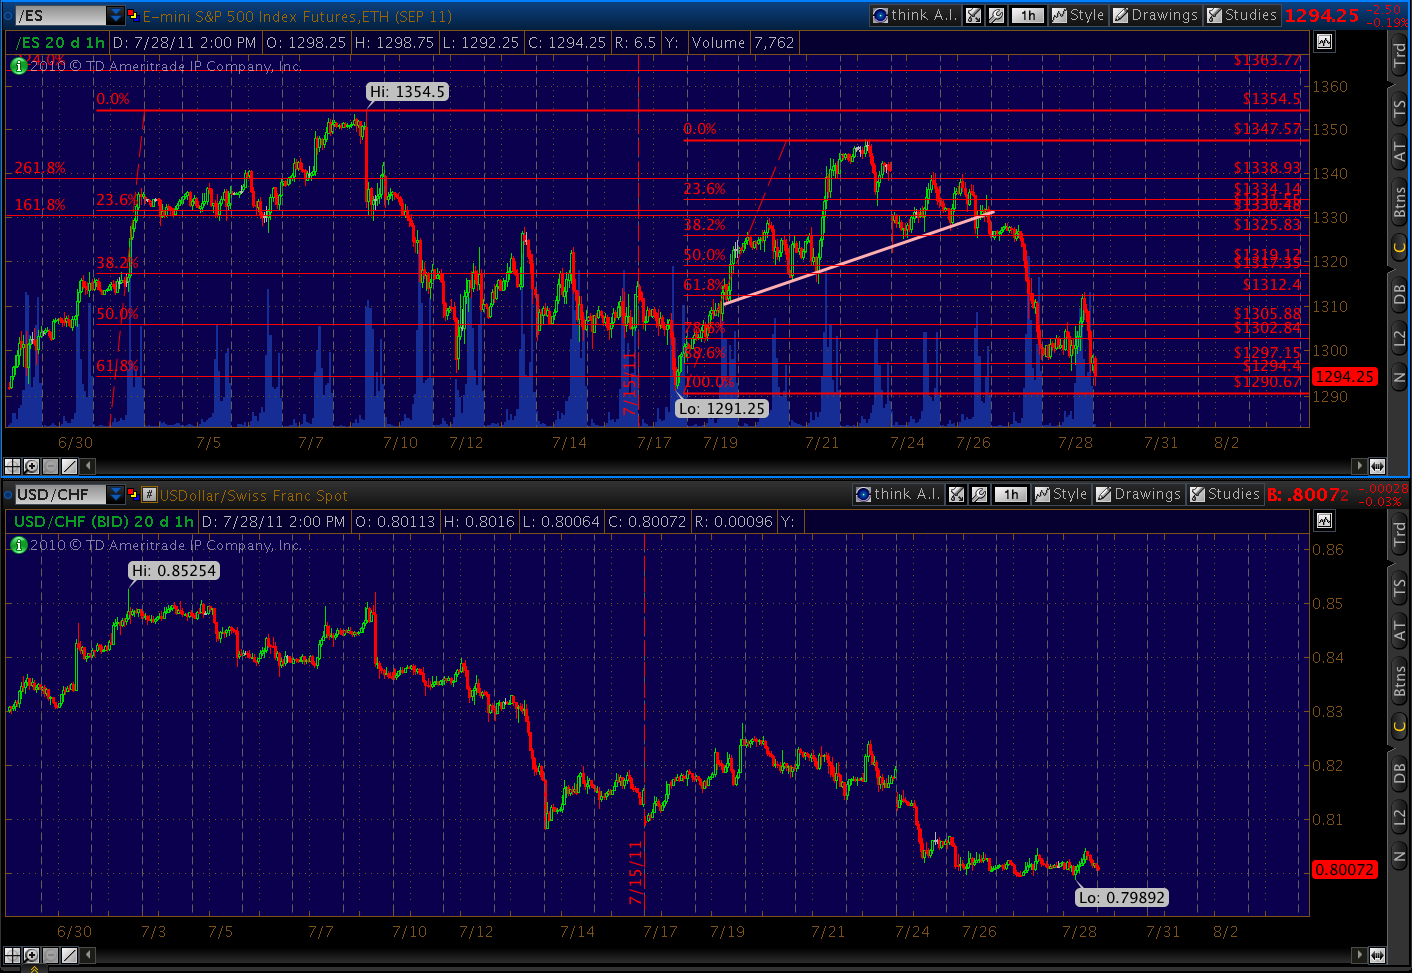
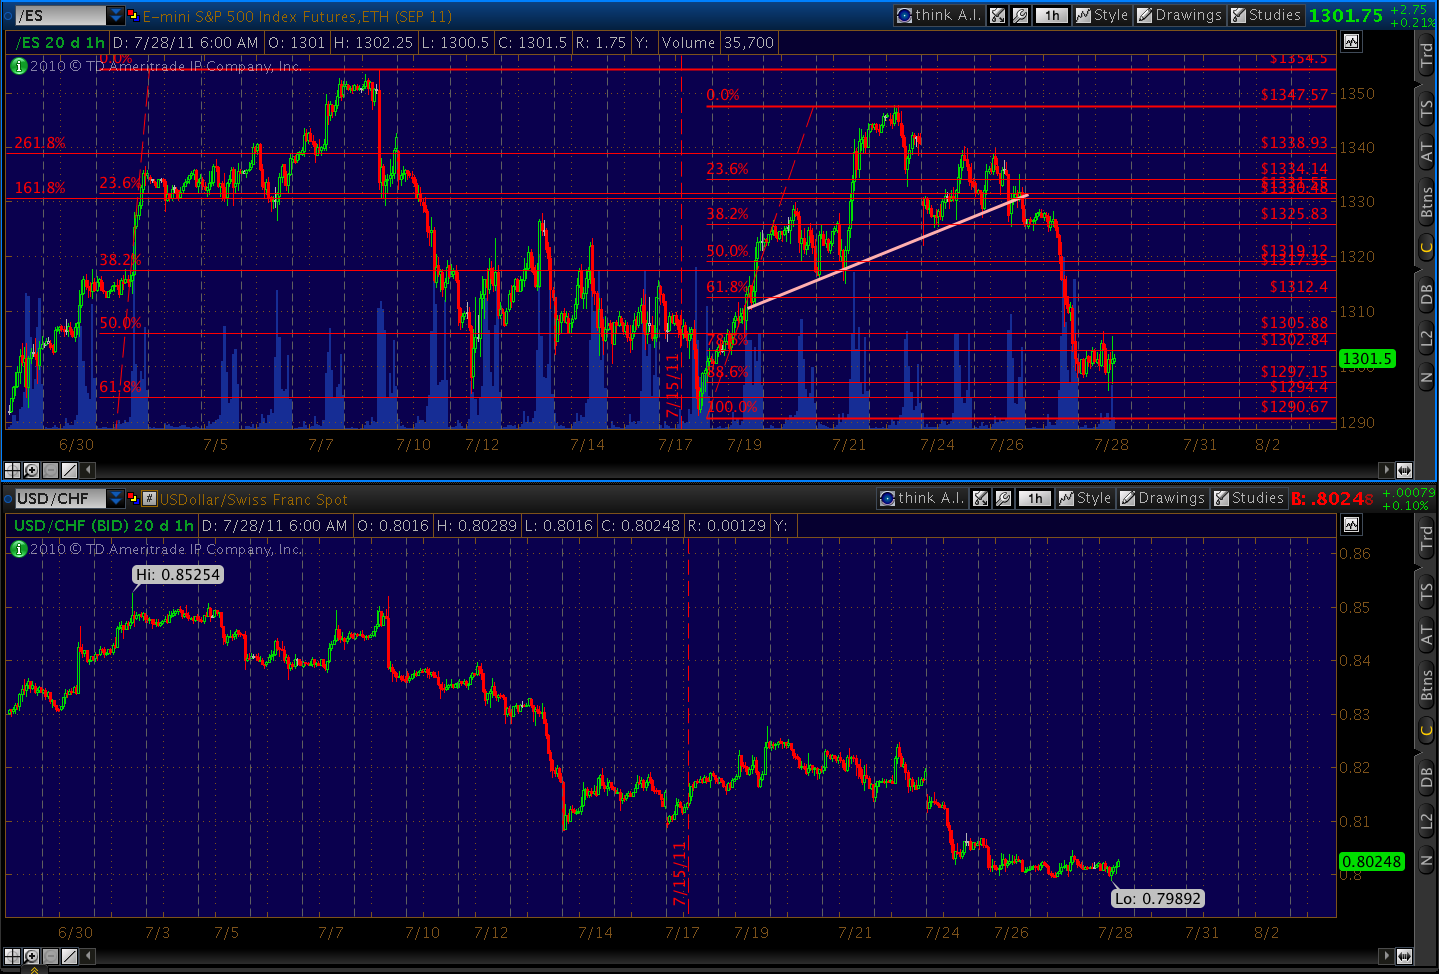
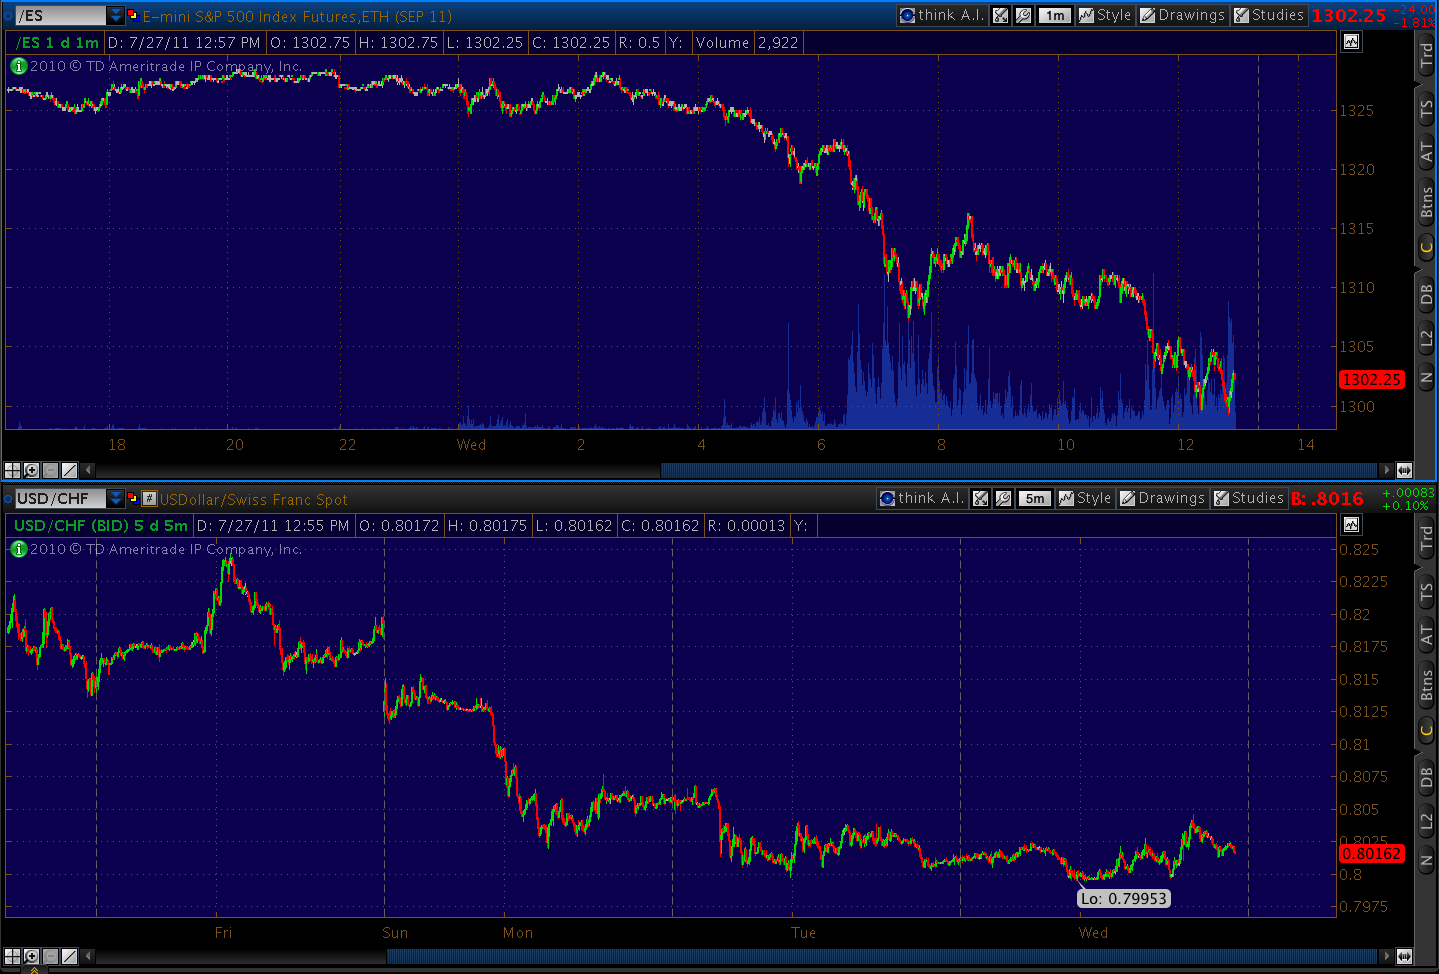
    Looking ahead, here’s a comparison of the USD/CHF vs ES reaction to the debt ceiling “news”…

    More later.

  • Random Thoughts While Awaiting Certain Doom

    While we’re all waiting for our heroes on Capitol Hill to ride in on white horses…

    FRIDAY

    Friday’s market proved, once again, the power of harmonics.  While I, and seemingly everyone else, was watching the 200-day moving average (1284.27) for a bounce, it was a Gartley pattern and a fan line that proved the more accurate forecasting tool.

    Here are the two Gartley’s I was watching:

    Pretty well drawn, except for the false start back at the end of June.  The .786 retrace completion, or D point, is at 1279.13.

    From the other apparent starting point, D is at 1282.90.  The actual low for the day was 1282.86.

    Normally, I look for a bounce of .618 of the DC leg from a Gartley pattern.  This would indicate an upside with potential to 1321.84.

    And, the fan line?  Take a gander at the yellow dashed-line.  It starts at the Nov 30 low and tags the Jun 15, 16, 24 and 27 lows.

    Here’s a close up:

    I normally consider Gartley targets pretty reliable.  But, under the circumstances, I gotta say it’s anyone’s guess how far and how fast the next couple of days go.  I believe we’re still under the influence of the 2007 pattern, but this debt ceiling matter will clearly determine the direction and magnitude of at least the next few days.

    LOOKING FORWARD

    If we get positive news on the debt ceiling, look for a relief rally that’s proportional to the perceived quality of the news.  I expect it to be a crock, providing no real cost savings or revenue increases. But, that doesn’t matter.  What really matters is how well TPTB sell the deal as the key to our salvation.

    It appears as though S&P; has folded in the face of what was probably unbelievable pressure from the government.  So, we’ll get a slap on the wrist rather than actual downgrade.  Moody’s and Fitch will probably fall in line.

    It’ll be interesting to see how the economic data shakes out.  ISM is scheduled to report at 10 AM.  The last two times they reported negative news, the market tanked.  On May 2, they reported the April PMI at 60.4, down from March’s 61.2.  It confirmed the downtrend that started with the previous month’s report.  May 2, of course, marked the top of the current pattern and the start of a 112-point decline in stocks.

    On June 1, ISM reported a PMI of 53.5, well below the previous month’s 60.4.   The 31-point decline was the worst of 2011.   I have no secret source inside ISM, but I have gone back and read the last few reports.

    The only “good news” the past two months has been the pickup in activity due to inventory buildup.  You could look at this as positive and represents increasing demand.  Or, you could look at it as a sign that purchasers jumped the gun, mistakenly believing demand would return.  I’ve included the breakdown from the past two reports below FYI.

    Also, here’s a look at the global picture.  It appears there’s a pretty good chance of a decline below the neutral reading of 50.

    LOOKING BACK

    Last, I’ve spent most of the weekend in the Wayback Machine, considering what really happened in the Great Depression that isn’t widely known these days.  Maybe I learned this back in college and have forgotten it, but I found it interesting that a real estate crash preceded the Great Depression.  Really.

    In “Securitization in the 1920’s“, William Goetzmann and Frank Newman of Yale describe a real estate market run amok, much like the early 2000s.  In New York, for instance, more skyscrapers were built (235) than in any 10-year period ever.   Many were financed with bonds, offered in denominations as low as $100 and offering interest rates of 4-7%.  Interestingly, the coupon payments were often paid in gold — as it was considered an excellent inflation hedge at the time.

    Annual issuance grew from about $58 million in 1919 to $696 million in 1925, representing 23% of total corporate debt nationwide.  The market peaked in 1928, falling over 75% by 1933.

    The stock market tanked after the crack in the real estate securities market, as is clearly demonstrated by the following graph:

    If I get really ambitious, I’ll put together a comparison of like spreads for the past 10 years.  But, I think I know what it will look like.

    Sure makes me wonder about that uptick in subprime loan delinquency rates in the first quarter…

    Additional ISM data:

  • Just made an interesting discovery, that led to an even more interesting discovery.

    I’ve been watching the VIX calls, and in fact am very happily invested in the August 25’s at .50.  Last night, someone pointed out that the in the money calls were trading below intrinsic value.  A few minutes ago, with the index at 25, the August 20 calls were only trading at 3. 

    Strange, because arbitrageurs would normally not allow such a gap to exist.  I talked to a trader friend of mine and, it turns out, VIX options trade off VIX futures.  I’m not a futures trader, so I have to admit I didn’t know VIX traded in the futures markets. 

    But, it makes sense.   With the cash index at 25 earlier today, the close-in futures contracts were about 3 points lower:

    Aug 16:  21.60
    Sep 21:   21.65
    Oct 18:   22.40

    I can’t get VIX futures on TOS, but CBOE has a quote webpage.   Interesting, right?

    But, that got me to thinking.  What do futures traders know that I don’t?   If futures prices are lower than cash, that reflects an expectation that prices are going lower.  What about the big move down, the start of the next bear market, P[3], financial Armageddon, etc…

    I decided to make a chart, looking at the premium/discount paid for futures prices vis-a-vis the cash market and SPX.  This might be an interesting indicator, right?

    I didn’t have to.  Turns out the nice folks at CBOE already did it.   They even covered the time period I’m most obsessed with interested in.  Take a look.

    The green line indicates whether the futures are trading at a premium (above the line) or a discount (below the line) to the cash index.  ATL would indicate an expectation of increased volatility.  BTL would indicate an expectation of decreased volatility.

    Note how the discount/premium lines up with the blue line above, representing the SPX.   In the above chart, we can see how the futures premium generally increases from early November into late December as SPX declines, then recovers to make some lower highs.  They move inverse to one another, which is to be expected.  A declining market should generate higher volatility premiums.

    But, look what happened after that interim high (Dec 27).  Even though the market drops pretty steadily, the VIX premium marches right along with it — no longer inverse.

    Even though SPX had dropped from 1576 to 1406 in 31 trading days, that 170-point drop was all but forgotten when SPX rebounded by 92 points in 21 days.  Investors figured the market had reached the bottom of its trading range and was making the next leg up, when in fact it was a corrective wave setting up for a new low.
     
    VIX futures dropped to a big discount to the cash market starting on 12/26/07, just as the market began a decline that would total 228 points in less than a month.

  • Intra-day: July 29, 2011

    UPDATE:   2:10 PM EDT

    The market is back to even on the day.  But, it’s still not clear whether the advance over the past hour is a completion of the a-b-c or the first subwave of the next wave down.

    It’s also completed three of the four legs needed for a bearish Gartley pattern that started yesterday morning.  The D point (.786 Fib level) would be 1309.24, making 1307 – 1309 a reasonable limit to the upside.

    Just for the record, it’s worth noting that the MACD on the daily SPX is just now about to turn negative.  The RSI is still 42.5.  While this short-term bounce is unsettling to bears, there’s plenty of downside left before one could consider the market oversold.

    UPDATE:   11:25 AM EDT

    This bounce should run out of steam before 1307, the .382 Fib retrace (also a .5 and .786 Fib retrace from earlier patterns.) 

    Note the RSI trend line on the 60 minute chart.  It has yet to break through to the upside.  It’s likely this is all the correction we’ll get and that 1307 will hold.

    The same thing happened intra-day on Jan 4, 2007.  The market was off 25 points early, then bounced back in the third hour of trading, up 10 (a .382 retrace) before closing down 33 on the day.

    If we continue up, then this morning’s low was perhaps (i) of [iii] and the rally since then is the “a” in the a-b-c corrective wave.  If so, prices could move up to the .50 Fib level at 1314.48.

    UPDATE:   10:30 AM EDT

    Remember Jun 27 – Jul 7, when everyone was amazed how the market put on 76 points in just 10 trading days?  Some called it one of the fastest advances ever (it wasn’t), suggesting it was a clear sign of a new high to come.

    At this morning’s low, we’ve fallen 64 points in just 5 trading days.  That’s almost 12.8 points per day, versus the 7.6 points per day for the advance.

    We’re getting a bounce off the SMA 200.  But, it’s just that — a bounce.  This is not like a few weeks ago, when POMO and PPT rode in and saved the day.  This time, TPTB want to see a little blood on the streets.  They (correctly) believe it’s the only way they can get Congress to do its job.  Consider this banner on Marketwatch.com:

    Suppose Reid’s plan passes.  That’s a partisan Senate plan, nothing more.  Are the House Republican’s any more likely to vote for Reid’s plan than Boehner’s?   This is still going down to the wire, with a messy compromise whose sole purpose is to save jobs — namely, your Congressman’s.

    It will not reduce our debt burden, nor save our AAA credit rating, nor stimulate a moribund economy.    Whatever relief rally we get will be short and sweet and will be followed by a plunge to below 1200.

    For anyone who’s curious, here’s the hourly SPX chart from January 4, 2008.

    And, here is today’s…  [updated at 12:05 pm EDT]

    BTW, I’m switching to Eastern time zone, just to make it easier on everyone.  I know it’s enough hassle for folks around the world to convert to NY time without having to subtract an additional 3 hours for the left coast.   I’ll probably screw up a few times, so bear with me while I get used to making the adjustment.

    ORIGINAL POST:  9:25 AM EDT

    I’m looking for a repeat of Wednesday, only worse.

    Looks like we’ll reach the 200 day moving average (1284.27) without too much trouble, with upcoming targets of 1273.54 (-2 std dev line of our regresion channel) and horizontal support at 1268.21. 

    I’m also watching VIX, which has completed two inverse H&S; patterns that indicate an upside to at least 27.67 [see: Do You Feel Lucky?]

    More later.

  • Do You Feel Lucky?

    Two days ago [Intra-day July 26] I wrote about an Inverse Head & Shoulders pattern developing in VIX.  I thought it would take us to 21.66, which it did — hitting 23.99 today.

    I know what you’re thinking.  Was that the only H&S; worth watching?  Well, to tell you the truth, in all this excitement I kind of lost track.

    Until tonight.  Just checked, and we’ve completed another couple of them that should pick up where the first one left off.

    The one with the white neckline is the bigger of the two, indicating an upside to 28.58.  The second, with the purple neckline, points to 27.67.  Either would do just fine, but I get real excited when I see two great patterns saying the exact same thing.

    If you’ve been looking at VIX’s lack of fireworks these past few days and thinking this downturn might not amount to much, this chart should make your day.

  • Our Fiscal Doomsday Machine

    David Stockman, former OMB director under Reagan, gave an interview with CNBC this morning.  It’s well worth the 11 minutes.

    http://video.cnbc.com/gallery/?video=3000035640

  • Intra-day: July 28, 2011

    UPDATE:  2:40 PM PDT

    We got our new lower low, missing a 1301.50 close by “that much.” 

    The -1 std dev line held, but should fall tomorrow as we head down to the 200 day moving average at 1284.27, the -2 std dev line at 1273.54 or horizontal support at 1268.21.

    If TSHTF, look for a test of the Jun 16 1258.07 low.  At this rate, and with a downgrading of US debt almost certain, we could easily tag it tomorrow.

    And, the ES vs. USD/CHF comparison we’re tracking…

    UPDATE:  12:15 PM PDT

    As we discussed this morning, the bounce has mostly vanished.  We’re clinging to a small gain, +1.51 at this time.  Note that RSI sits right at 32 on the 60 minute chart.  The last time we were here on the way down was just before yesterday’s huge sell off.  I expect the next iteration of that soon — possibly into the close today.

    UPDATE:  9:45 AM PDT

    So, the .618 Fib it was.  We should head back down and test yesterday’s low of 1303.49.  The next downside target is 1295, but I wouldn’t be surprised if we close relatively flat or down around 1301.50.  It marks the .886 Fib level, as well as the regression channel’s -1 std dev line (2nd lowest dotted blue line.)

    Declining beneath the 200-day moving average will amplify the bearish momentum.  The next downside targets would be the -2 std dev line (currently at 1273.50 and horizontal support around 1258, where we will complete [iii] of Minor 3 down.

    Just a quick note on the debt situation.  Zerohedge reports that Chinese credit agency Dagong will downgrade US sovereign credit rating as early as Monday, regardless of whether there’s a debt ceiling compromise.   I’ve printed an excerpt below.  See Zerohedge for more details.

    ******

    We will definitely cut the rating, regardless whether there will be a compromise. It has already dealt a blow to investors’ confidence,” Guan said. He said it could slash the rating to D if Washington defaults.


    Guan’s warning was starker than in an interview with Reuters on July 14, when he threatened to cut U.S. ratings in the coming three to six months if there was no major event to make real improvement in the U.S. fiscal situation.


    Guan defended Dagong’s higher AA plus rating for China, saying it’s natural for Washington’s biggest creditor to have a higher rating.


    Economists estimate that China has parked about 70 percent of its $3.2 trillion foreign exchange reserves in U.S. assets. 

    UPDATE:  8:05 AM PDT

    Looking for potential stopping points for this mornings rally…  Barring some exogenic influence,  the SMA 50 (1310.30) and the trend line off the 1370 top (the white dashed line below) ought to do it.  If we manage higher, the next logical stop would be the .618 or .50 Fibonacci levels at 1315.43 and 1321.46 respectively.


    CORRECTION:  7:15 PDT

    In last night’s post, I stated 1298.58 would complete the .886 retrace for a valid Bat pattern.  Just caught a programming error…the correct figure is 1301.74.  Meaning, we got 96% of the way there — generally good enough for the pattern to trigger.  Remember, though, that these patterns fail about 30% of the time.  So, no guarantees…

    UPDATE:  6:15 AM PDT

    Initial claims for the week ended 7/16 came in at a seasonally adjusted 398,000, down from 422,000 the previous week.  The 4-week moving average was 413,750, down 8,500.  States with nominal increases included California, with 20,813 due to a “return to a 5 day work week.”  While New York (-17,377) led the states with declines due to reduced layoffs and furloughs.

    The net effect won’t be known for a week or two, but there have been reports of sizable layoffs in the financial sector.  This is likely to put a damper on any improvements in New York,  as much of that economy revolves directly and directly around Wall Street’s fortunes.

    About 3.76 million received extended federal benefits for the week ending July 9, up 62,000 from the prior week (folks who’ve used up their 6 months of state benefits.)  And, 7.65 million people received either a state or federal benefit, up 320,152 from the prior week.

    In a turnabout from previous weeks, when the slightest good news was cause for a 100-point DJIA rally, the market is thus far only mildly impressed with these figures.   Could be that the lag effect of 12 days is enough to render an improvement meaningless.  The current debt ceiling debacle is likely to put a serious damper on next week’s figures.

    Just before the open, the E-minis are up only 2.75.

    ORIGINAL POST:  11:05 PM  PDT

    If the market declines to 1298.58, we’ll complete a bullish bat pattern with rebound potential to 1330.  But, there’s plenty of momentum on the downside, here.   While a bounce wouldn’t be surprising, it shouldn’t reach more than 1320 (just beyond the .382 Fib line.)

    SPX closed below its 10, 20 and 50 SMAs; the SMA 200 is at 1283.62.  Breadth today was overwhelmingly negative, as are just about every other technical indicator.  There is little to indicate any return to the upside except for the slight bounce we might see within the next 10 points.

    My target remains 1250 by August 5 and 1185 by August 22.

    Initial claims are due at 8:30 EDT.  Consensus is 415K, but I’m expecting that figure will be exceeded.  As sensitive as the market currently is, we should see a reaction. Pending home sales are due out at 10:00AM.  The market’s looking for -3.5%, but recent real estate data has been full of negative surprises.  Tomorrow should be no different.

    More in the morning.

  • Intra-day: July 27, 2011

    UPDATE:  1:00 PM PDT

    Here’s the dollar vs stocks graph we’ve been watching.  As we discussed, the dollar seems to have found its footing, while capitulation has officially arrived in the stock market.

    1 Minute

    60 Minute

    UPDATE:  12:00 PM PDT

    Forgot to mention the Head and Shoulders patterns we discussed yesterday.  VIX hit 22.53, obviously beyond our target of 21.68.  SPX also beat its target of 1313 and E-minis got to 1302.75, just beyond our 1303 target.  H&S; patterns have been very effective throughout this topping pattern.  They warrant a close watch.

    If we blow through the 1307 level, the next stop is 1301.65.  Either is good in terms of completing the bullish bat pattern discussed below.

    ORIGINAL POST:  11:30 AM PDT

    Getting this out a little later than usual this morning…pretty interesting day so far.  I hope everyone has been able to take advantage of the information in last night’s post.

    The 2011=2007 pattern continues to play out nicely, as today is a dead ringer for December 31, 2007.  The market sliced through the 10 and 20-day moving averages, and bounced at the 50-day as expected.  BTW, I’ll often post quick thoughts on Daneric’s Elliott Wave blog.  Dan runs a fantastic site, populated by (mostly) thoughtful and knowledgeable investors.  I highly recommend it.

    Durable goods orders came in at -2.1% versus the +0 .5% that the establishment expected.  This, along with the latest housing and employment figures, supports my belief that we never left the initial recession — which is now about to get much, much worse.  For more, see Thinking, Hoping, Praying.

    Our next bounce should be 1307ish.  It marks horizontal support, as well as the completion of a bullish bat pattern began on the 18th.  Normally, we’d look for a bounce back up towards 1320-1327, but I won’t be surprised if this one is only good for 1315 and a quick reversal.

  • Thinking, Hoping & Praying

    Durable goods orders came in at -2.1% versus the +0 .5% that the establishment expected.  This, along with the latest housing and employment figures, supports my belief that we never exited the initial recession — which is now about to get much, much worse.

    There may be pockets of positive news here and there, and some companies — especially those generating most of their sales from still-healthy overseas economies — will continue to post positive earnings.  But, the writing’s on the wall.

    In fact, it’s very difficult from this vantage point to see any game changing news on the horizon, as the stranglehold of excessive debt against depreciating assets can only be broken in two ways:  write downs or inflation.

    We’ve tried inflating our way out of trouble, but that strategy relies on our sustained ability to issue debt sufficient to cover our deficit — growing exponentially through the miracle of interest on interest.  It works beautifully…until it doesn’t.  And, now, as investors worldwide are reconsidering the value of “full faith and credit” the cracks are becoming obvious.

    That leaves write-downs.  Many of us have experienced the joy of watching heavily-leveraged assets decline in value.  It sucks.  As anyone who’s ever raided his 401(k) to make his mortgage payment can tell you, it’s hard to justify hanging on to those assets when they’re declining in value.

    There’s an old saying in finance:  if I owe you a hundred bucks and can’t pay, I’m in trouble.  If I owe you a million bucks and can’t pay, you’re in trouble.  Americans owe $13.7 trillion in mortgage debt, mostly on single family residences that are declining in value.  And, as the bankers who’ve been gifted trillions of our grandchildren’s dollars would attest (if they were capable of speaking the truth) the lenders of the world are the ones in serious trouble right now.

    I’m talking to you, China.  You, too, Middle Eastern despots.  Let’s not forget banks, insurance companies, Freddie and Fannie.  But, unfortunately, we’re also talking about retirees, veterans trying to collect VA benefits and kids with savings bonds.

    Look beyond real estate debt, and the problem is obviously much bigger.  Lenders are worried about the value of their loans to whole countries, present company included.   They should be.  They’re about to be stiffed.

    This recession started because of debt.  The debt will have to be dealt with on a global scale if we’re ever to recover.  As an investor, I’m thinking about ways to protect myself.  As a citizen, I’m hoping it doesn’t come to armed conflict.  As a parent, I’m just praying that the world we leave our children is worth inheriting.

  • Happy New Year!

    And, in recognition of the various nationalities who’ve checked in here lately…

    Bonne année, 
    Sun nien fai lok, 
    xin nian kuai le, 
    gelukkig nieuwjaar,
    šťastný nový rok,
    yeni yılınız kutlu olsun,
    glückliches neues Jahr, 
    Szczesliwego Nowego Roku, 
    Stastny Novy Rok, 
    un an nou fericit,   
    Felice Anno Nuovo,
    Feliz año nuevo,
    С Новым Годом, 
    nav varsh ki subhkamna,
    Щасливого Нового Року,
    and…
    नये साल की हार्दिक शुभकामनायें.

    My apologies to the Canadians.  Couldn’t find a proper translation…

    ***********************

    Those who have been following this blog for any length of time know why I’m wishing you a Happy New Year in July.  Under the 2011 is 2007 theory, tomorrow is the equivalent of December 31, 2007 and the market is about to fall apart big time.

    It’s been almost three months since the parallels first occurred to me.   Although the timetable has no doubt been thrown completely off by Congress’ apparent inability to do their phoney-baloney jobs, the pattern has held up remarkably well.

    The only obvious discrepancies have been the shape of the 3/16 – 4/15 advance and the last rally’s advance to the regression channel’s 1-standard deviation line instead of its midline.  Otherwise, moves have occasionally arrived slightly faster or slower, but they’ve arrived as expected.

    I was worried that a stick-save-debt-ceiling-resolution-rally-to-the-moon would ruin everything. But, in that sense, Congress has been very accommodating.  They’ve bungled this mess so badly that any deal currently on the table is sure to disappoint everyone but those on the right side of CDS.

    Toss in steadily declining economic indicators that — to these cynical eyes at least– spell a resumption/intensification of the recession, and there is little on the horizon to save the bullish case.

    Other indicators I’m currently watching:

    • a H&S; pattern on SPX over the past week — points to 1313 on cash market and 1303 on ES
    • an IHS pattern on VIX that indicates a value of 21+
    • the histogram, RSI and MACD on the daily charts have all turned negative
    • breadth indicators are mostly negative
    • VIX trading above its moving averages
    • EUR completion of a bearish bat pattern relative to USD, dollar bottoming relative?
    • divergence on weekly charts across multiple equities indices

    As usual, I’ll post on specific patterns and indicators as I see them intra-day.  There’s also a great deal of economic news coming out this week, and I’ll opine as I see fit.