


“The 1101 touch occurred 69 sessions after the May 2 high. In 2008, the equivalent bottom was 70 sessions after the Oct 11, 2007 high. The 2011 decline amounted to 19.6% from the high; in 2007 it was 19.4%. The 2007/8 total point loss of 306 points was very closely matched by 2011′s eventual loss of 296 points. And, the eventual low in 2011 came 108 sessions after the top; whereas, 2008′s came 107 sessions after the top.”
********
I received an excellent question from a reader this morning and found myself pouring a little more into the answer than usual. Maybe the answer — which swerves headlong into the issue of whether chart patterns work — deserves its own post.
The reader suggested that the Fukushima earthquake in Mar 2011 was the cause of the market’s decline and, since such a huge event was unlikely to repeat in our timeline, the current analog we’re following is unlikely to play out.
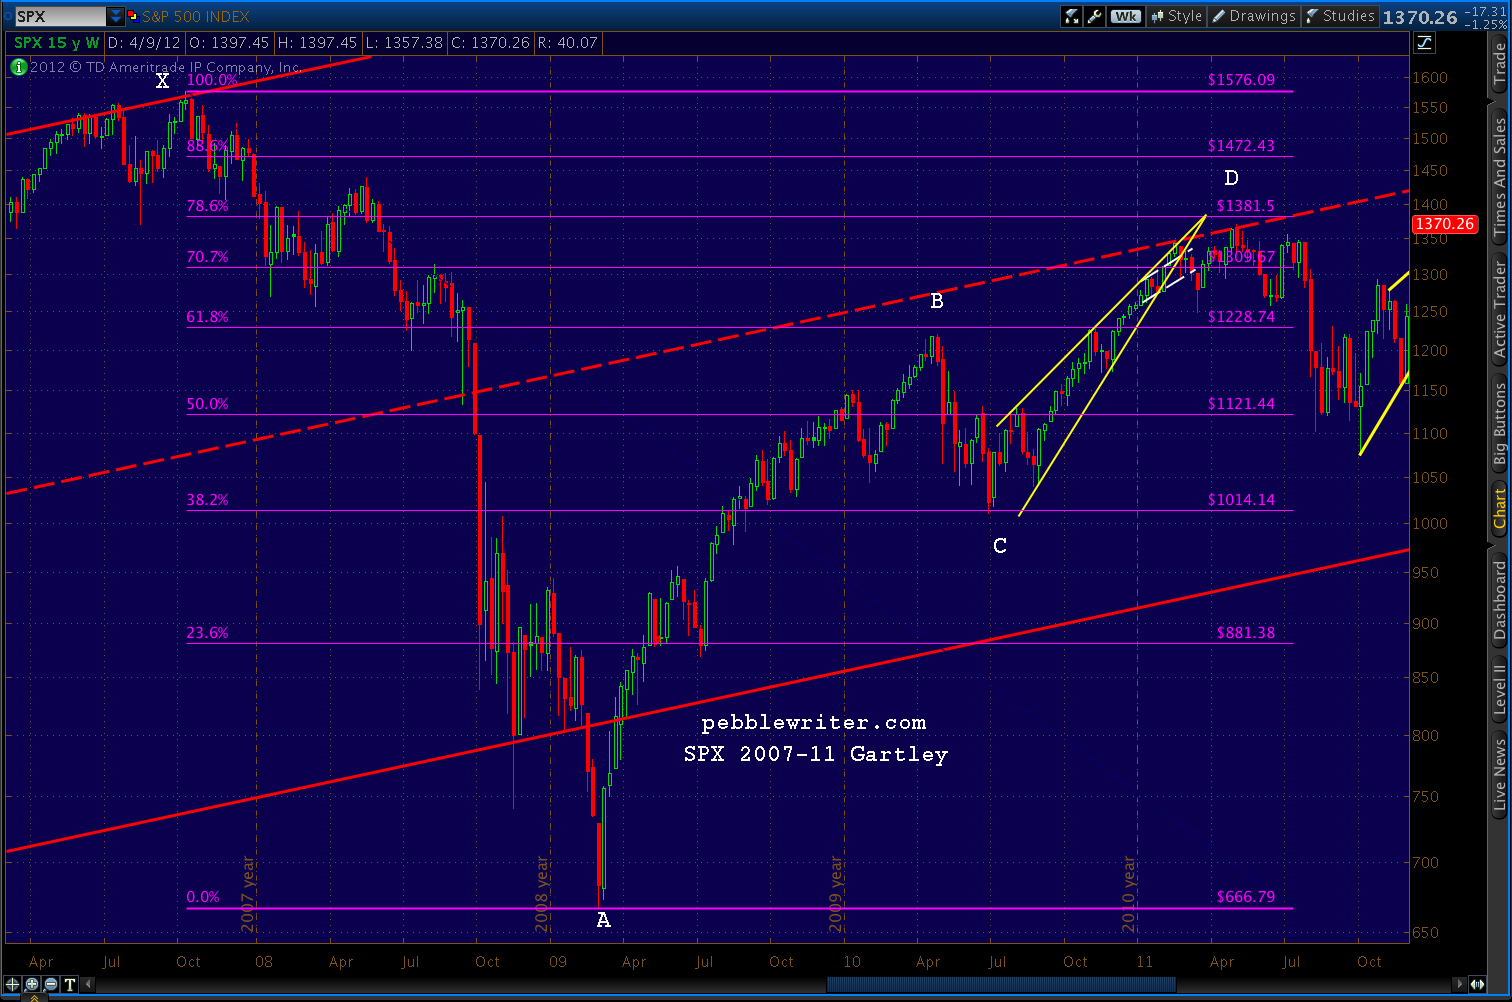
While the earthquake obviously helped the market along, SPX started down in February 2011 because: (1) it was very deep into a rising wedge; and, (2) it had completed a huge Crab pattern that started with the April 2010 sell-off; and, (3) it had just completed a H&S pattern. The following chart clearly shows all three patterns.

Before Fukushima came along…
The apex of the rising wedge (solid, yellow) was around 1380 (the .786 of the huge Gartley Pattern set up by the 2007-2009 decline.) SPX had come .886 of the way in time and price towards the apex — very deep indeed.
From months earlier, the Crab pattern (red, with key points in white) had forecast 1348.89. We had reached 1344.07 and were already reversing as typically happens.
And, the Head & Shoulders pattern (dashed, white) had already completed. It targeted 1250, which is exactly where we were 8 sessions later.
But, perhaps the strongest reason had SPX turned tail at 1344 was because it had just tagged a trendline (bold, red dashed) that dates all the way back to 1935. This TL is actually the midline of a channel that, with very few exceptions (mostly from 1997-2002) , has contained all the major market moves back to the Great Depression.
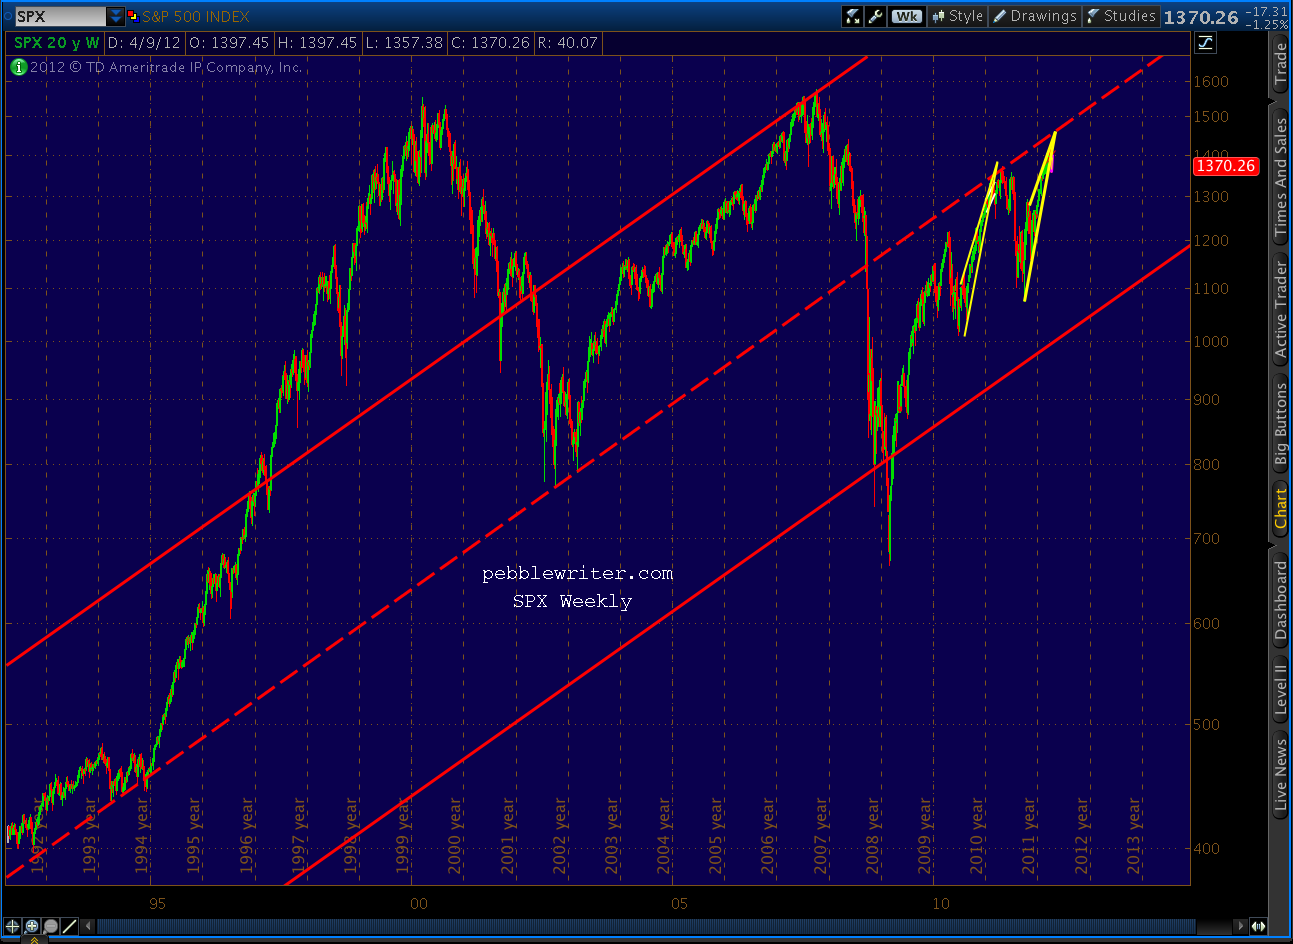
This midline had been support for SPX since 1991, but became resistance when SPX fell back through in September 2008.
After Fukushima…
The market continued to do what these chart patterns had already predicted. In fact, six sessions after Fukushima, the market had completely recovered — reaching the May 1370 high only 29 sessions later. Stay with me, now, because this is where it gets interesting.
On May 2, SPX was on its way to completing that big Gartley pattern. After 910 points down, and 704 points back up, SPX was a mere 11 points from completing a very well-formed Gartley at 1381.50. Nothing could stand in its way — except that annoying midline, again.
Nine weeks and a Bat pattern later, SPX began its 255-pt swan dive — just as the analog said it would.
With the backstory out of the way, stay tuned for Part 2 in which we discuss how the analog predicted last July’s crash (and what lies ahead.)