

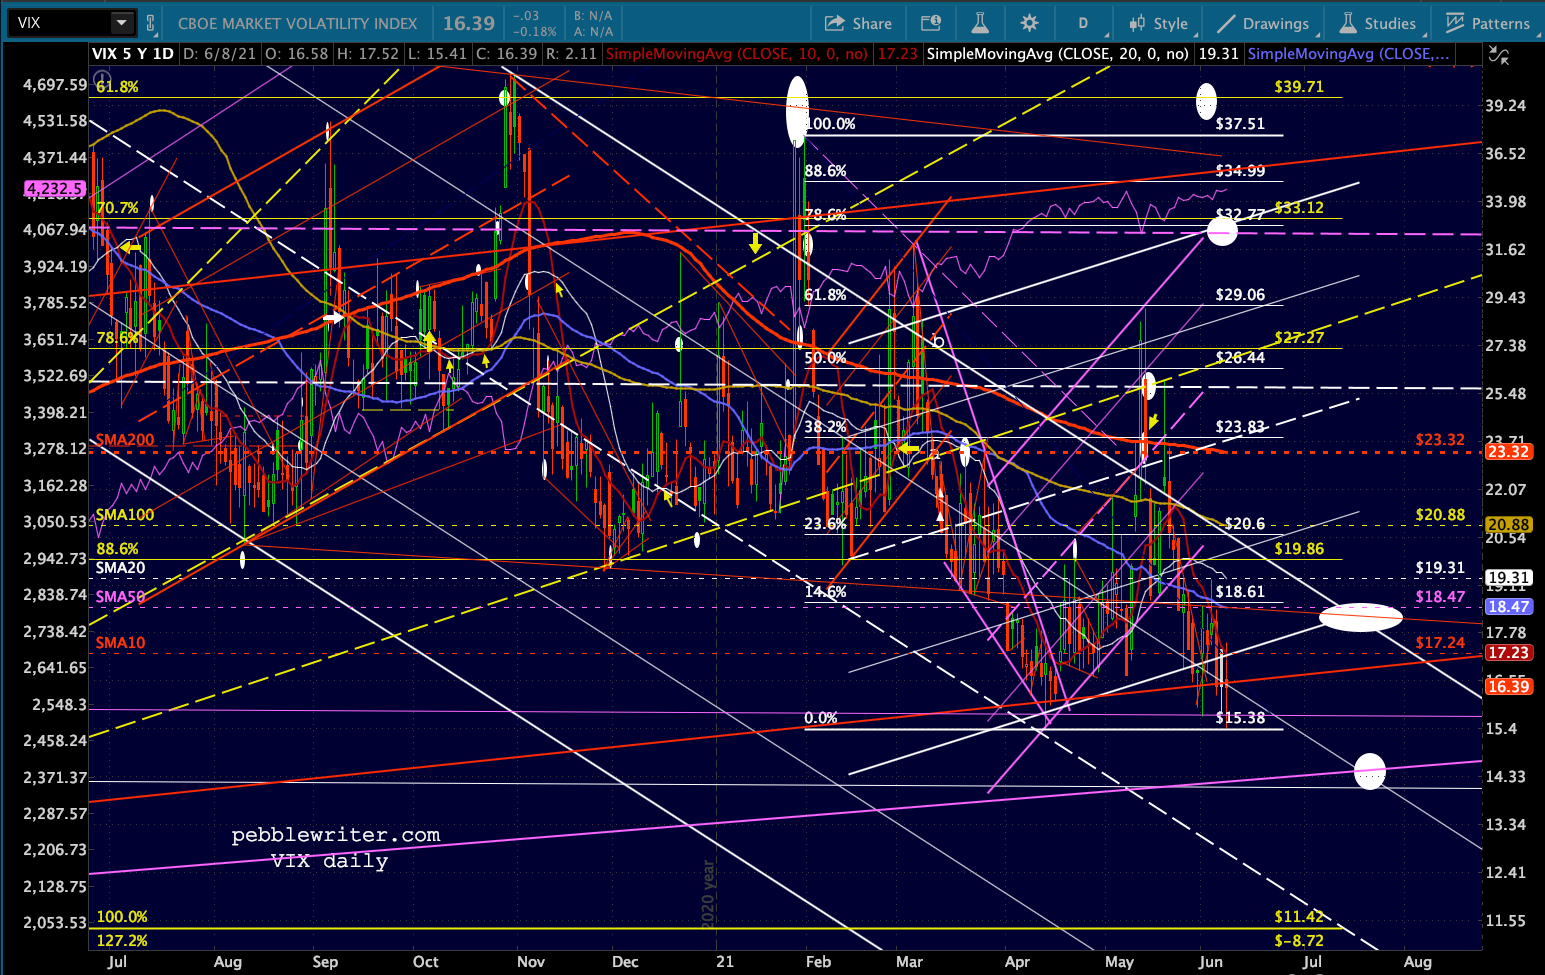
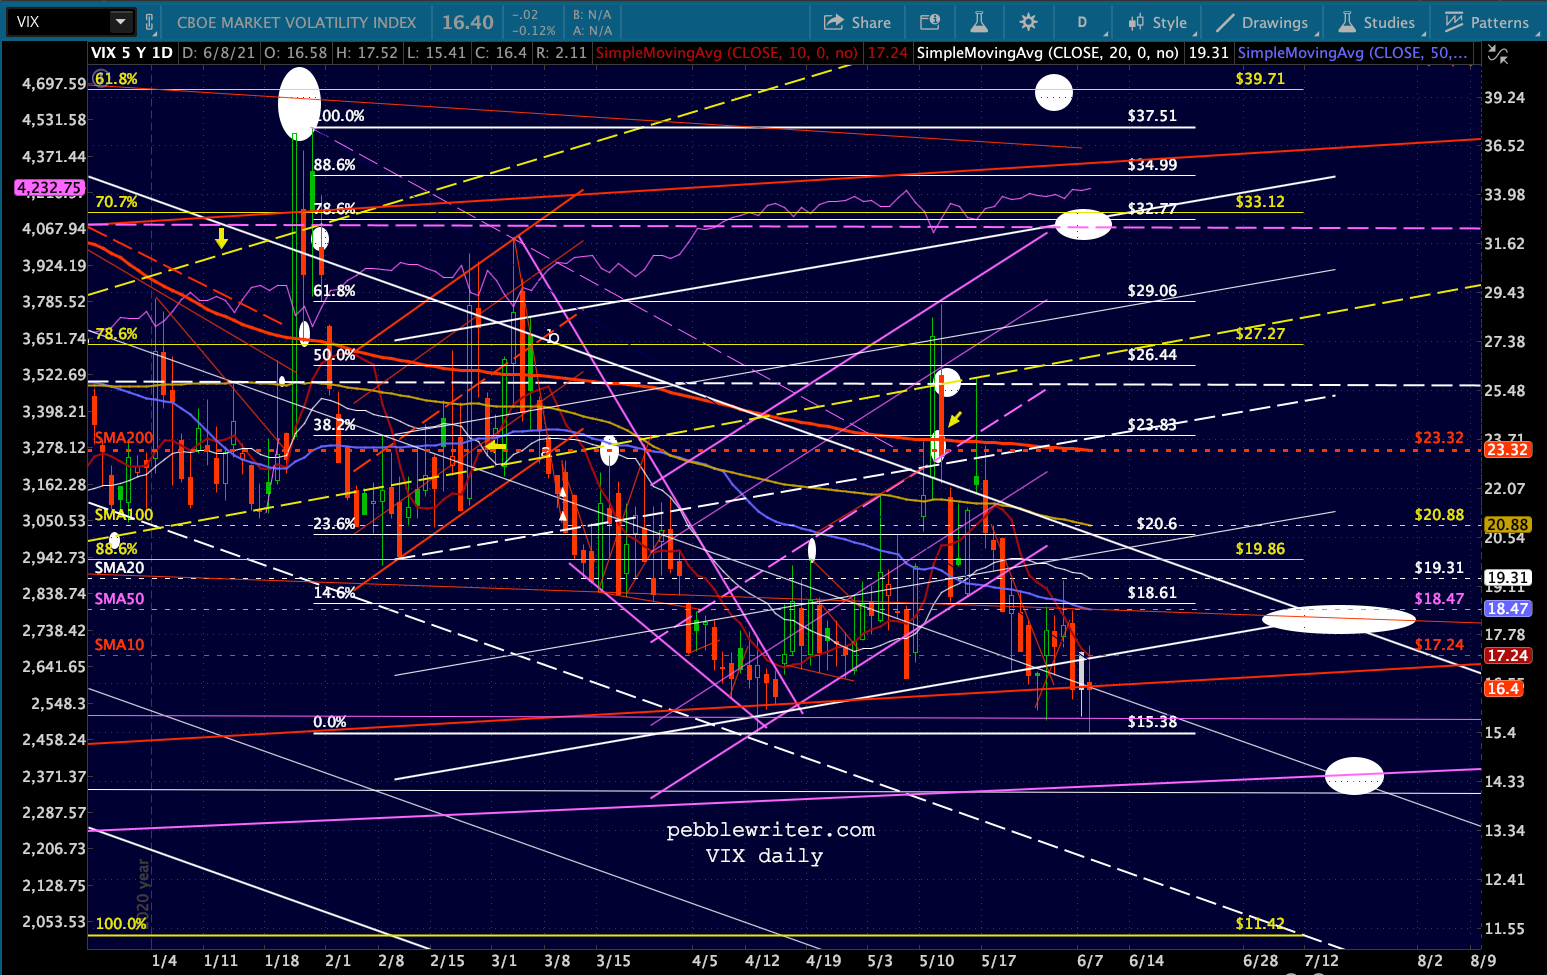
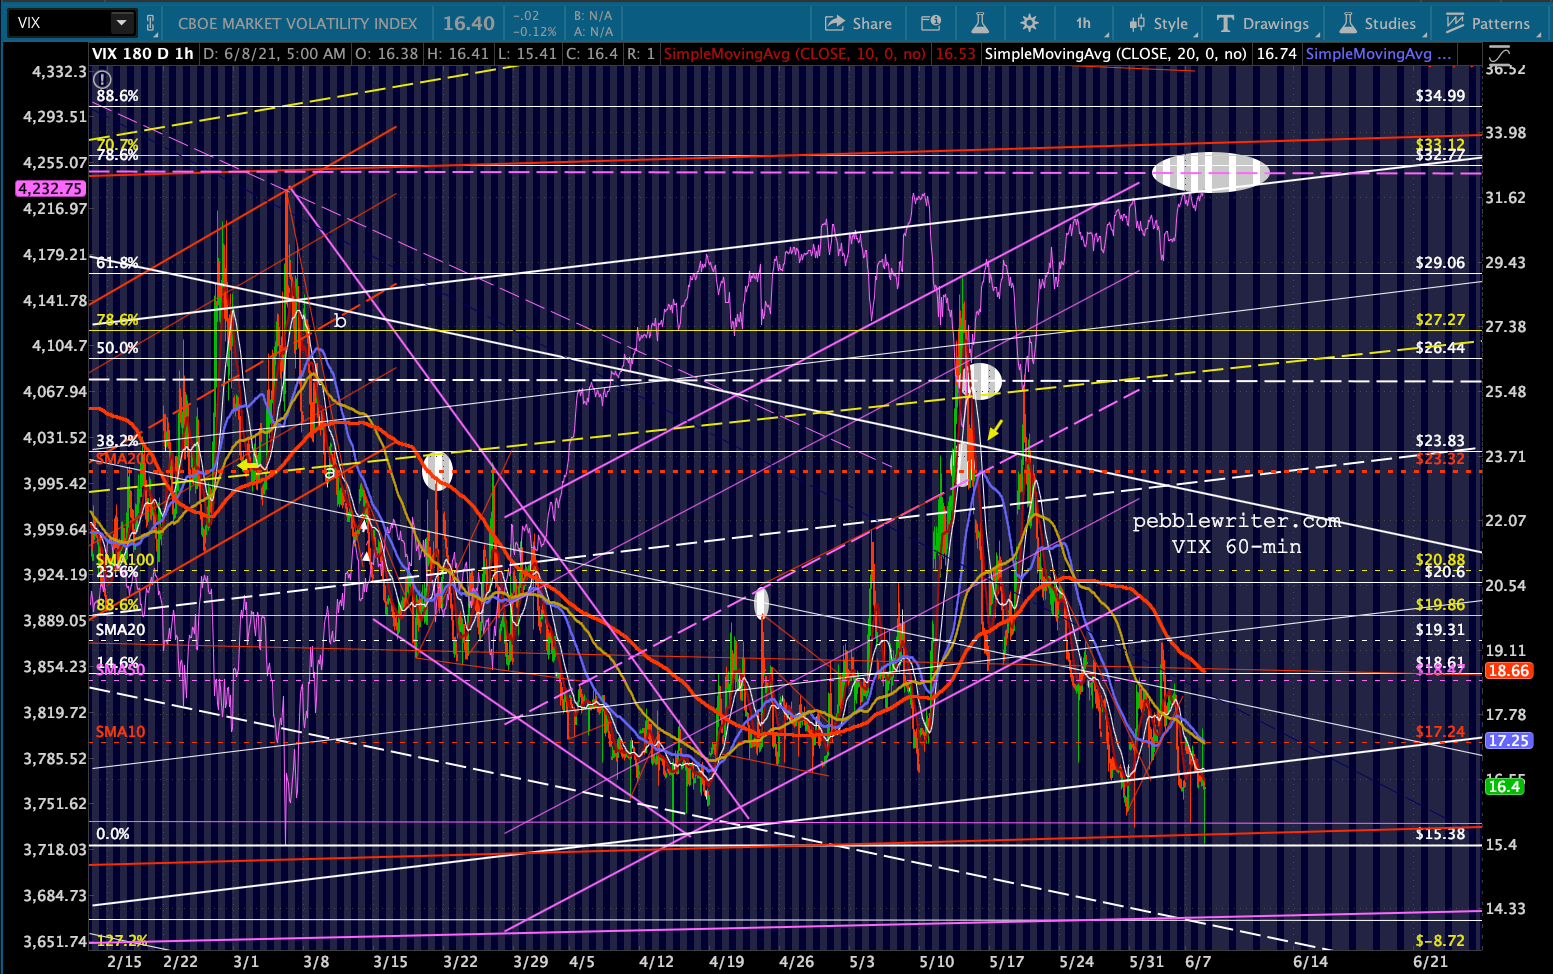
VIX’s collapse continues, putting ES within a few points of its all-time highs. At 15.15, VIX has given up nearly 50% since its May 13 highs and has reached the lowest level since Feb 20, 2020 – just before its ascent to 85.47 less than a month later.
 continued for members…
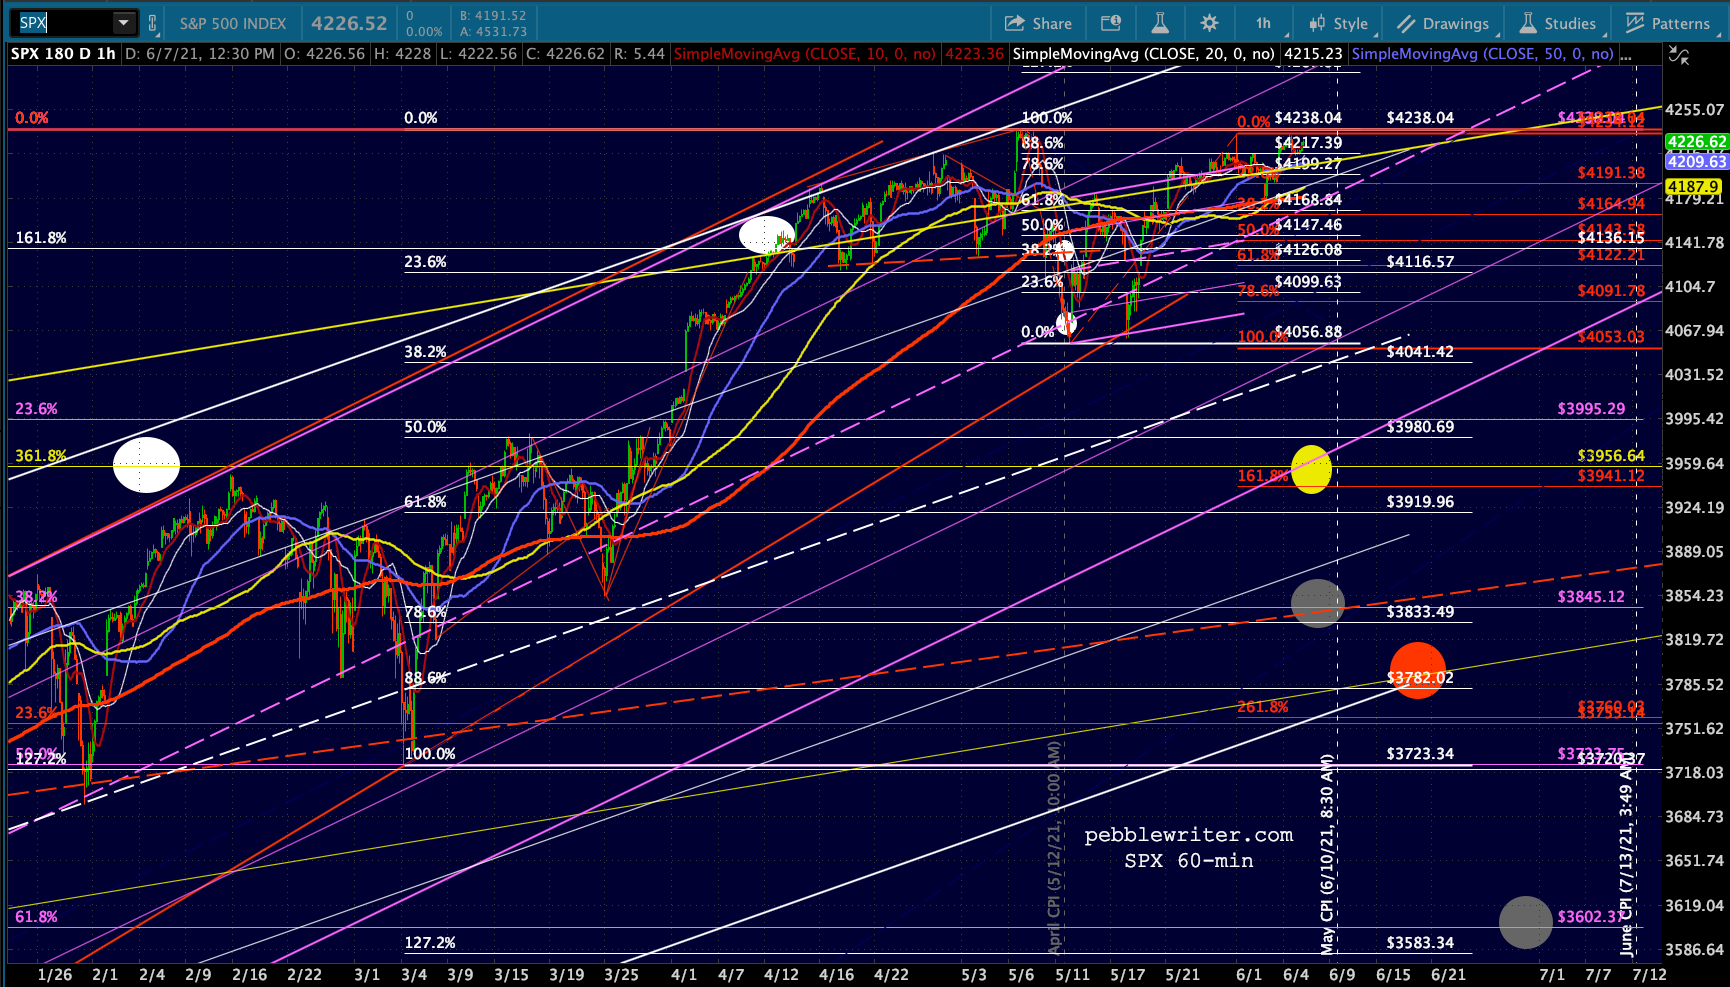
 As we’ve been saying for the past two weeks (but which feels like 2 years) stocks are simply being propped up – likely with the goal of providing more of a buffer for a potential CPI data plunge.

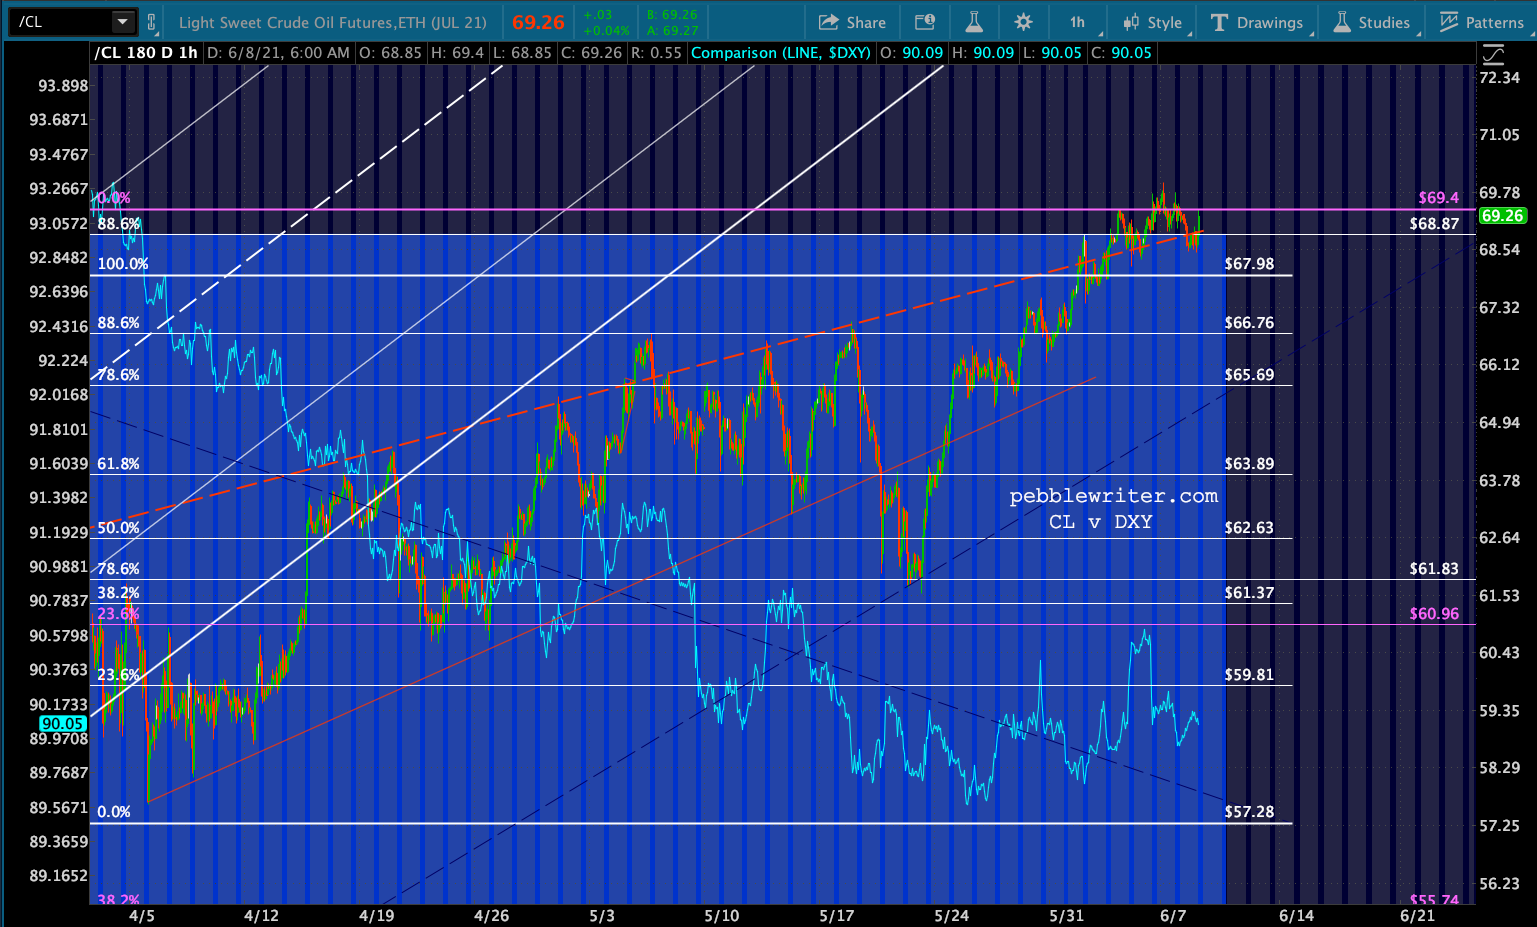
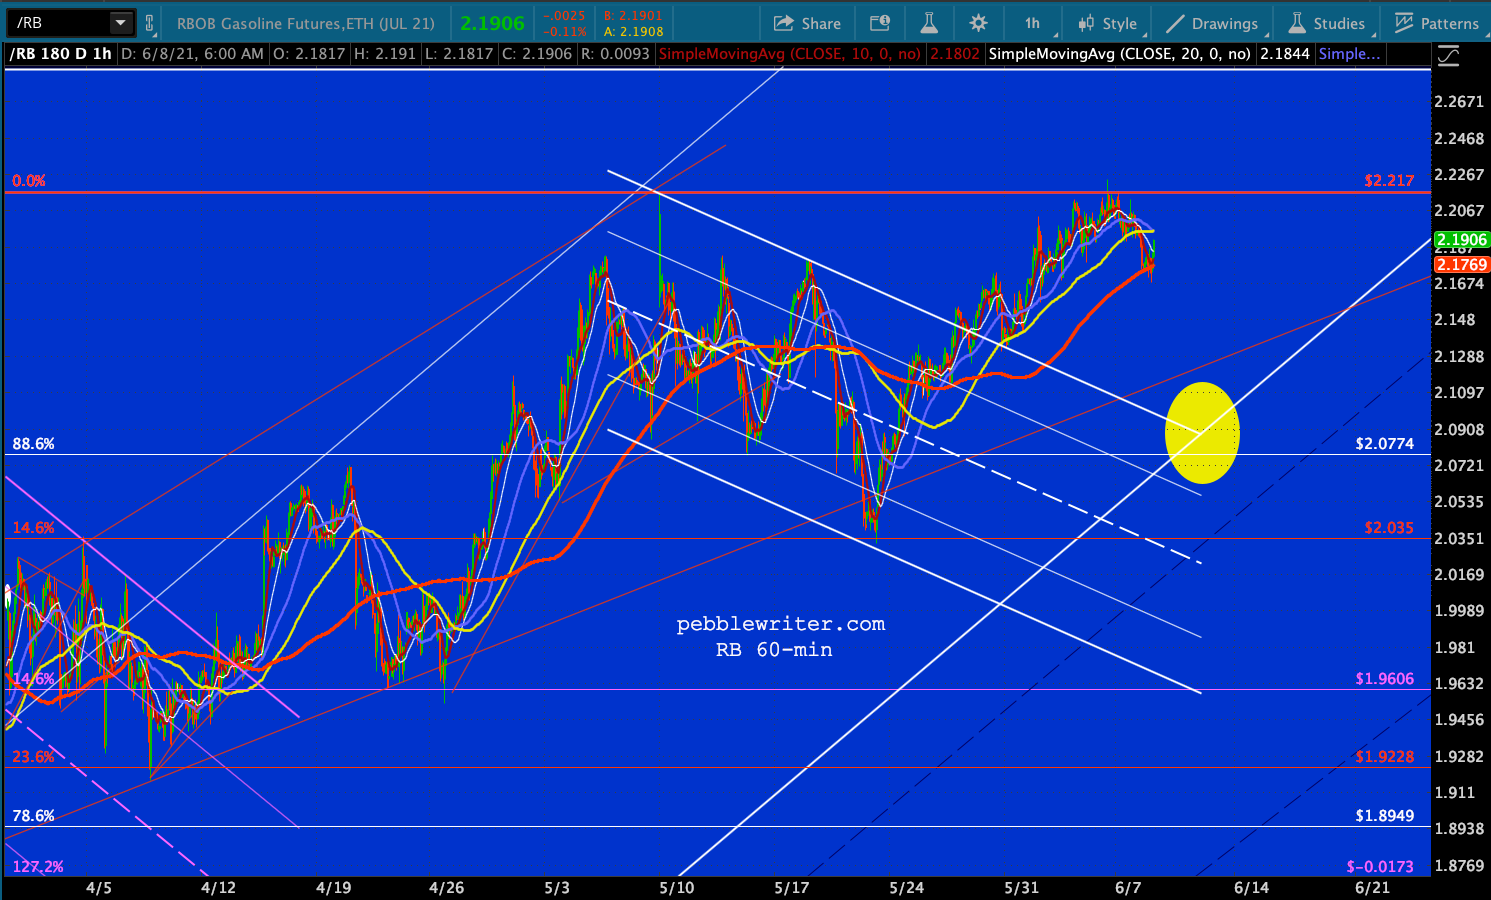
 Nothing terribly new here, with CL and RB still threatening a breakout…
 …and USDJPY still doing the same.


 Bond yields are still slumping, despite the obviously rising inflation picture.
 Some have asked about our yield curve model, wondering whether it’s still calling for a downturn. Remember, this latest spike in the 2s10s has differed from the previous ones.
  The previous ones in 2000-2003 and 2007-2009 were produced simply by a faster plunge in the 2Y than the 10Y. The suddenly widening gap produces a spike in the 2s10s.
This one has been driven exclusively by the sharp rise in the 10Y while the 2Y has flatlined.
 What it boils down to…the Fed has become much more adept at managing the treasury yield curve.