

VIX has been falling steadily over the past two years – so steadily, in fact, that it has established a very well-formed falling channel that is nicely correlated with SPX’s unrelenting rally.
 The VIX futures (VX) chart above shows the sixth major spike running into overhead resistance from both the channel top as well as a trend line from the July lows. Quite simply, if VX can push back above the channel top then equities are in for more trouble. Should VX’s retreat continue, stocks’ meltup isn’t over just yet.
We’ll dig into some of the chart’s nuances after reviewing the rest of today’s charts. Futures are off slightly after a very strong bounce which, again, failed to clear the 50-day moving average. continued for members…
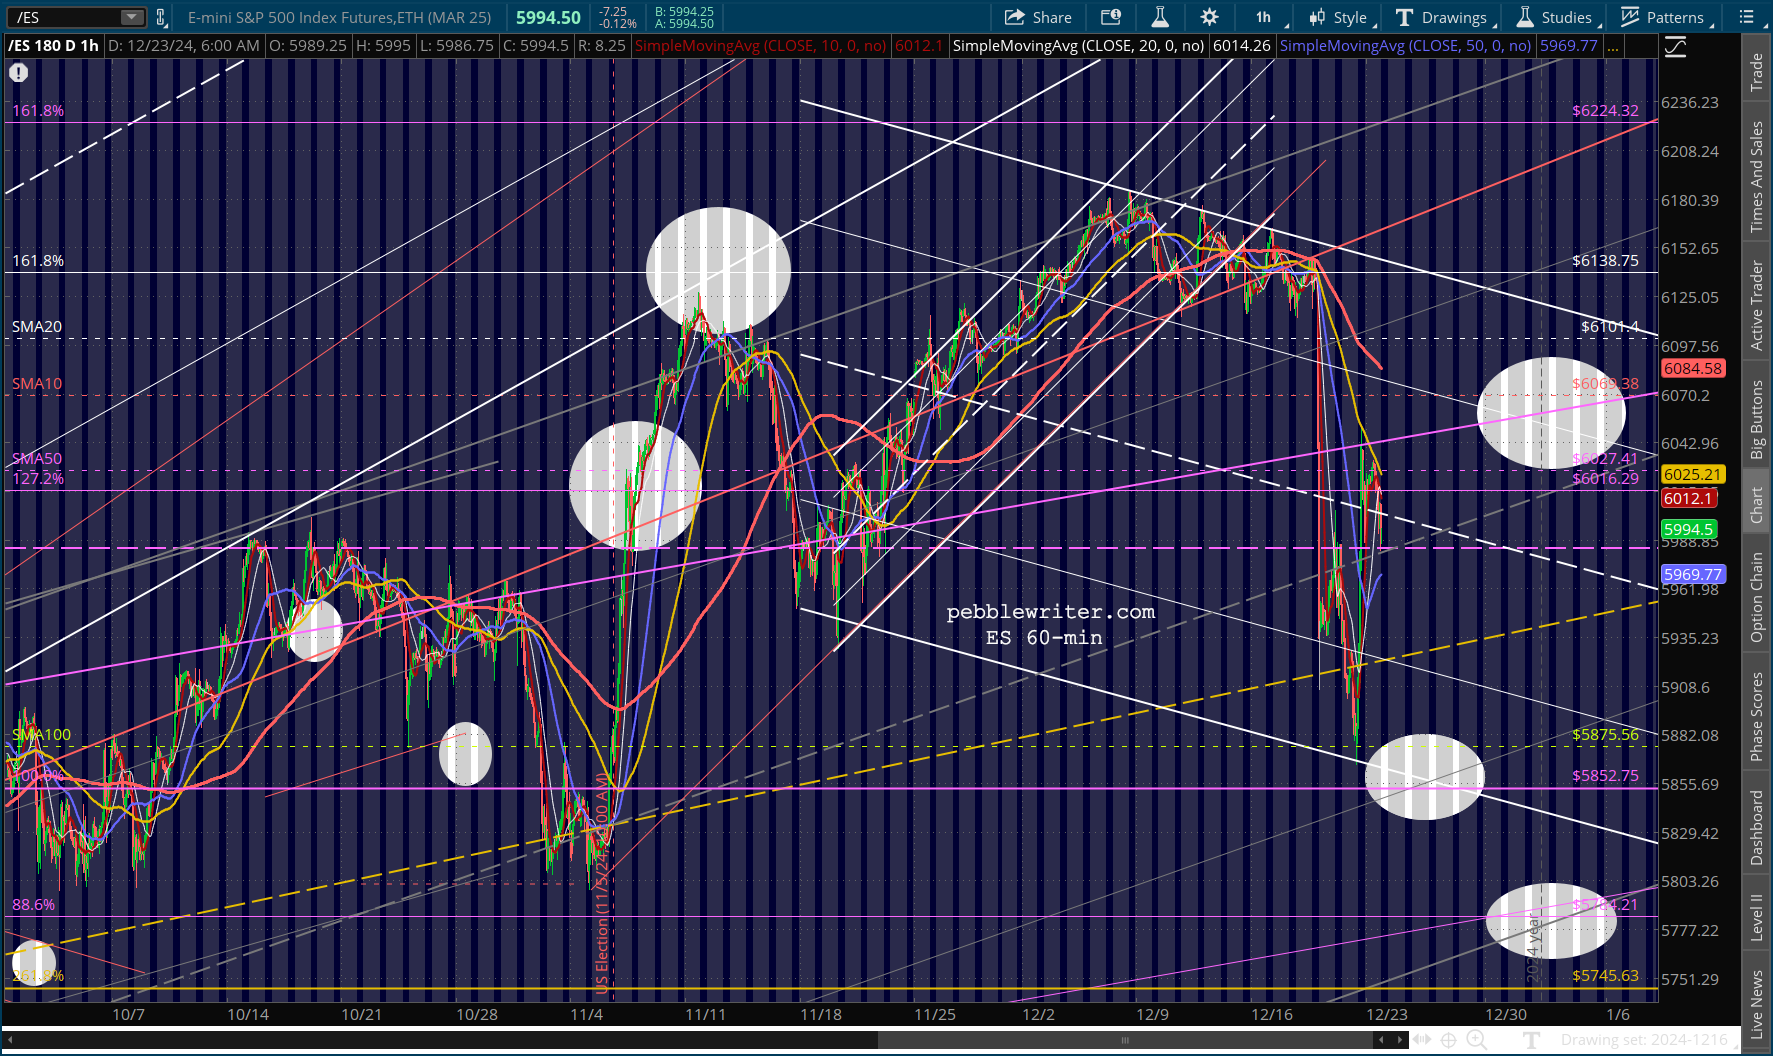
 The same can’t be said for SPX, which pushed above its SMA50 last week before backtesting it. This contradiction complicates the near-term outlook.

 Note that even SPX’s RSI chart shows a slight push back above a TL which might have provided overhead resistance – but, so far, hasn’t.
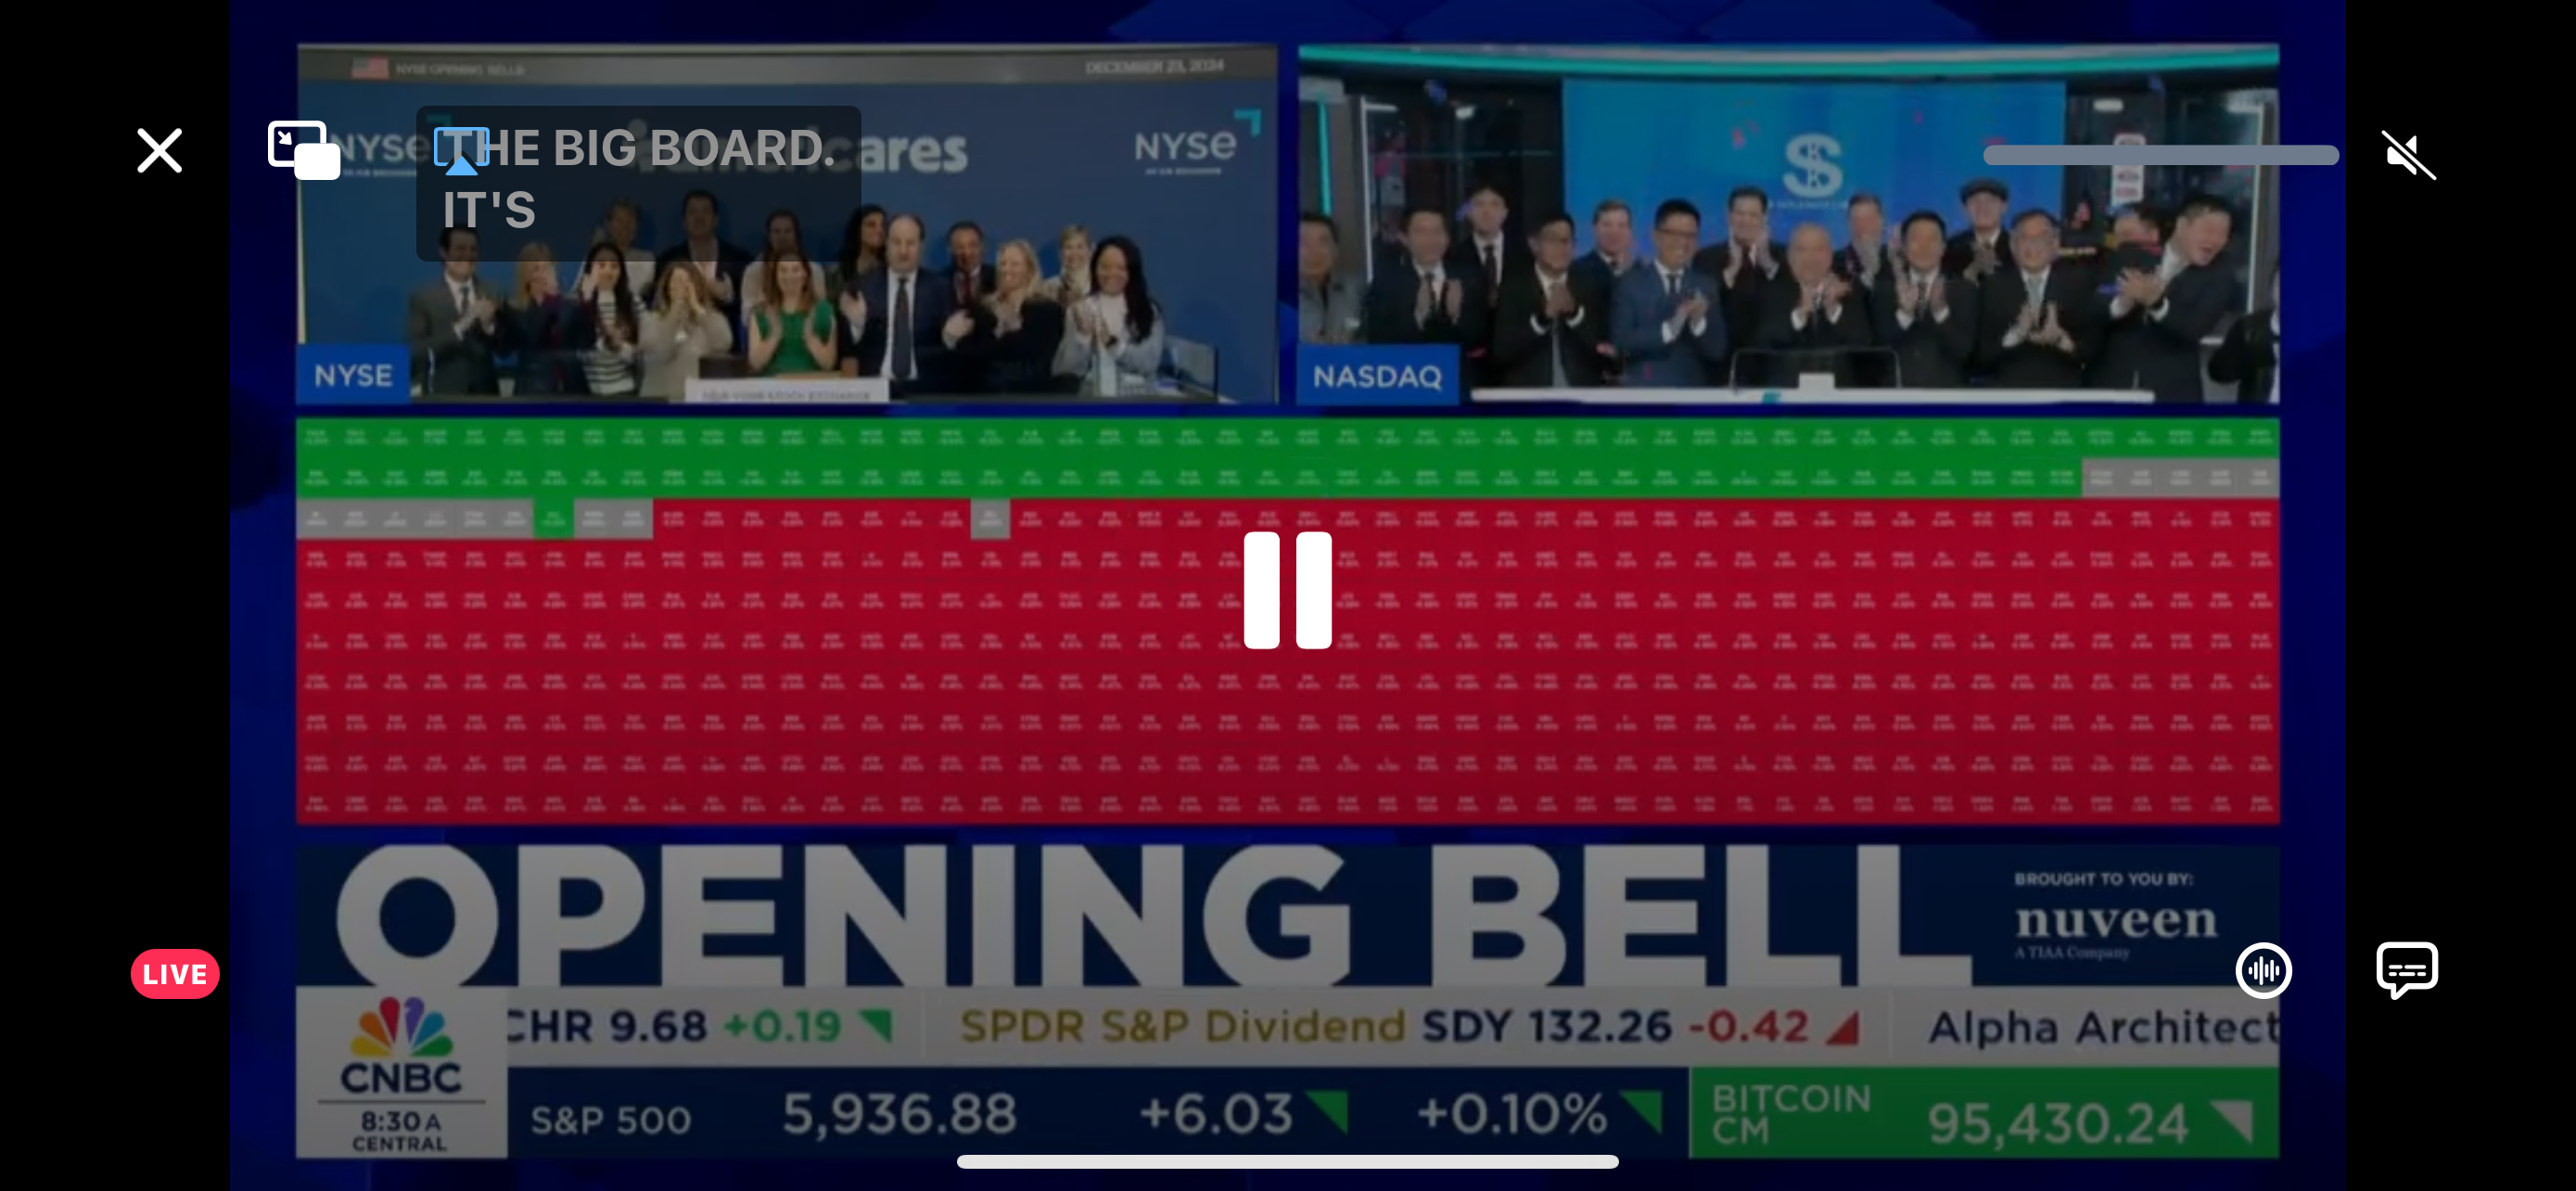
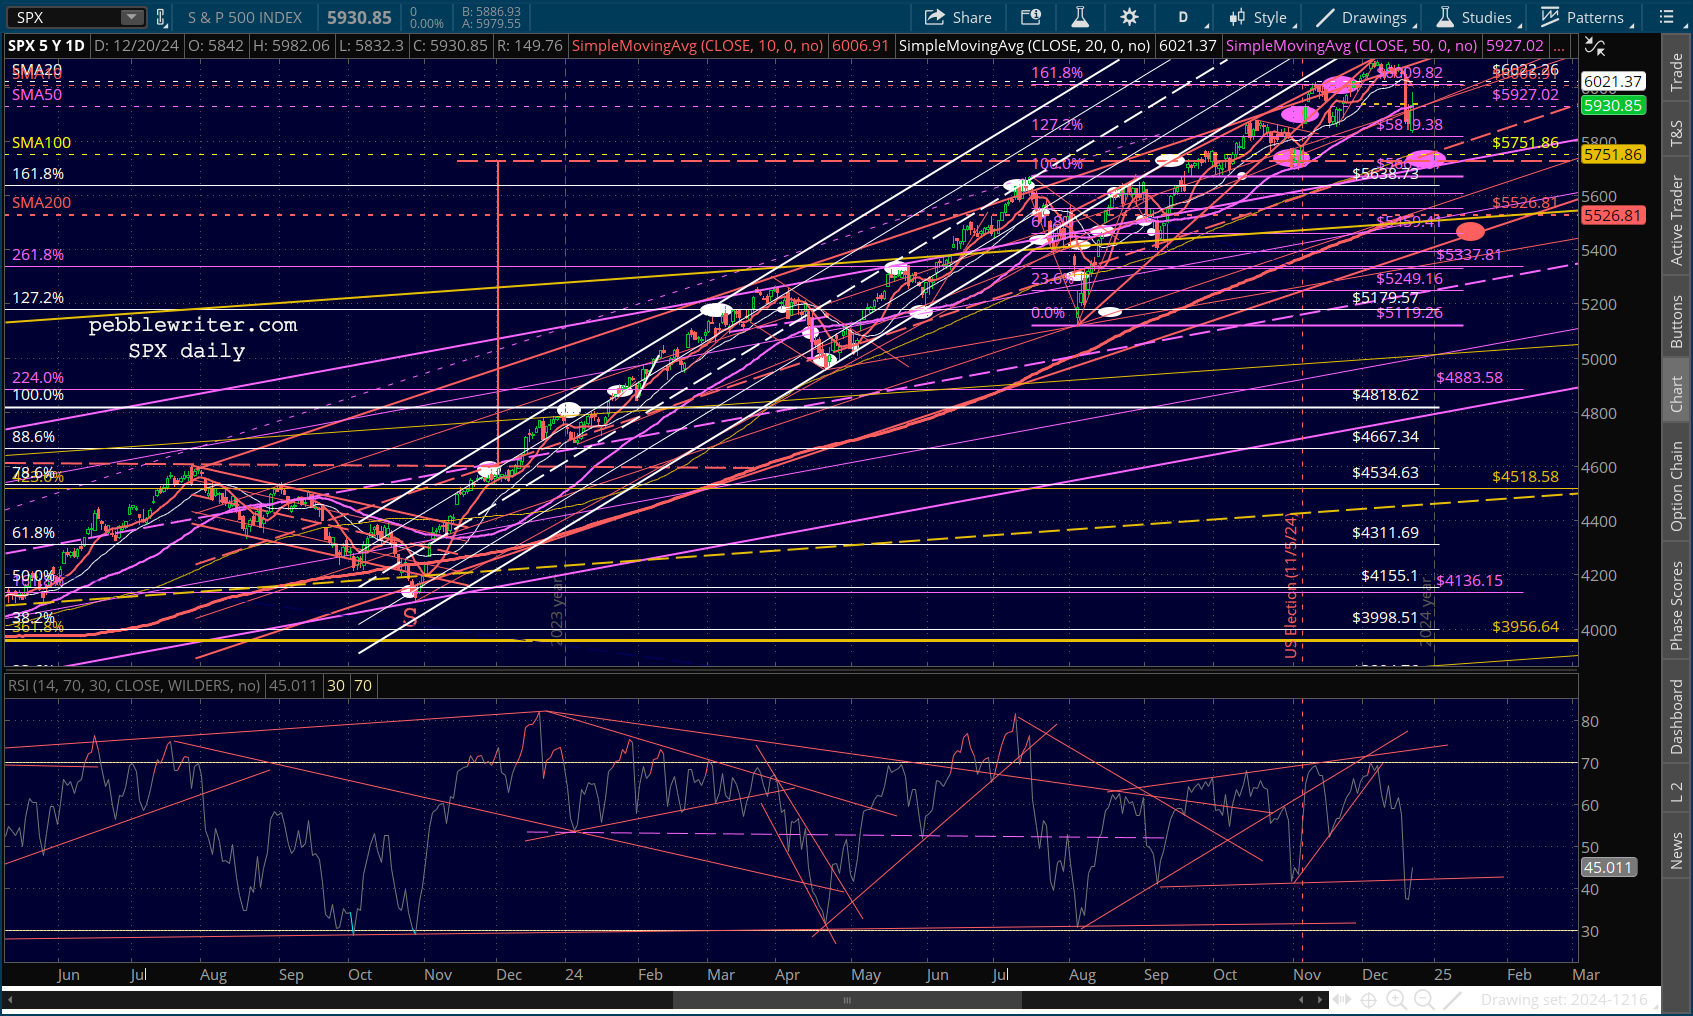 The confusing outlook is partly due to the lopsided performance of the Mag 7. The market just opened 6 points in the black even though the vast majority of stocks opened in the red.
 Currencies are also providing their own brand of support to stocks, with the euro’s very logical steep slide on pause. Note, however, that it has failed to retake Oct 2023’s highs as it did last month.


 While CL and RB are holding near recent lows…

 …TNX continues to inch higher. IMO, this remains the biggest threat to higher stock prices. And, it’s one that won’t easily go away – particularly once Trump’s tariffs come along.
  Now, back to VIX. The weekly chart going back to 2009 shows a series of breakdowns in VIX which contributed to legs up in stocks. The two most noticeable breakdowns are the solid purple TL, which corresponded to the 2016 recovery, and the dashed red TL, which correlated with SPX’s breakout in Jan 2023 of the falling channel which had presided over the 2022 correction.
 They can be seen in the SPX chart below. Note that the 2016 breakout also broke back above the important 1.618 extension of the 2007-2009 crash. The 2023 breakout, likewise, put SPX back above the 3.618 extension of that same crash.
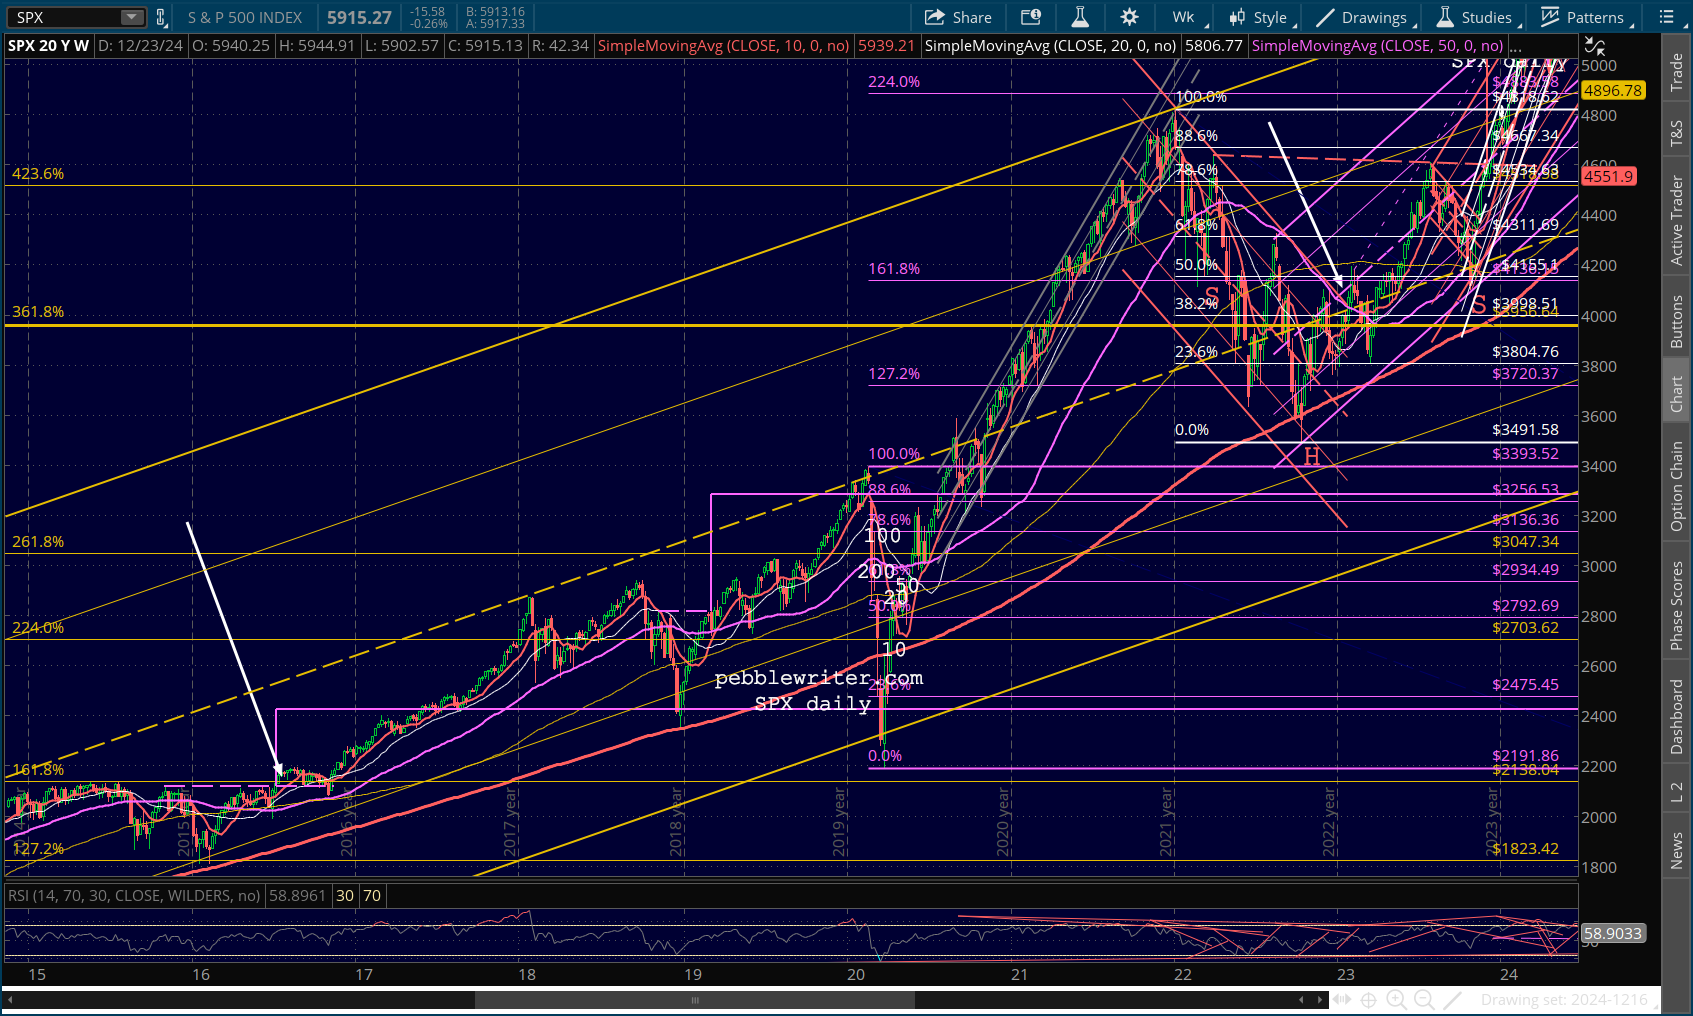 The subsequent major upside moves have all occurred as the result of either strong reversals in VIX from major breakouts or lower lows along the falling white or purple channels.
Bottom line, it’s going to be very hard for markets to tumble much unless VIX can break out of the falling purple channel or a fan line from the Aug 5 highs.

When it does, however, watch out!