

Two short weeks ago I pointed out that, like many indices, RUT was at a critical level of support [see: Bonds New All-Time Lows.] Though we had already turned bearish, there was still the possibility that RUT would pull off one of its trademarked rebounds.
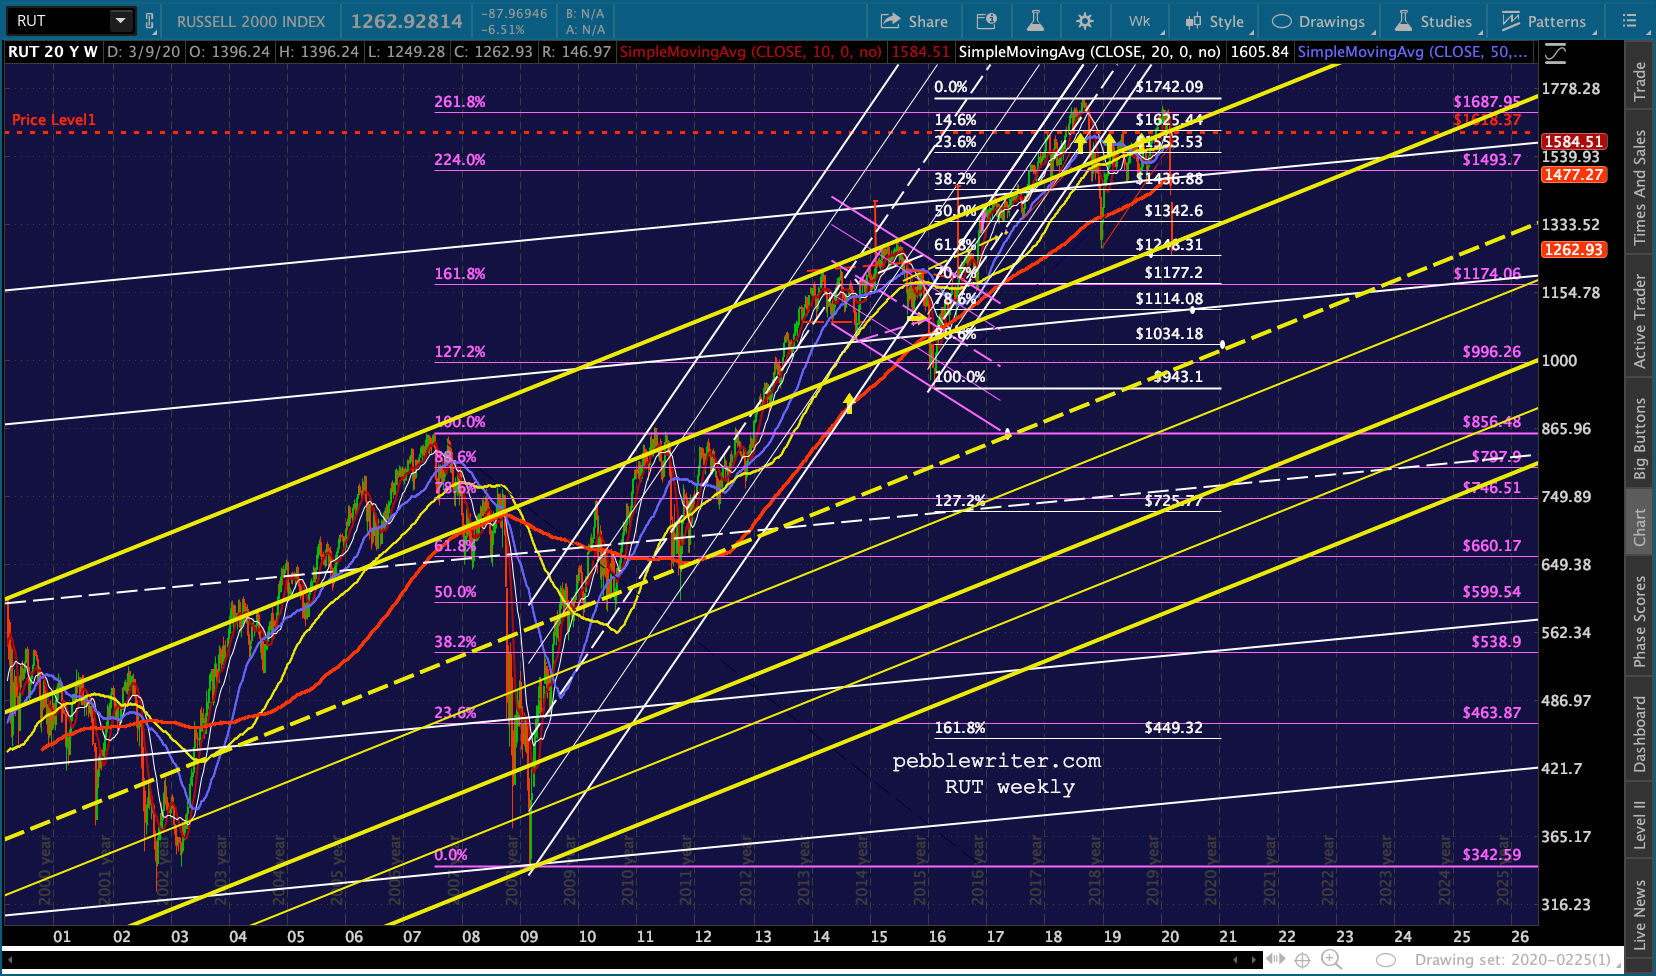
 This time it didn’t. In fact, just today it reached another interesting level of support – this time, the .618 Fibonacci retracement of the rise from 943.10 in Feb 2016 to 1742.09 in Sep 2018. Unlike SPX and DJIA, this was the high for RUT (an anomaly which has confounded many who still believe in efficient markets.)
 What’s more, this (near) tag is occurring at virtually the same instant that SPX has (nearly) tagged its 2.24 extension – our primary downside target since late last year.
Meaningful, you ask?
continued for members…Watching both of them creep toward their respective targets is a little, well, creepy. I’m a skeptic about most things, but especially coincidences of this sort. If SPX is meant to rebound at 2703.62, RUT is meant to rebound at 1248.31. Something with Fed or White House fingerprints all over it will happen to trigger a big bounce.
Otherwise, the .786 at 1114.08 or .886 at 1034.18 will come into play. As the weekly chart below shows, the .786 would also be a tag on the large white channel .786 line. The .886, depending on when it happened, would also be a tag on the rising yellow channel.
 Because we already got so close to the white .618 in Dec 2018, either pattern (Gartley or Bat) would be legit. I have no preference. Traders should consider this a buying opportunity with a very tight leash on it. In other words, use appropriate stops.
GLTA.