

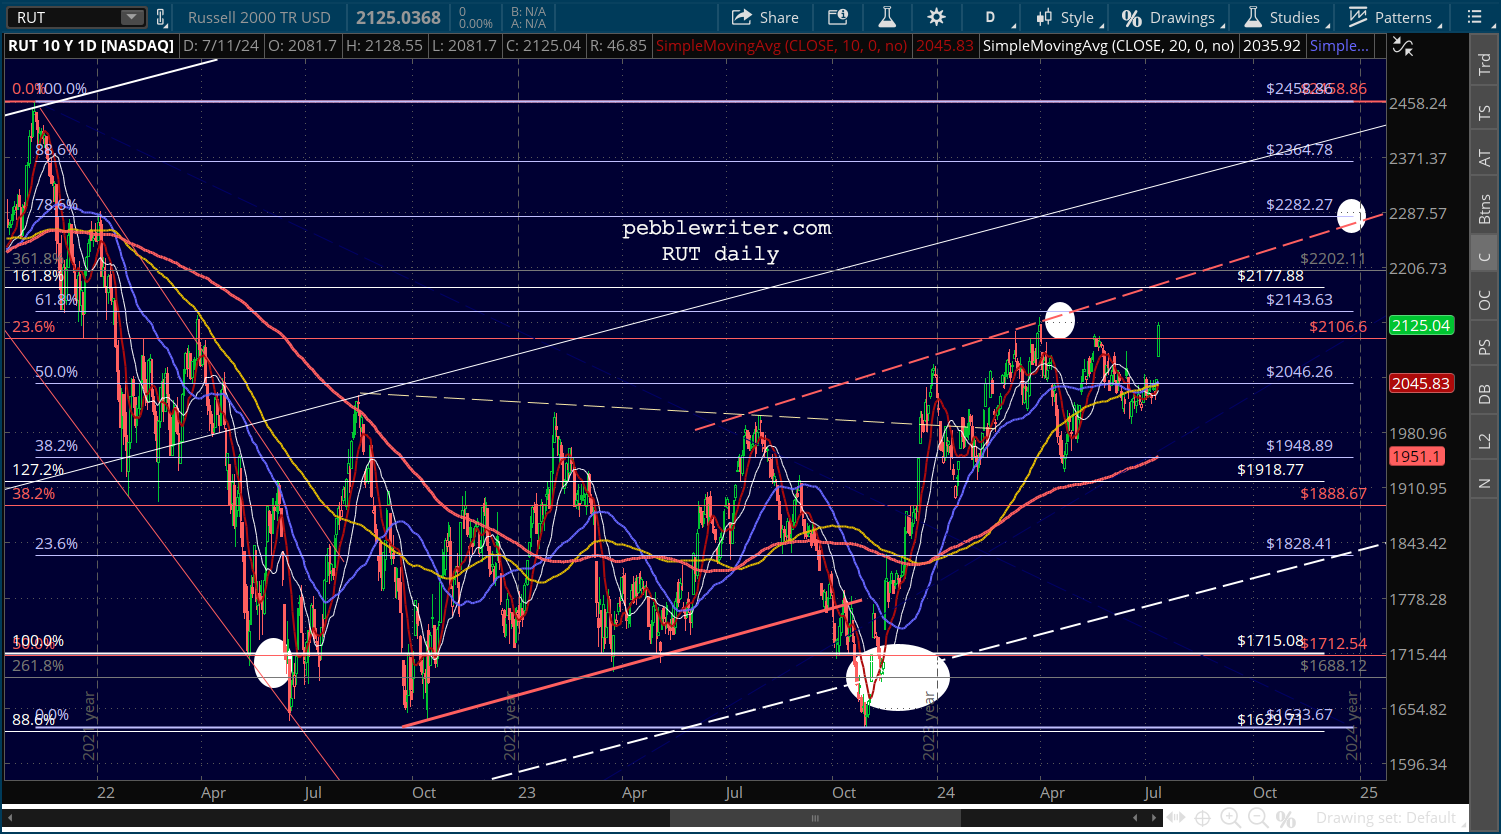
RUT came close to breaking out yesterday after a historic 3.57% gap higher. In last year’s in-depth look at RUT [see: Feb 8, 2023 Update], we made the case for a drop to 1629 in May.
If, as I suspect, it fails in the next week or so, 1536-1554 is still in the cards. This was the original most logical target all along. The middle ground would be to continue bumping along until the rising white channel midline arrives at 1629 around May.
 As it neared our 1629 target in April, RUT attempted one more comeback before plunging to 1633 in October.
 It rallied sharply into the end of the year, as did everything else, finally reaching our next upside target — its .618 Fib — in March. Until yesterday, it had been rangebound – making lower highs and higher lows.
We’ll take a closer look at this latest move and its implications.
continued for members…
RUT’s reversal at its .618 in April set up either a Gartley or Bat pattern, meaning a move to its .786 at 2282.27 or its .886 at 2364.78. If we extend the dashed red trend line to the right, we get an intersection with the .786 at the end of the year – a very common scenario.
 This is consistent with our forecast of the past 7 months that stocks would rally into at least the November election. It also bodes well for markets in general, as it takes some of the pressure off the Mag 7 to deliver outsized gains to the SPX.
Note that while the .786 in December is a logical next target, an equally compelling case can be made for the .886 in September or October.
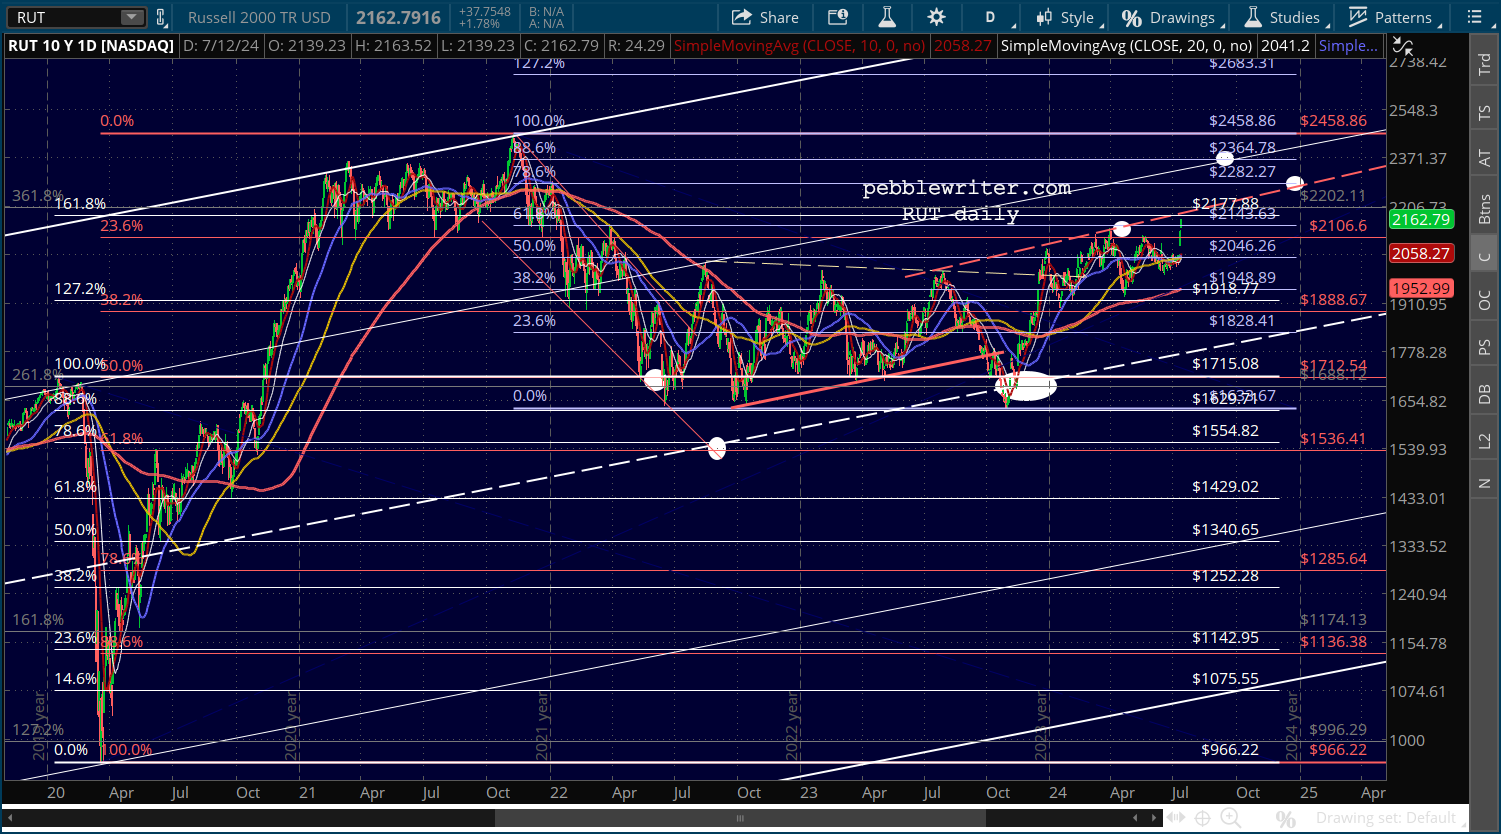 It would mean, however, that RUT would need to rise above the red, dashed TL from the Aug 2023 highs which has terminated 4 previous rallies.
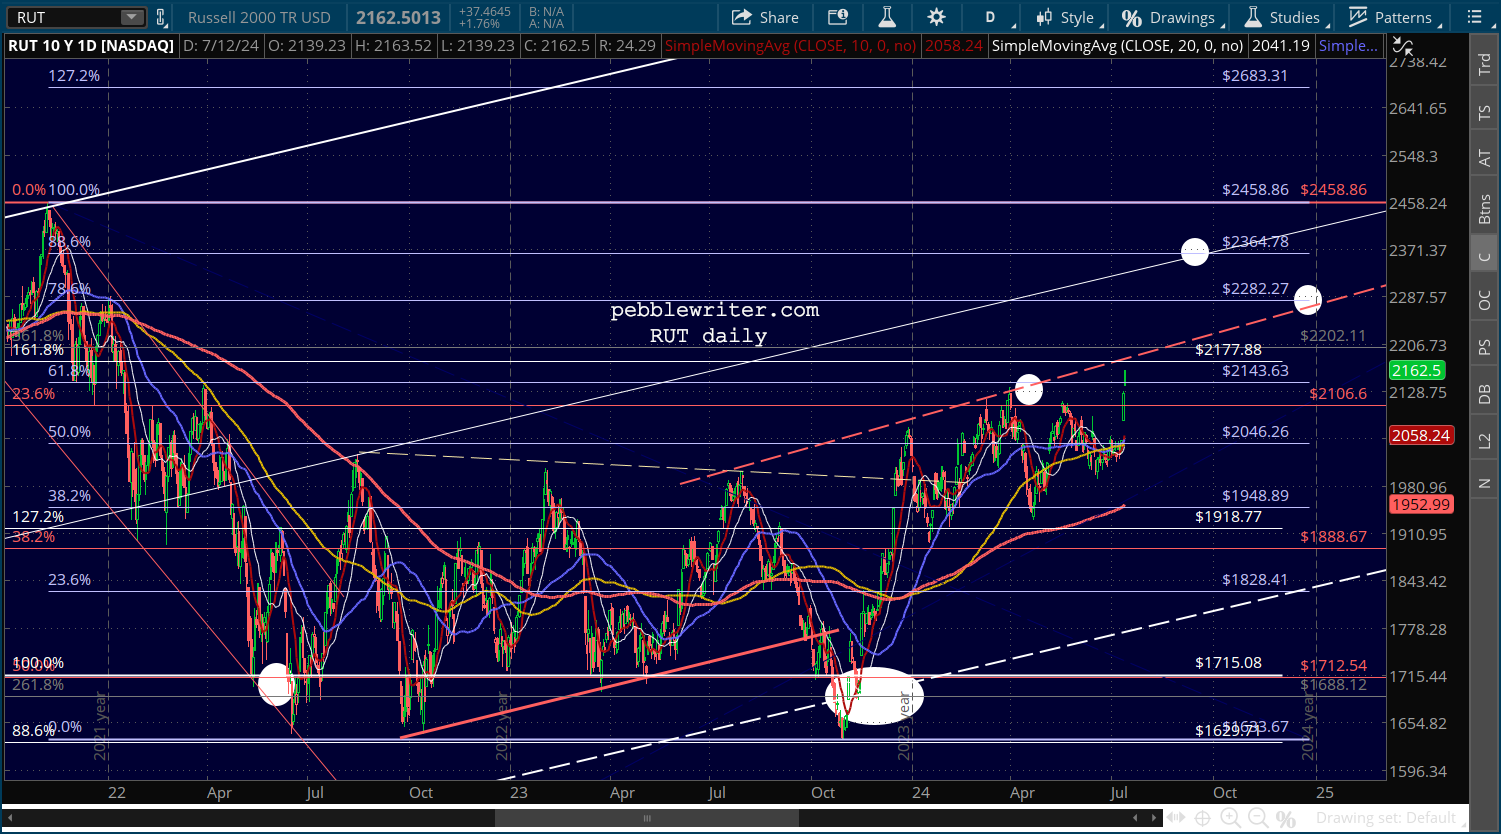 Both scenarios also set up a conflict with SPX, which has reacted at a significant Fib level.
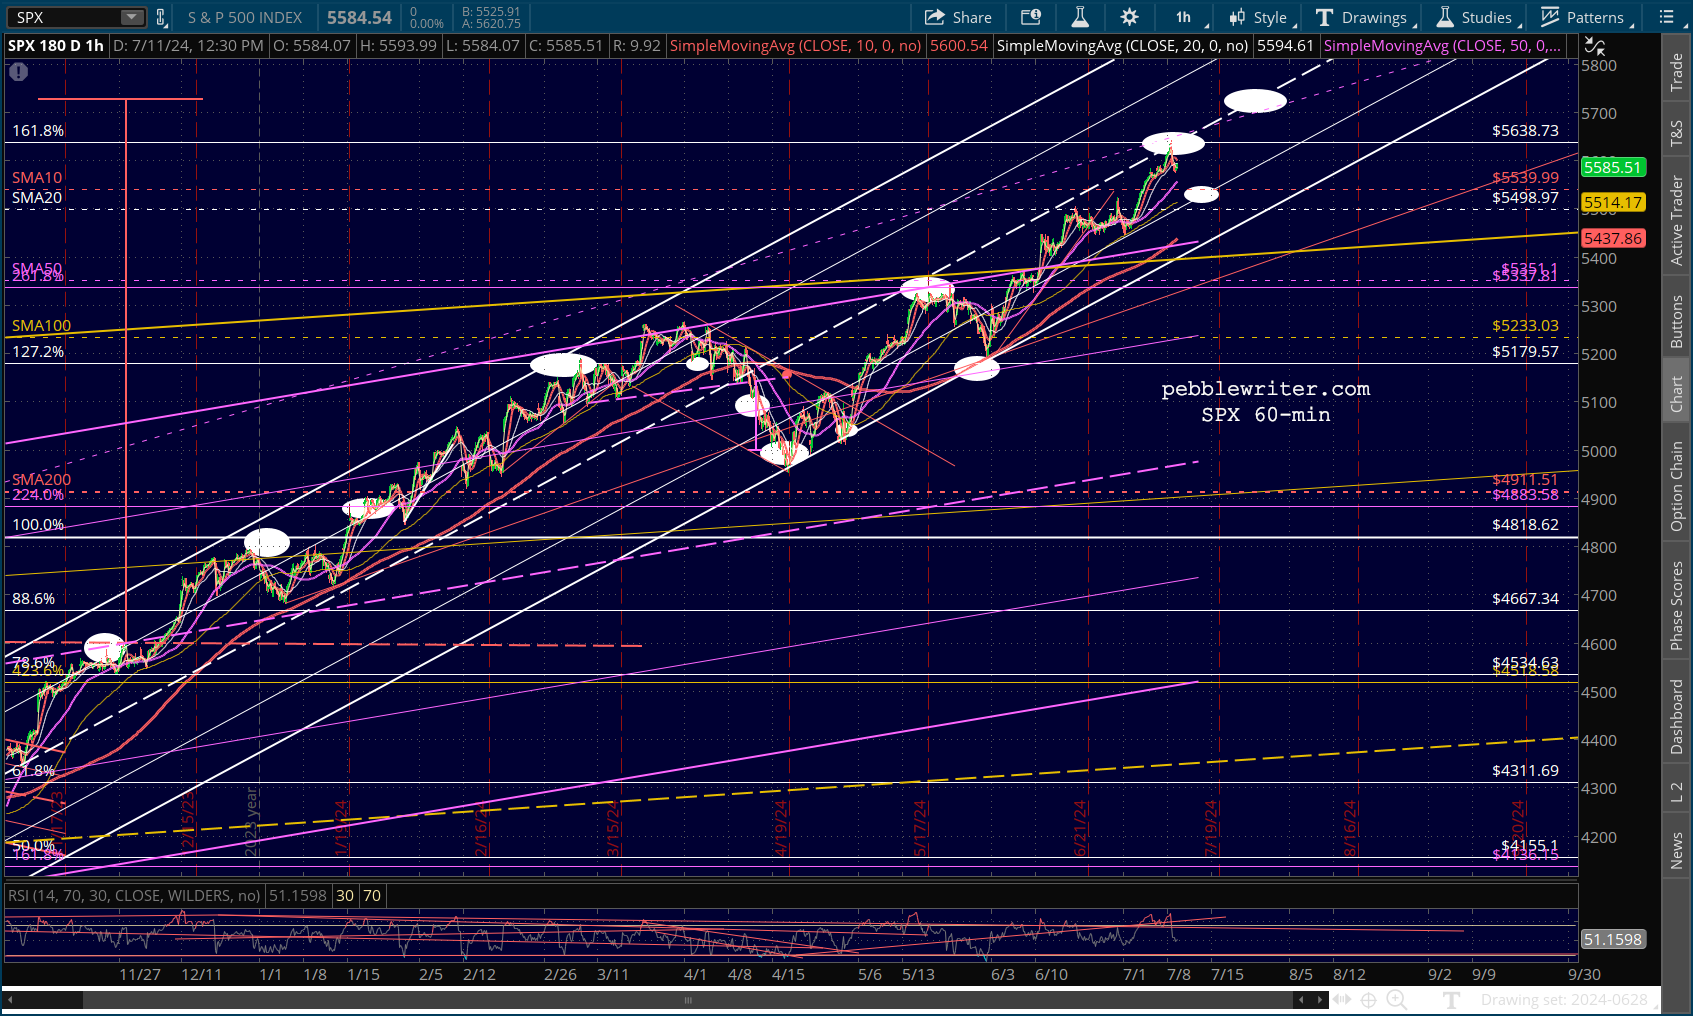 It’s a problem not shared with ES, whose 1.618 extension is way up at 5967, right next to the IH&S target at 5934. In general, ES pays more attention to important Fib levels than does SPX. But, it points out the importance to stocks in general of some of the algo factors swinging into action.
For instance, note that EURUSD is having a terrific day, threatening new highs… …as DXY breaks down.
 If USDJPY can hold its SMA50 at the same time, this would be very supportive of stocks.
 Obviously, VIX dropping below recent lows of 11.52 would also make a huge difference. This is the ace in the hole that algos have counted on for the past two months. And, no one would argue that a sub-11 VIX would be justified with a FOMC rate cut coming as soon as Jul 31 but certainly by September.
 The threat to all this exuberance remains oil and gas prices. They remain very close to breaking out. And, if OPEC+ decides – which would surprise no one – to support Trump over Biden (or whoever), then a breakout would really threaten the 2.5% CPI scenario.

As we saw in yesterday’s Gas v CPI chart, if prices were to remain level for the next four months the drop in the YoY price change for gas would run out of steam around election day. This means that CPI would likely bottom out in October (reported in November.)
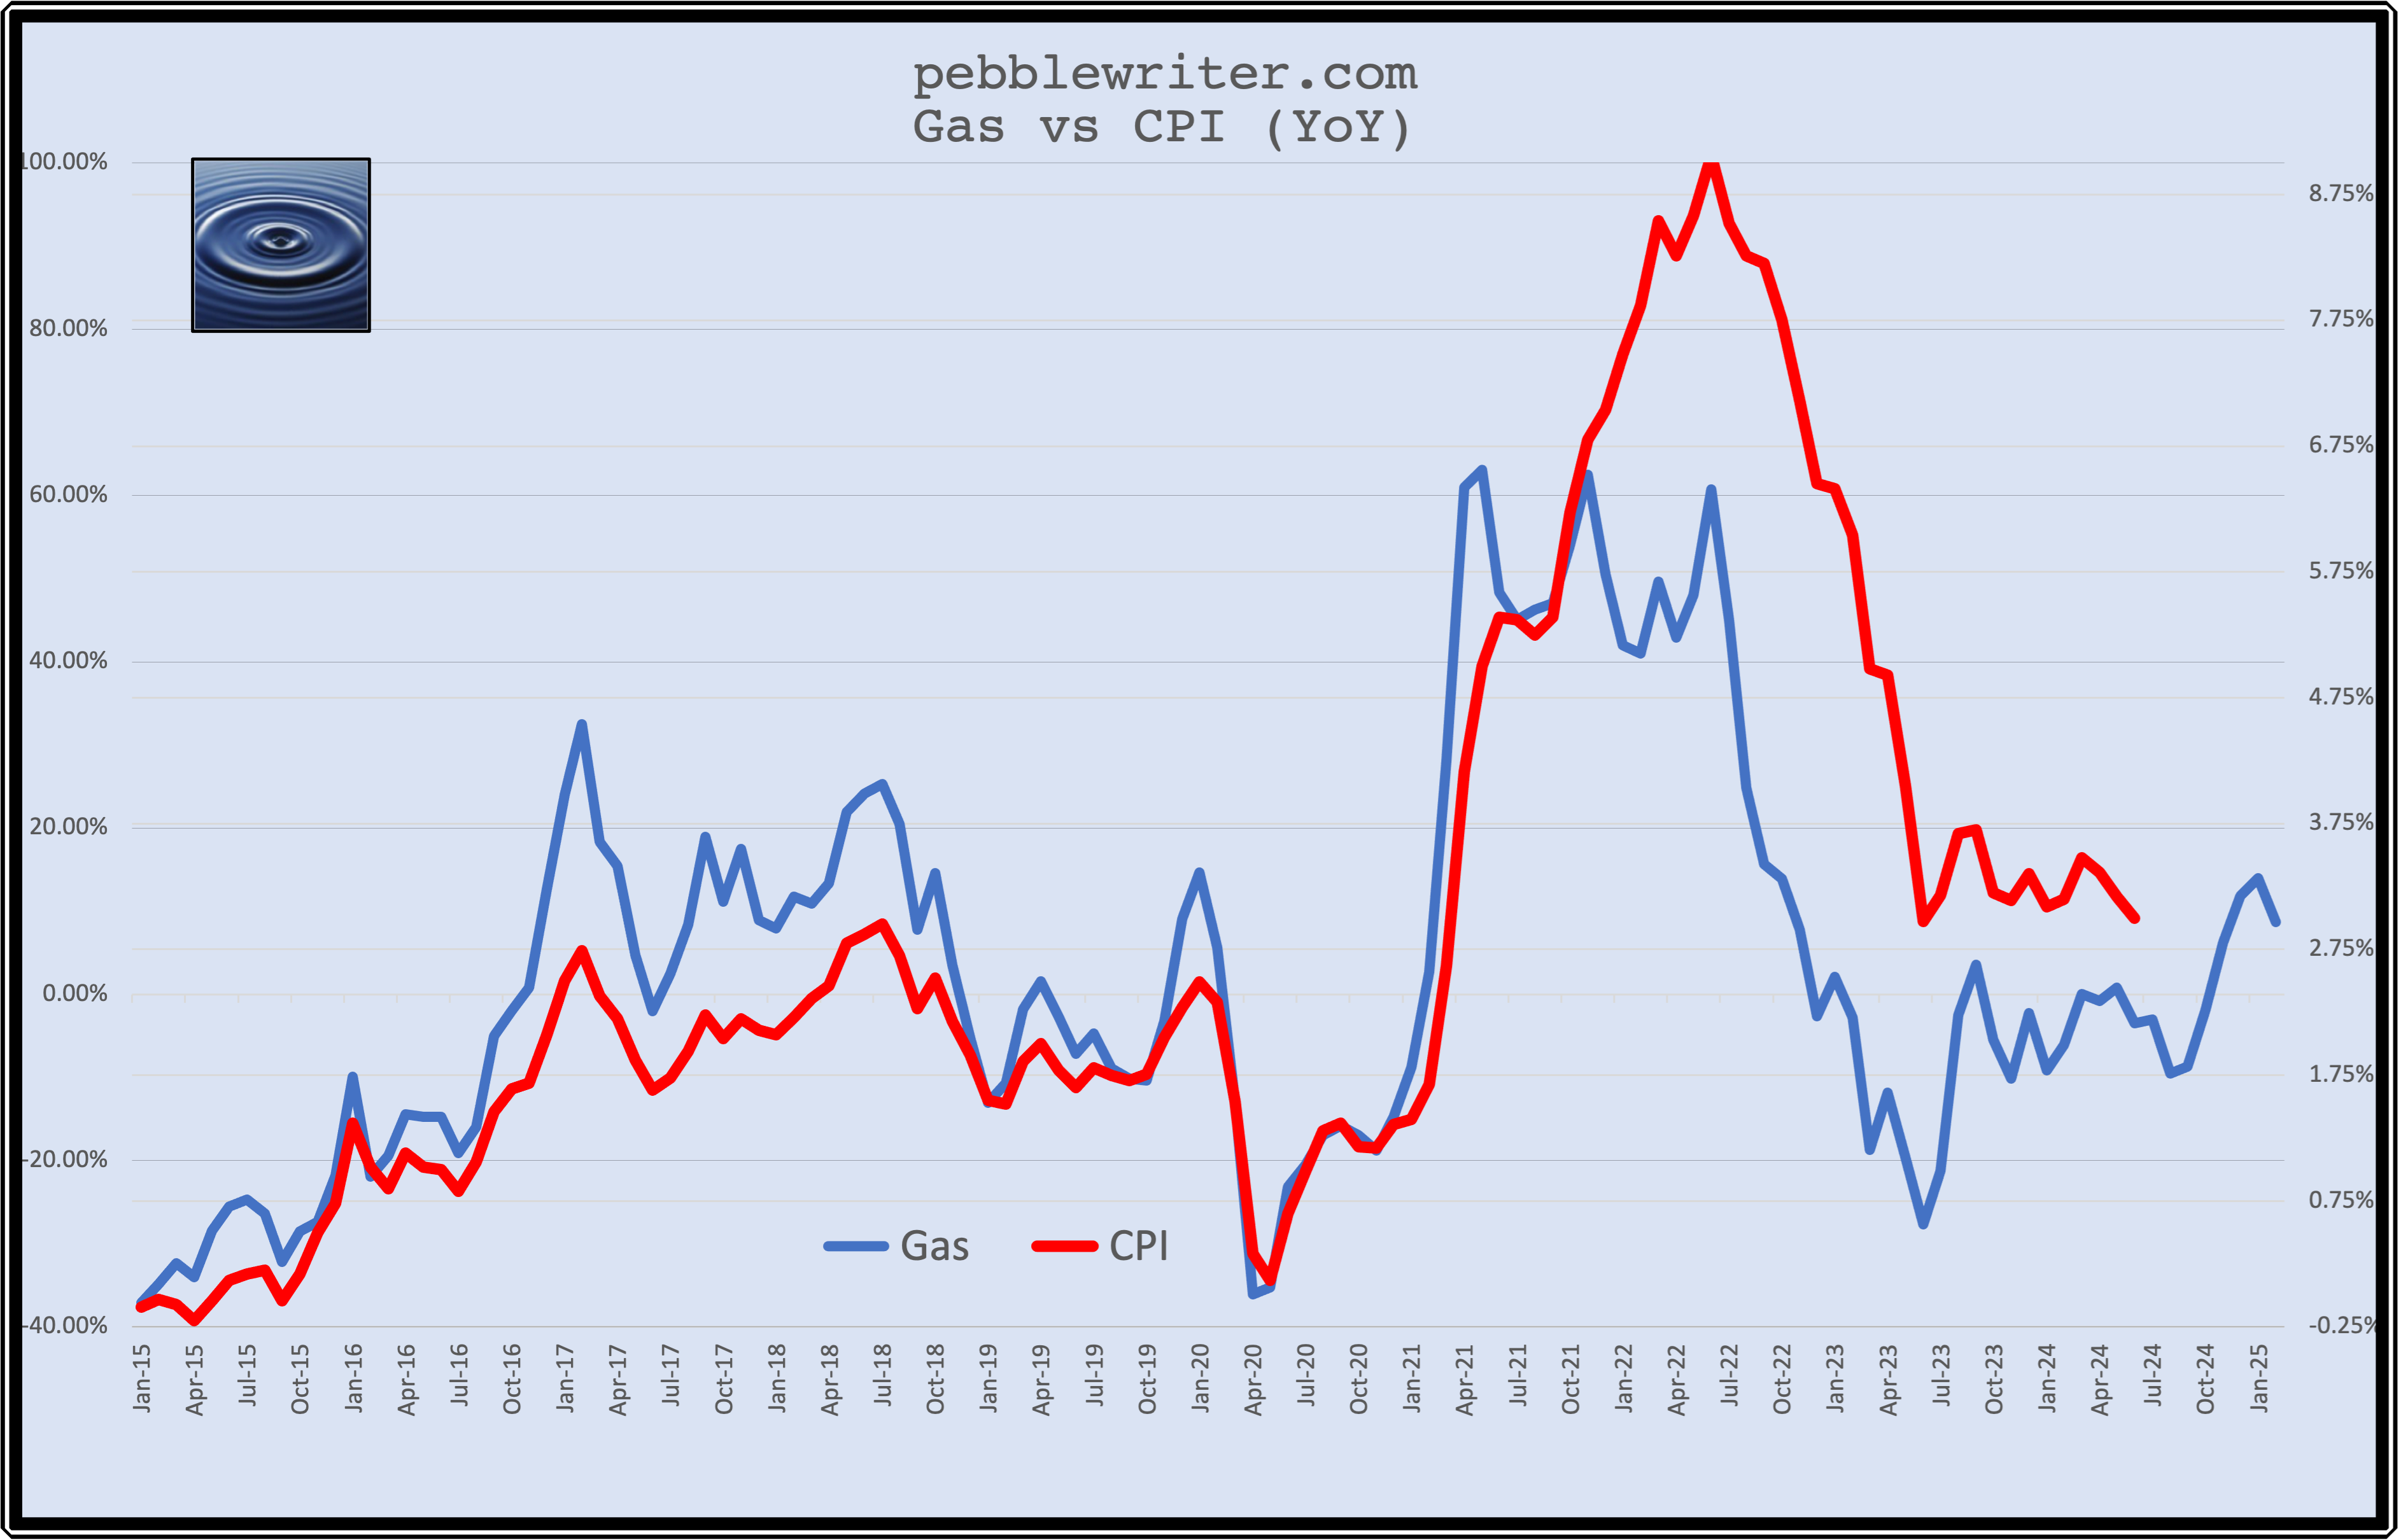 Only a continuing significant drop in oil/gas prices (or sharp drop in other key CPI components) would prevent a rise in CPI at that point.
Would OPEC+ do such a thing? It’s hard to say. While they have a better friend in Trump, he’s also arguably a very loose cannon. Russia is obviously working very hard to get him reelected, but the Saudis might be content to continue with the somewhat less generous but much more predictable Biden administration. We’ll see.
The other threat to the equity market is the bond market. As inflation drops, the 10Y has dropped. If it breaks down to or below 4%…
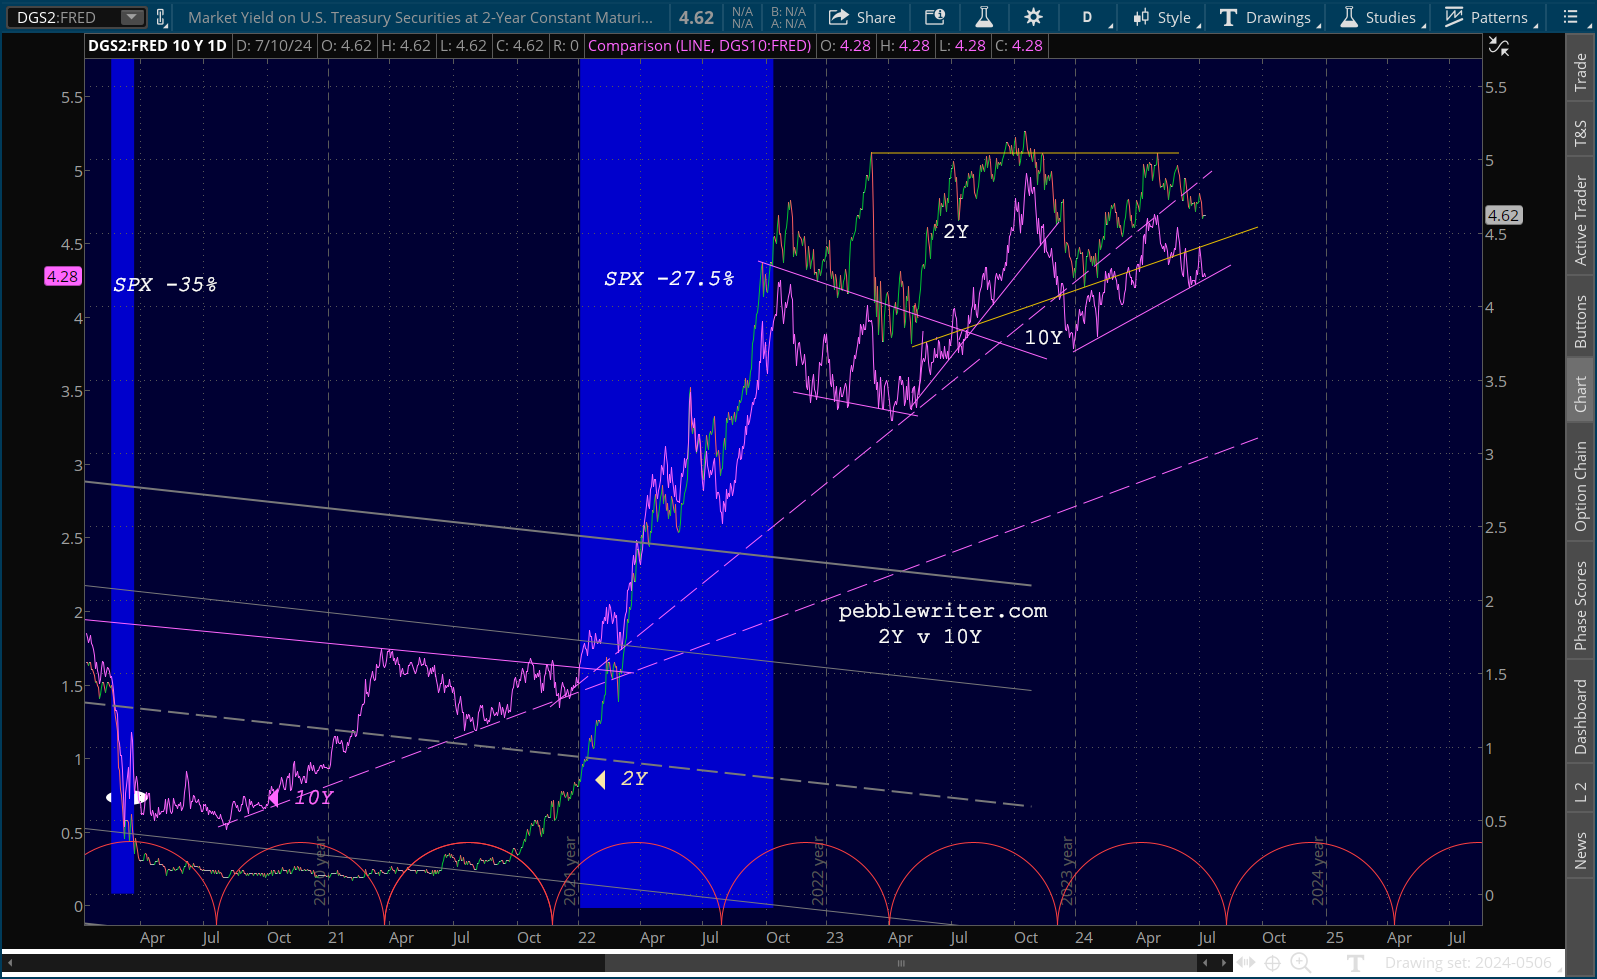
…it could cause the 2s10s to break out. It’s been threatening to do so for the past two weeks. Remember, a breakout – meaning a sharp rise in the differential between the 2Y and 10Y – would be disastrous for stocks.
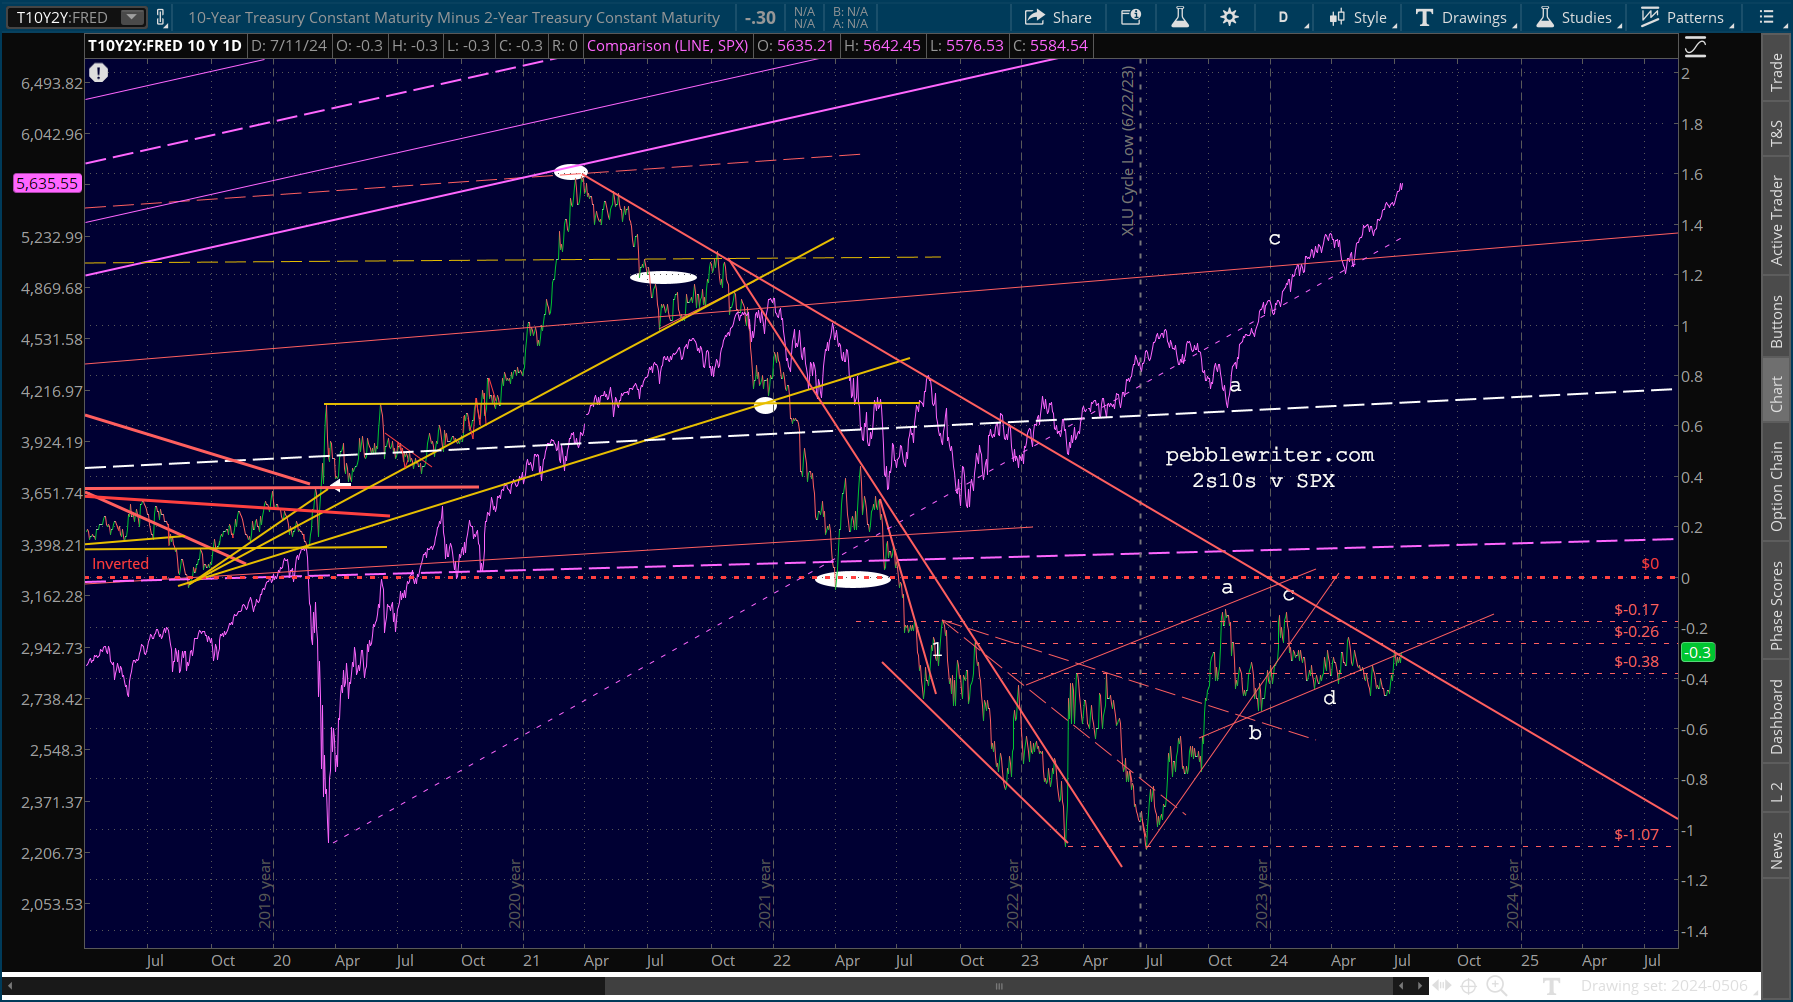 Preventing such a rise would mean a drop in the 10Y that is faster than that in the 2Y. How do you accomplish that? There are many ways, but conducting all your borrowing at the short end of the curve instead of the long end would suffice. Meanwhile, bond investors would be clamoring for those longer term bonds paying 4% – thus maintaining the inversion just a little longer. It only needs to last through November 5.
 Stay tuned…