

One of the more laughable charts since the election has been the Nikkei 225 (NKD), which has soared 2,600 points in the face of: (1) the election of a protectionist US president, (2) higher oil prices, and (3) higher interest rates. Yesterday, it reached our next upside target of 18,631, which puts it roughly 25% higher since our Feb 9 bottom call [see: Update on NKD: Feb 9.]

When the Fukushima Daiichi disaster resulted in Japan’s nuclear power plants being shut down five years ago, oil and gas imports became even more critical to Japan’s energy needs. Energy costs spiked higher, impacting consumers and businesses alike.
What wasn’t spiking higher was the Nikkei. The correction in the summer of 2011 was turning into a rout. Were it not for the yen carry trade [click for an explanation] and the floor the BoJ put under the USDJPY, we might well have seen the next leg down of the 2007-2009 crash.
Instead, the Bank of Japan — in coordination with the FOMC — crashed the yen. It saved stocks. But, as the yen plunged from 75 to 105 (per USD), Japan had a different kind of problem on its hands. Rising oil prices (priced in USD) were being exacerbated by the yen’s plunging purchasing power.
The BoJ, which had used the threat of deflation as the rationale for unprecedented quantitative easing, found itself with increasingly noticeable and rather inconvenient inflation.
The only solution was to crash oil prices. Other central banks, which were similarly committed to higher equity prices and, by now, understood the importance of the yen carry trade, were eager to join in.
This began a symbiotic relationship between USDJPY, CL and NKD that continues to this day.
- The day that USDJPY broke out of a lengthy consolidation in Aug 2014 was also the day that CL broke down.
- When USDJPY broke down on Feb 11, 2016, oil bottomed and began a rally that would see it double by October.
- USDJPY’s bottom on Jun 24 closely followed CL’s Jun 9 top.
The Feb 2016 role reversal was one that caught a lot of investors off guard. I covered it extensively at the time [see: USDJPY Finally Relents.] The entire oil complex, the banks which financed it and the countries which were supported by it were on the ropes. The cheap yen was increasingly a problem. It was time to put a floor under oil and crash the USDJPY.
By Jun 24, USDJPY had shed 20% and CL had gained 96%. Algos loved (ok, were programmed to love) resurgent oil prices just as much, if not more, than they did the crashing yen. And, of course, the steadily falling USDJPY (appreciating yen) made higher oil prices tolerable for Japan.

By now, you might be wondering what all of this has to do with…well, anything. It’s very simple.
We called a top for oil on Oct 11 [see: Welcome to Peak Oil.] We were rewarded with a 19% drop that has since rebounded by (a Fibonacci) 88.6%. Yesterday, OPEC struck a deal which they insist will drive prices to new highs. Putting aside, for the moment, the considerable hair on the deal, there are some serious problems with higher oil prices.
For one, central banks don’t need higher inflation in the same way they need higher stock prices [see: Japan’s Equity Trap.] They might say they do, and in certain cases it might even be beneficial. But, higher inflation brings higher interest rates and the need to moderate ZIRP and NIRP. Remember last year when the FOMC raised rates just a little? Stocks didn’t like it one bit (NKD sold off 24% in under two months.)
With global debt having spiraled out of control over the past seven years, appreciably higher interest rates would put a serious dent in most countries’ ability to remain afloat. The US government, for instance, with $20 trillion in nominal debt (much more off the books) faces a $200 billion hit with every 1% across-the-board increase.
Where, exactly, is that money supposed to come from? Certainly, not courtesy of the lower tax rates Mr Trump has promised. And, I’m not laying the blame at Trump’s feet. The money is simply not there unless politicians take a huge carving knife to our current budget.

Japan, Europe, China…it’s just as bad, if not worse, everywhere else. Higher rates are simply not acceptable. Bernanke wasn’t joking when he said, in May 2014, that he didn’t expect interest rates to ‘normalize during [his] lifetime.” So, one would expect central banks to continue doing whatever is in their power to avoid them.
This, of course, brings us back to the oil “deal” and why, even in the face of a rip-your-face-off rally in oil, we remain short SPX with our downside targets unchanged.
continued for members…
Some of our eagle-eyed readers might have noticed the lighter, shaded areas in the USDJPY v CL chart above. These are the more prominent periods when both USDJPY and CL were tanking, i.e. oil and the USD both falling at the same time.
I’ve highlighted them because each of these periods corresponded with strong declines in equity prices. Now, hold that thought.
Let’s look at the relationship between oil prices — remember, the biggest potential driver of inflation if it doesn’t reverse right away — and interest rates (represented here by TNX, the 10-yr note yield.)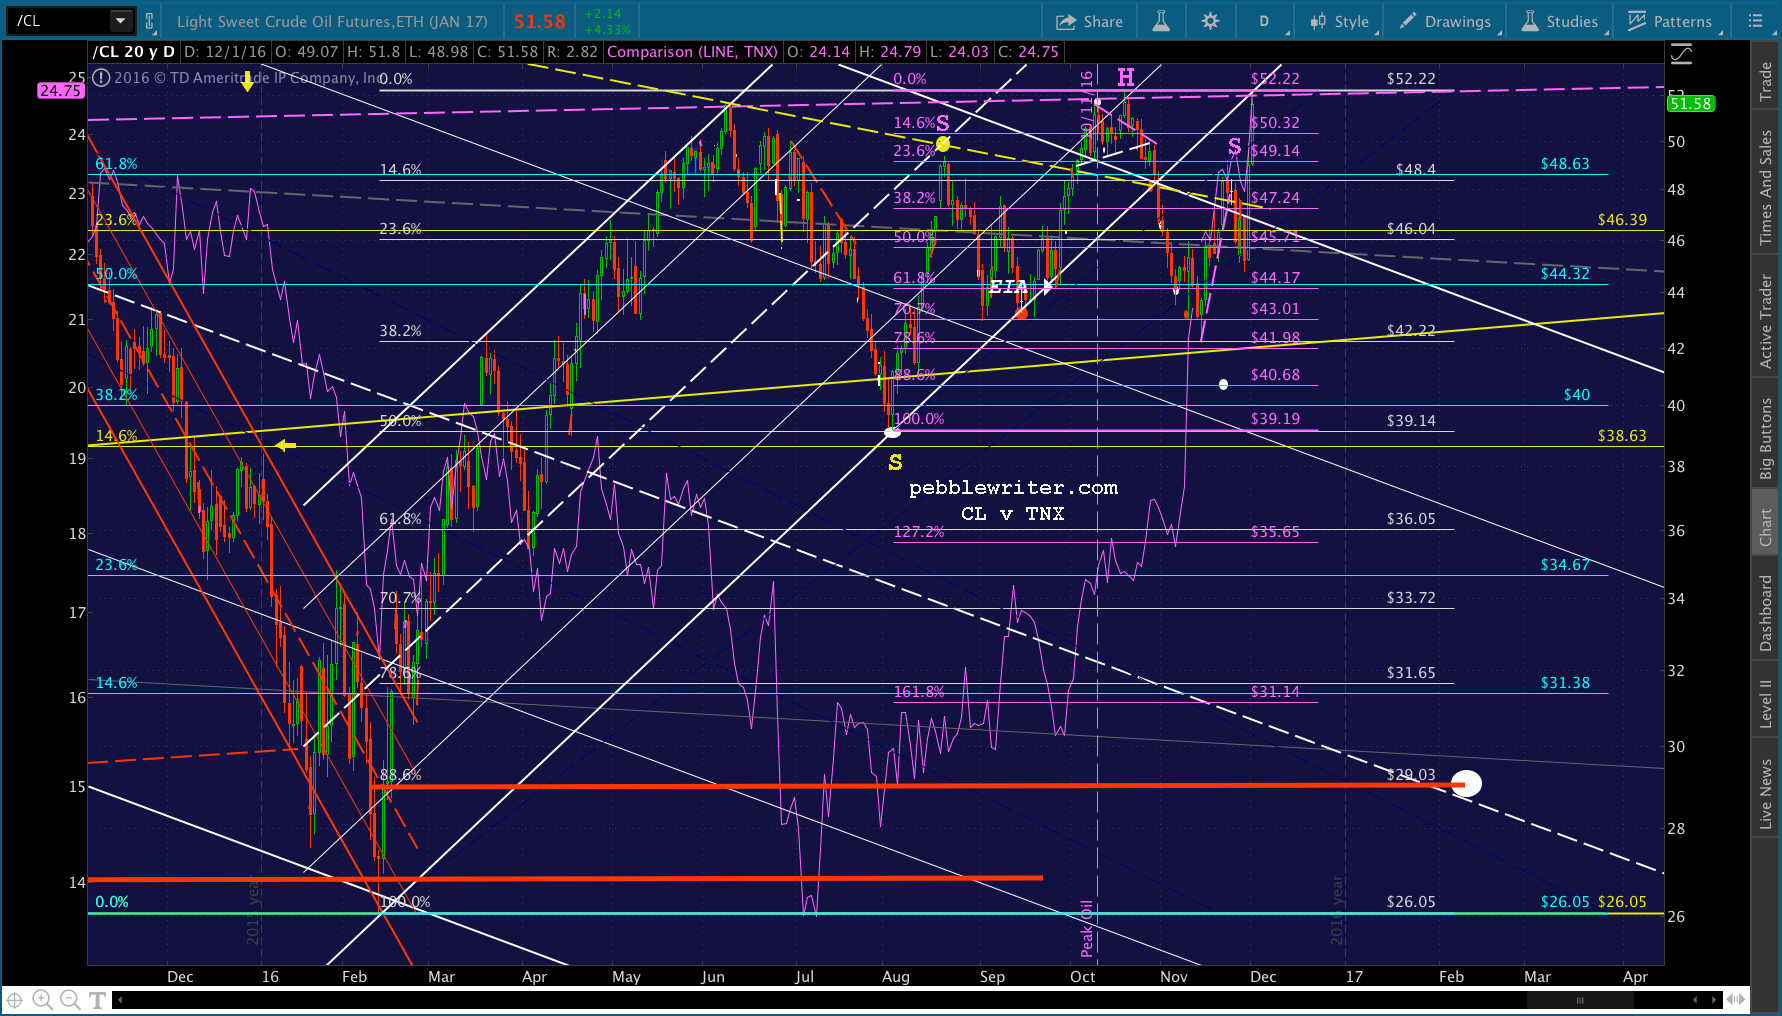 As CL is nudging up against the former highs, the purple neckline, and the rising channel from Feb 11, we are faced with a critical question: backtest or breakout?
The chart clearly shows interest rates would spike higher if CL did. And, we’ve already established that the FOMC can’t afford higher rates. Thus, the odds strongly favor a major reversal for oil — which, in turn, strongly suggests a decline for stocks. How big will it be?
The chart below shows a closeup of the relationship between USDJPY and SPX. Does anyone imagine that it’s a coincidence that the white .786 Fib is within a penny of the critical, yellow .618 Fib?
Trust me, that 5% rally from 114.42 to 120.11 won’t be enough to offset the disappointment that follows from the OPEC deal falling apart and CL dropping to 29. That’s why I have more confidence than ever in our analog continuing to work. 
In fact, it’s not hard for me to imagine the decline picking up steam and forcing the Fed to delay December’s rate hike. I’m not saying it’s likely. But, they could get away with saying rates have already adjusted enough on their own to justify delaying a hike until Feb 1. They could say the dollar is too strong and a headwind to growth. They could say stocks are overvalued. Whichever excuse they come up with, market turmoil has always been the “go to” excuse for delaying rate hikes.
Just saying…
UPDATE: 9:57 AM
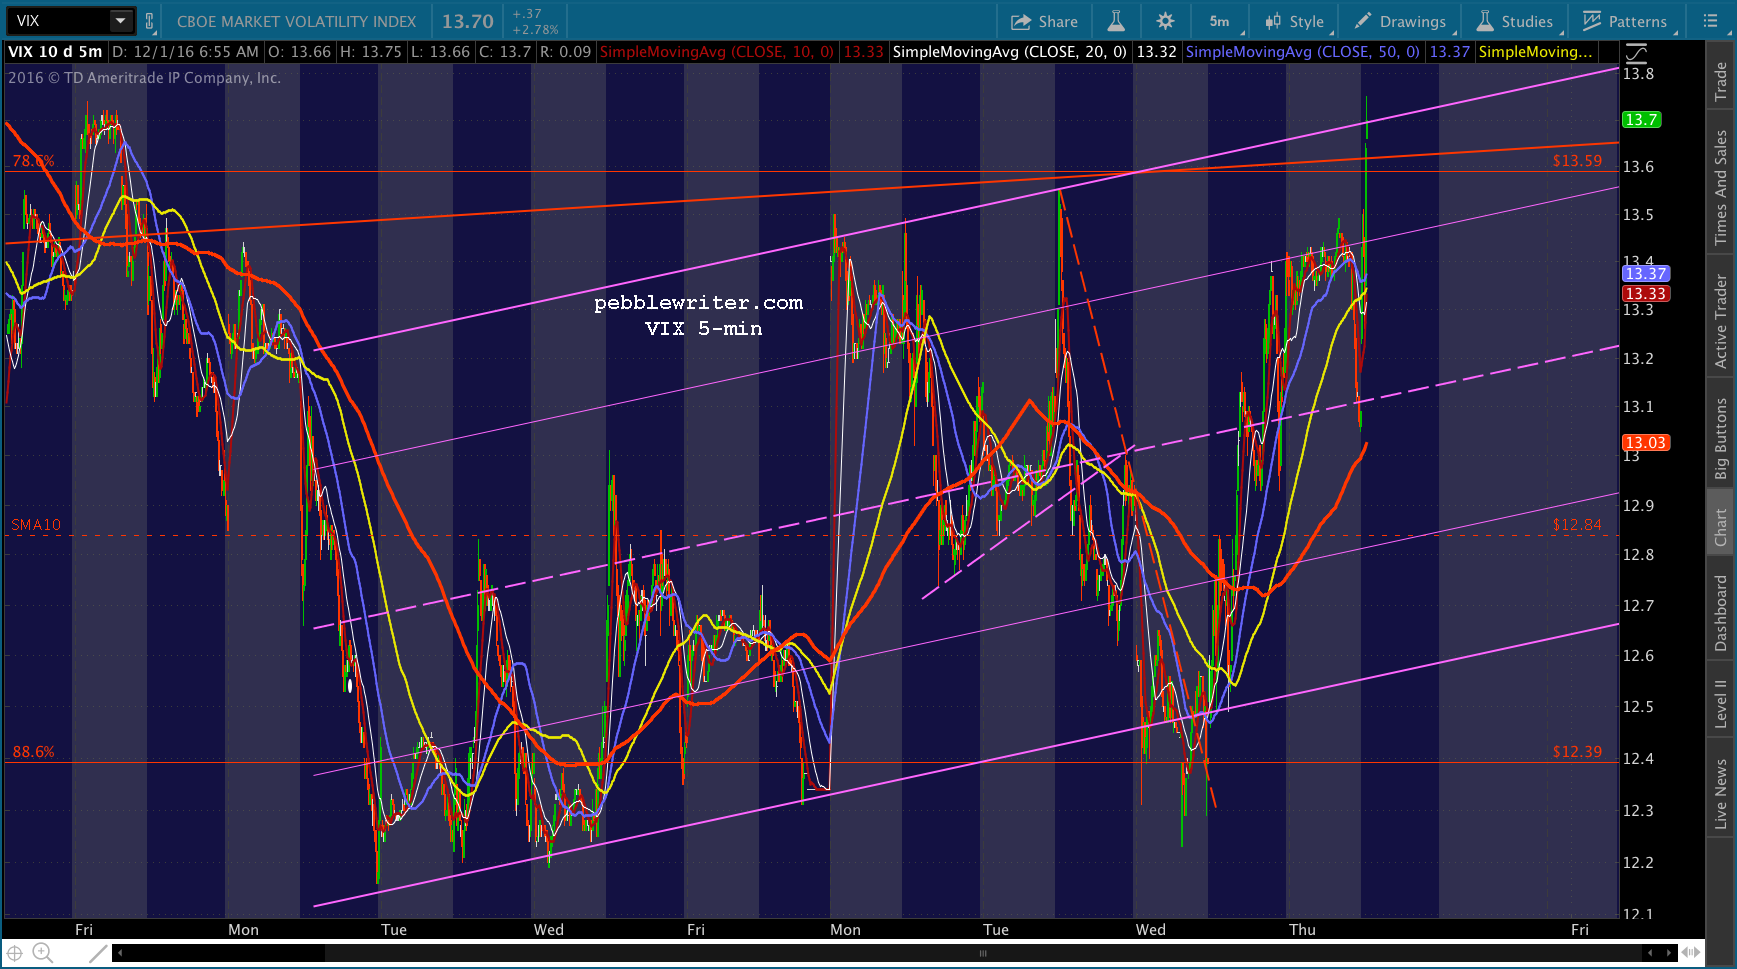
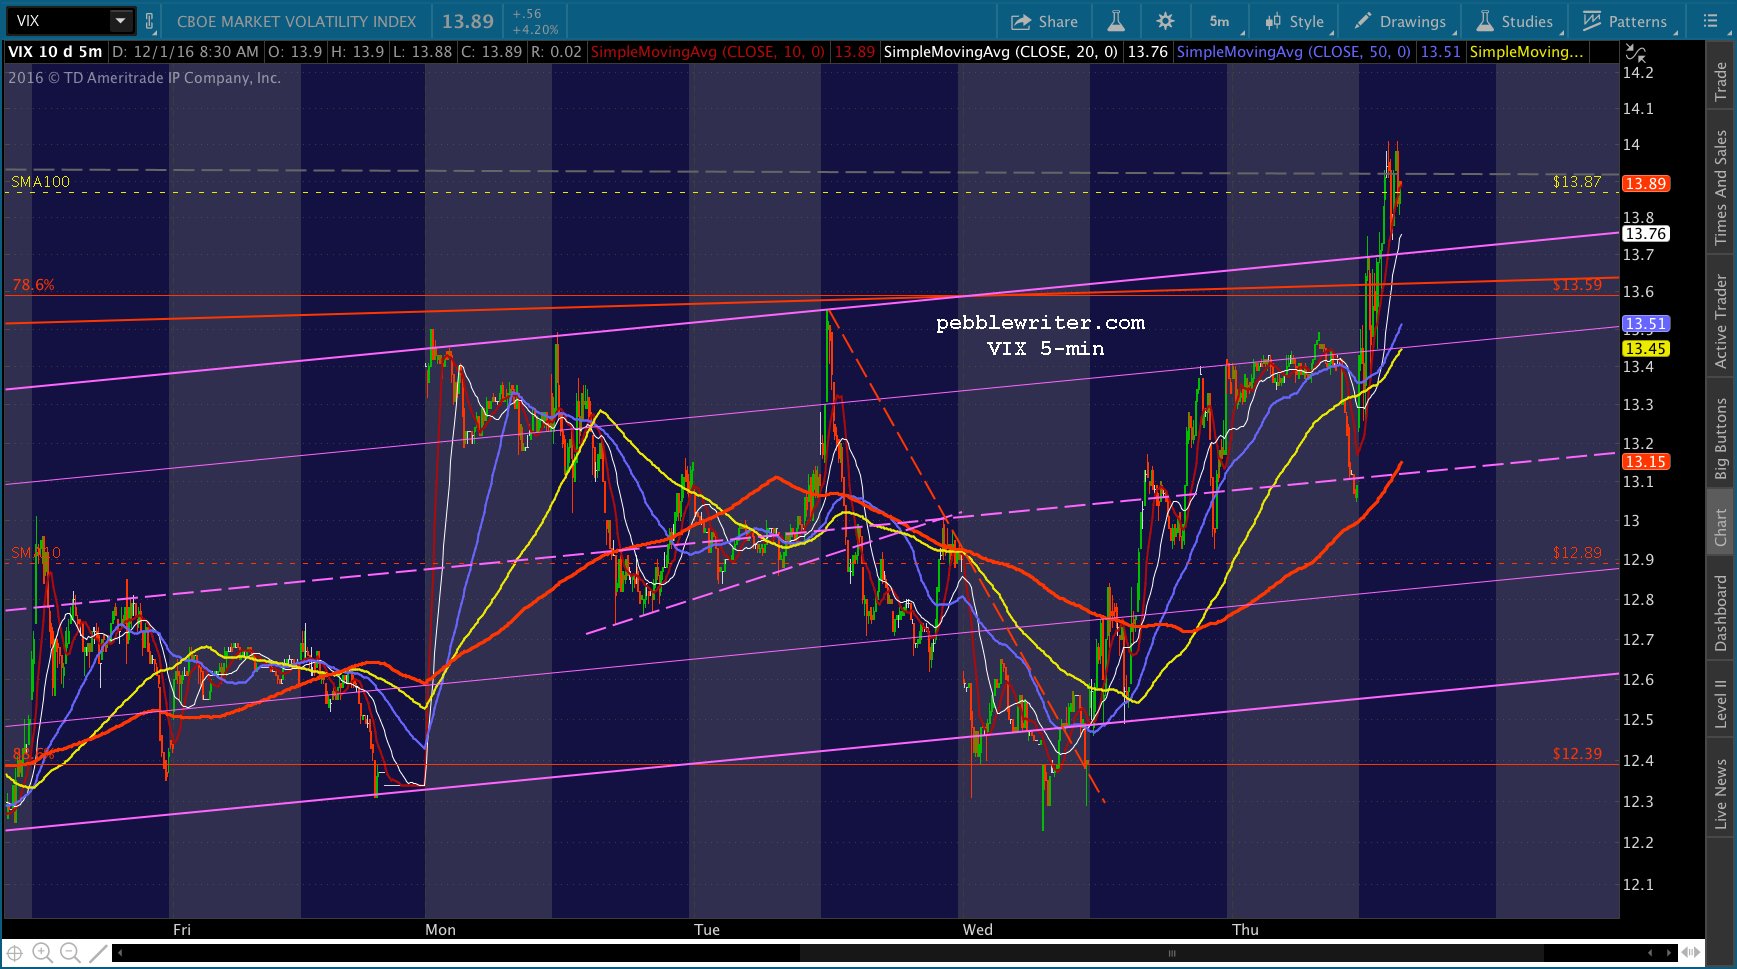
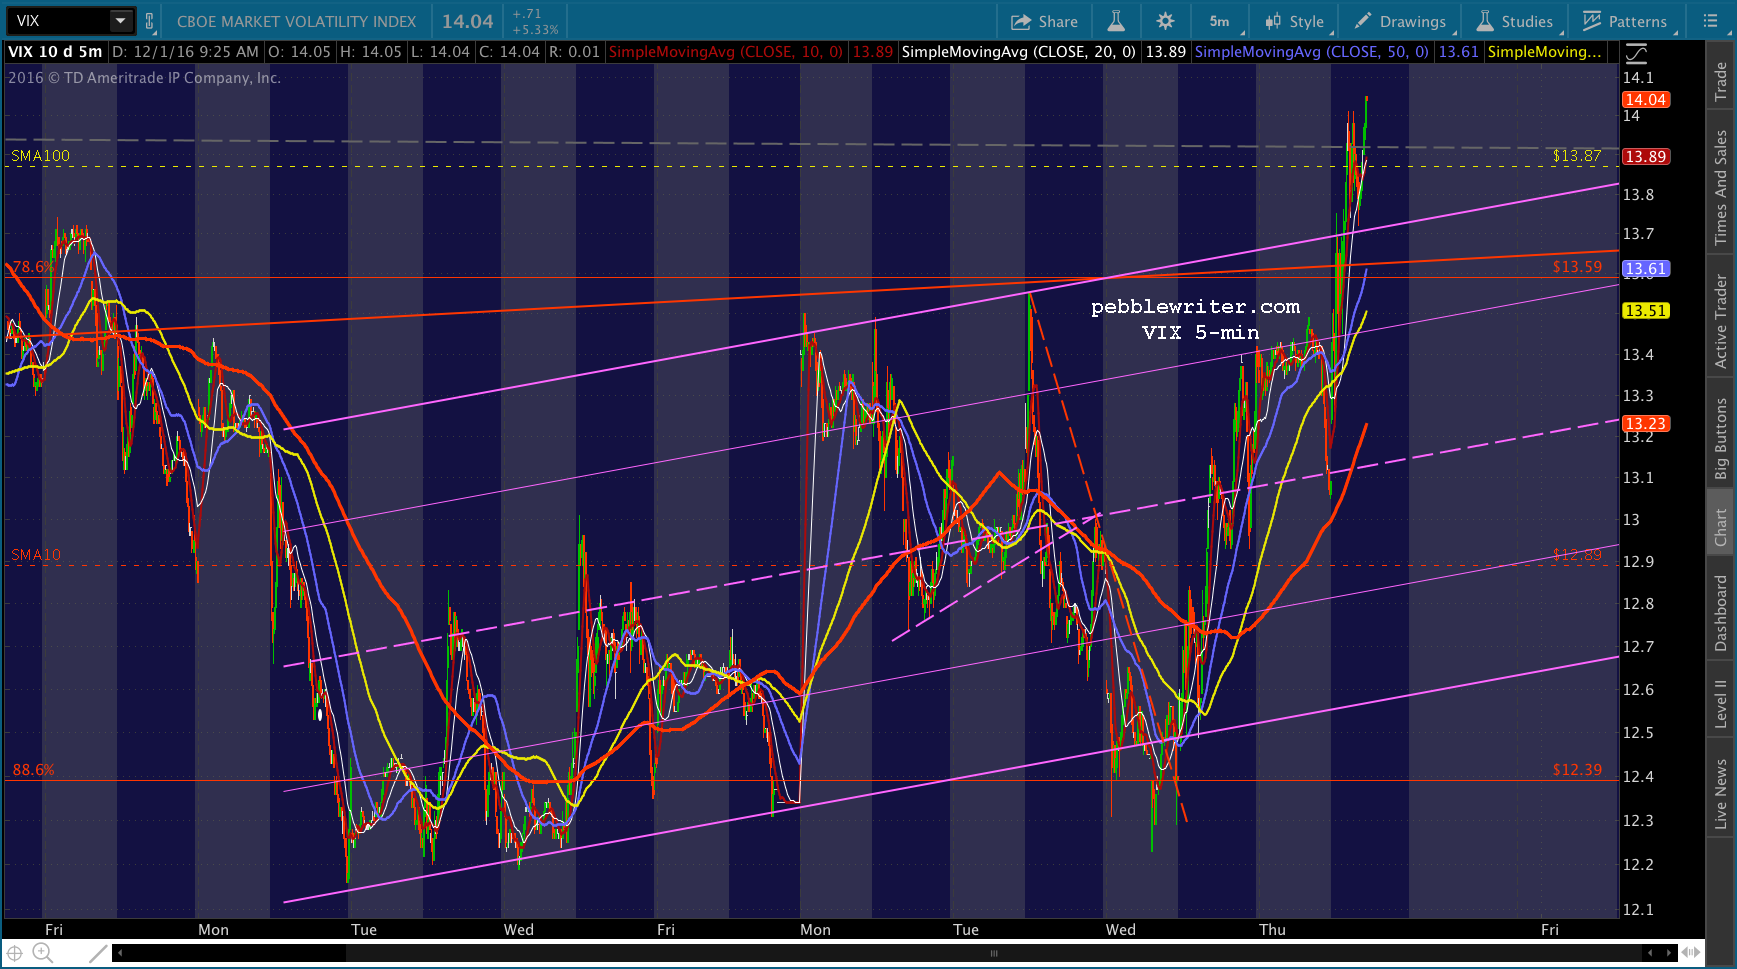
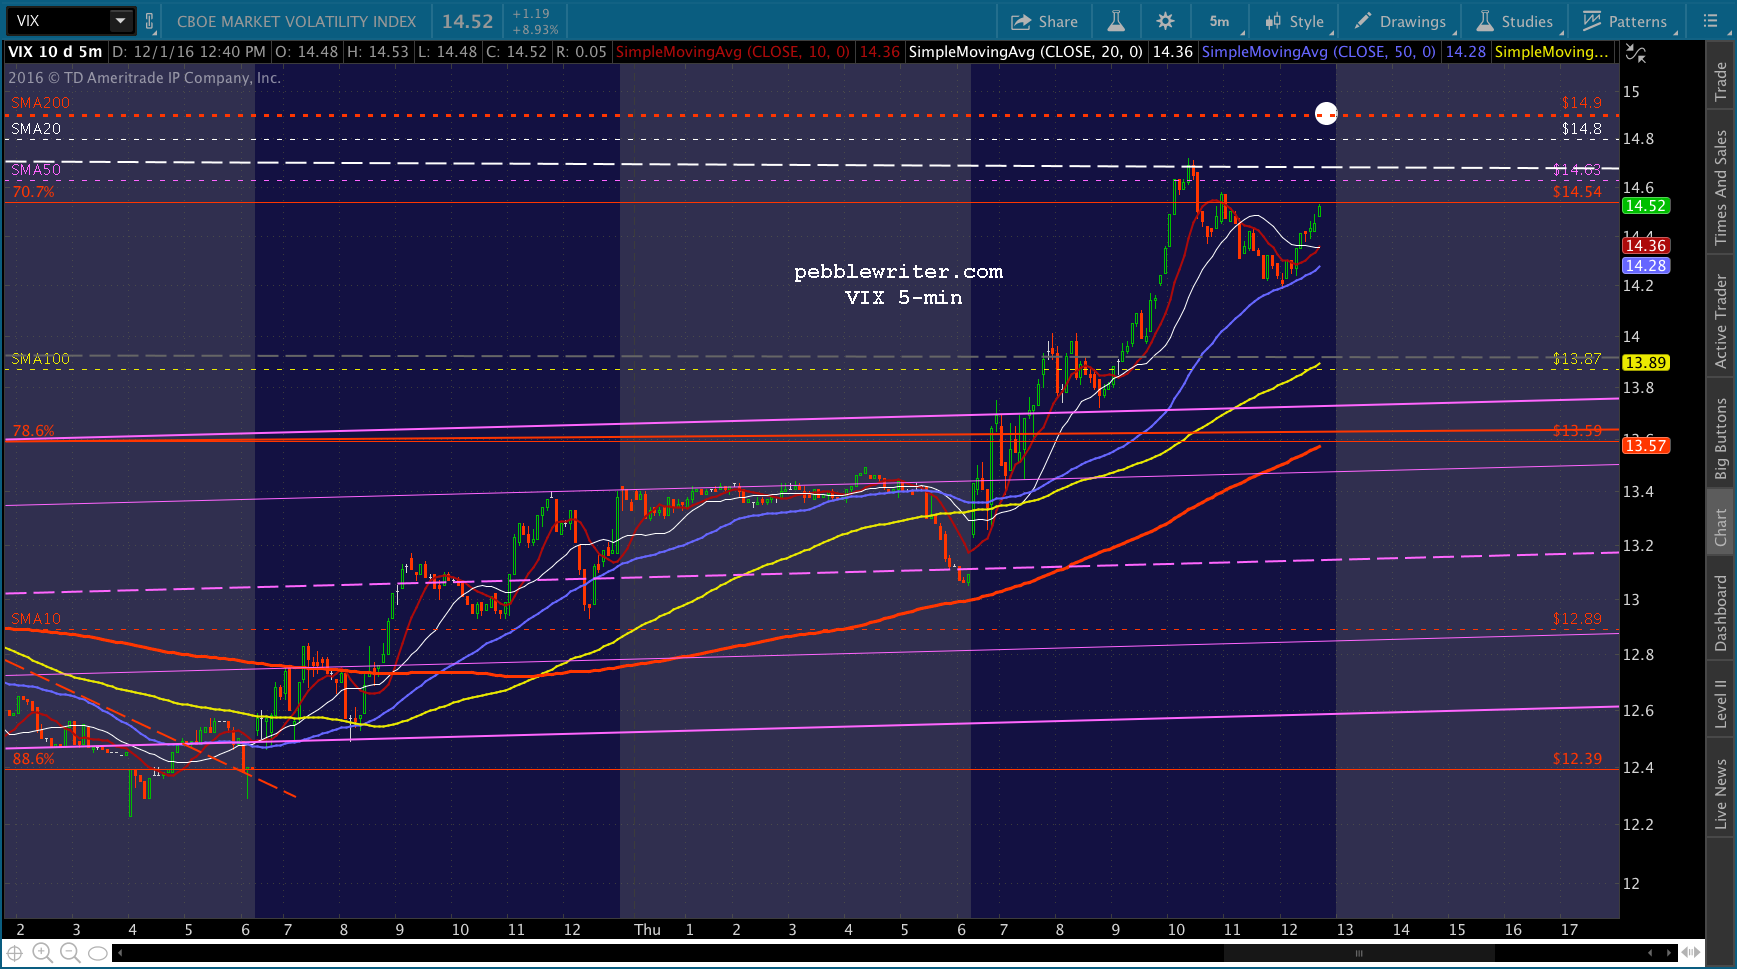
SPX just reached our next downside target at the SMA10 as VIX backtested the bottom of the rising red channel. I’d cover our short from yesterday here at 2196.66 as a precautionary move. The bounce could be anywhere from 3-10 points, but I’d be prepared to short again as it drops through.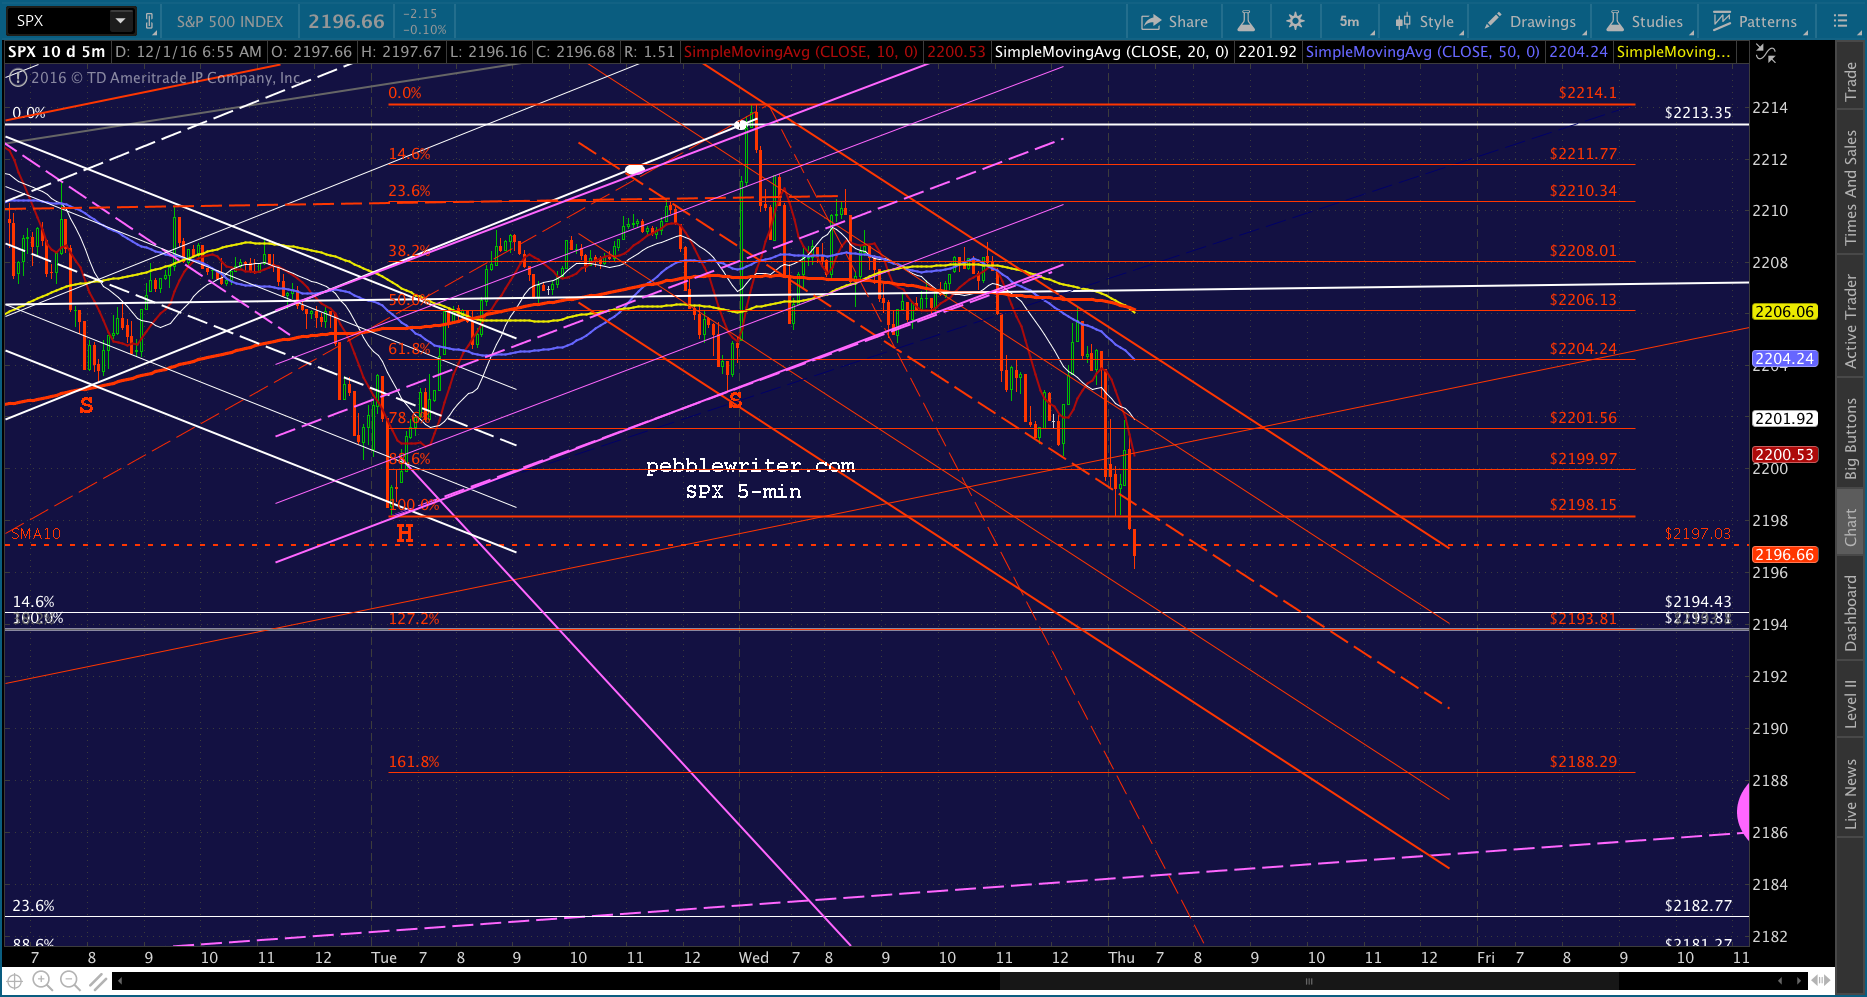
UPDATE: 10:34 AM
That didn’t take long. Back to short at 2197.64.
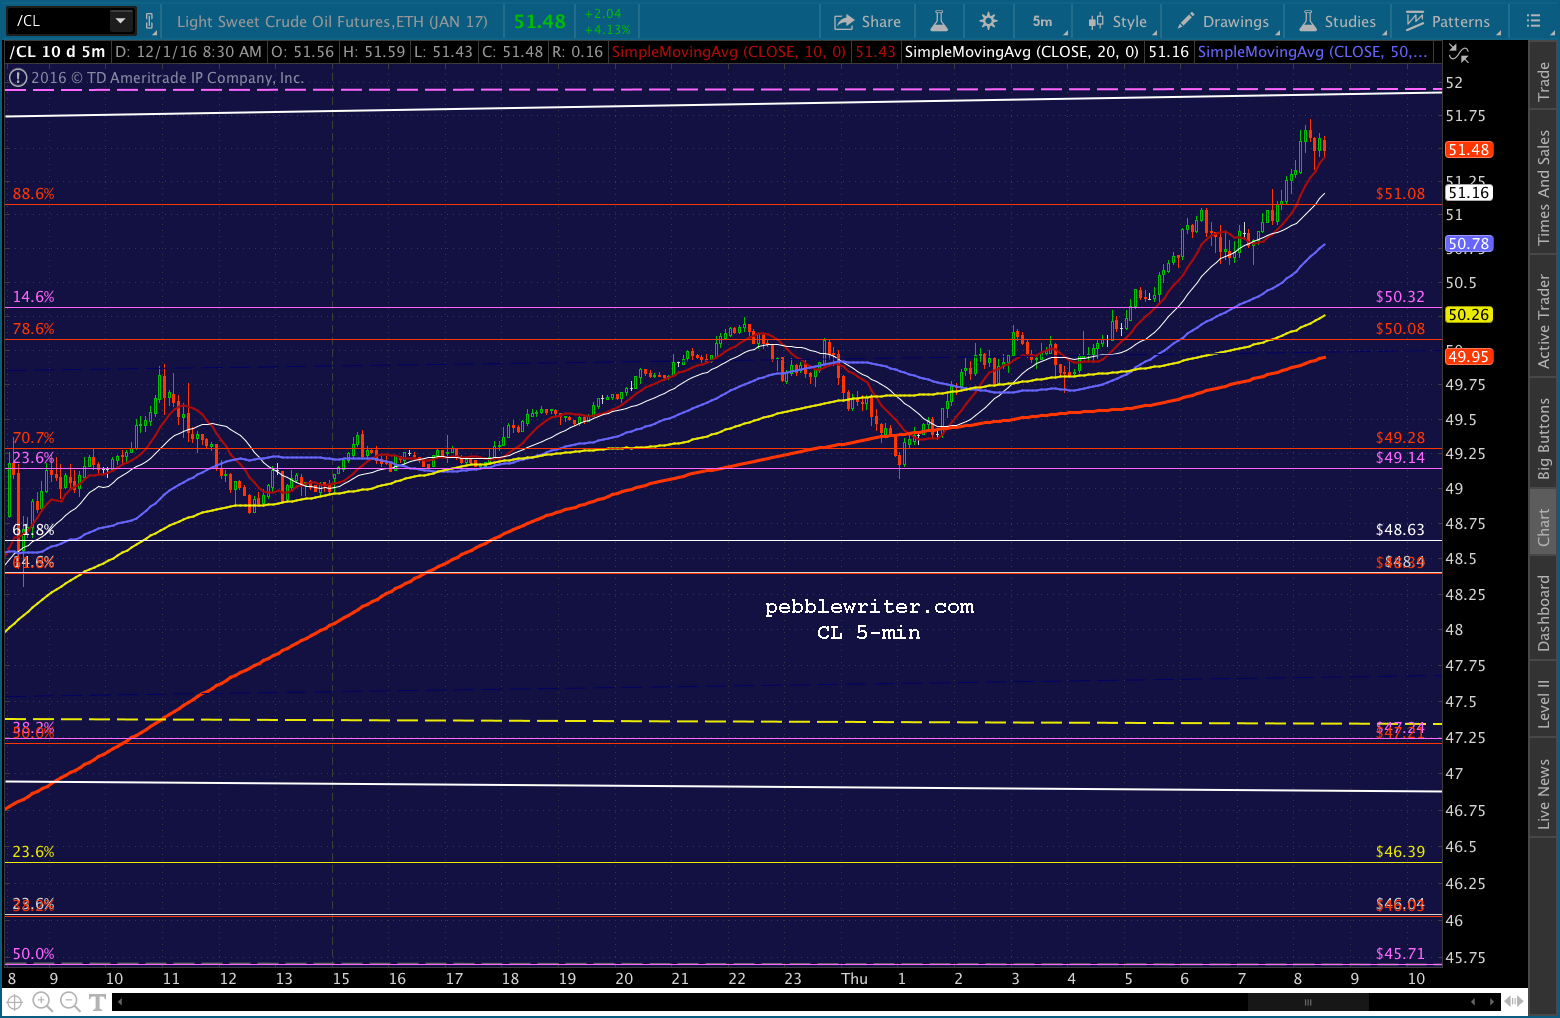
I might have spoken too soon, as CL just popped up above the .886 Fib that chartists expected to mark its reversal point. Watch your stops if this trend continues.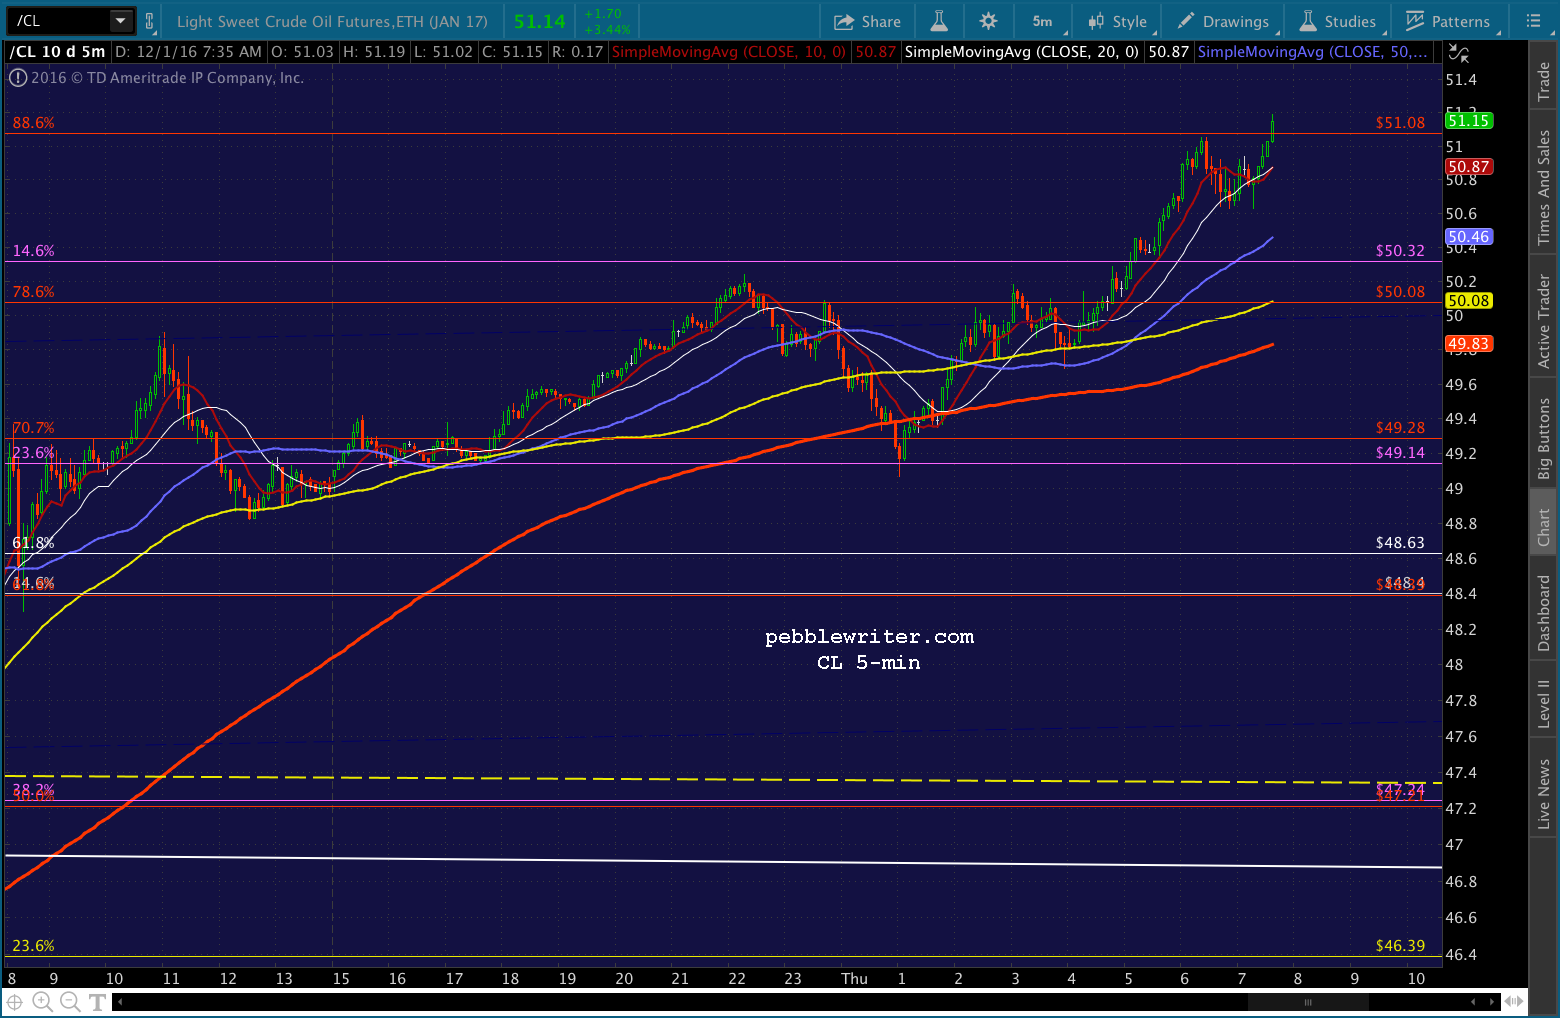
UPDATE: 10:57 AM
Another potential bounce spot: the Aug 15, 2016 highs and a 1.272 extension.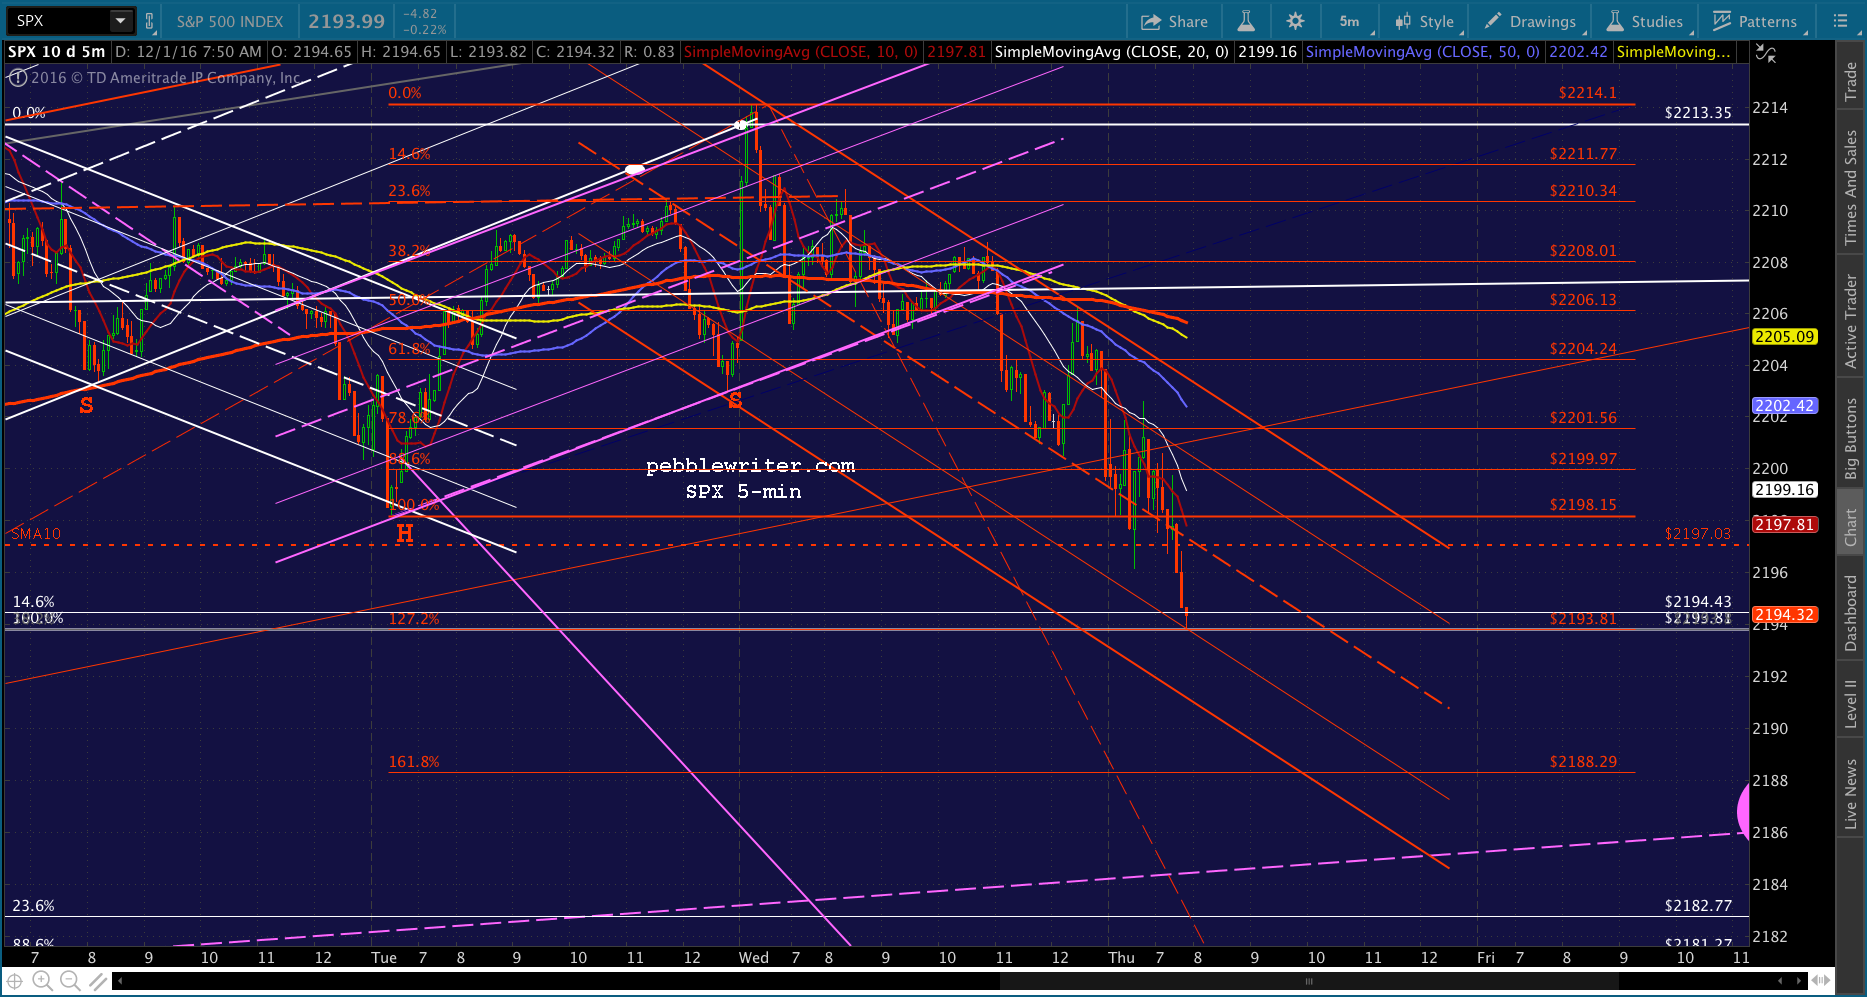
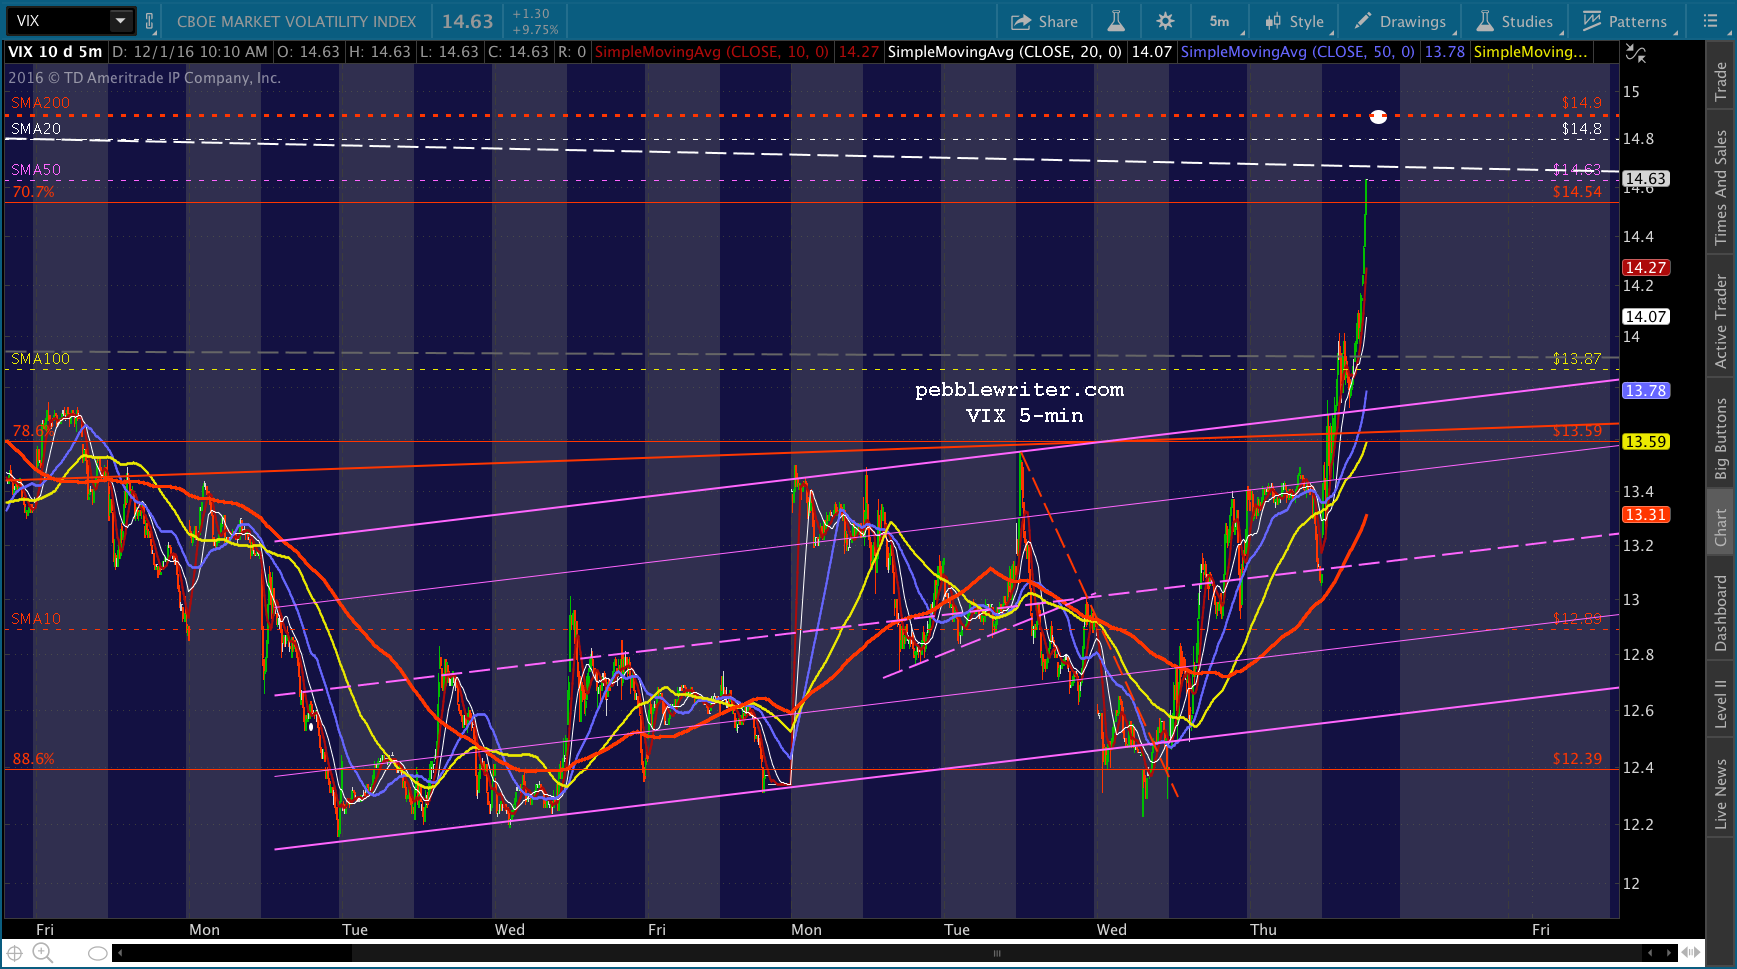
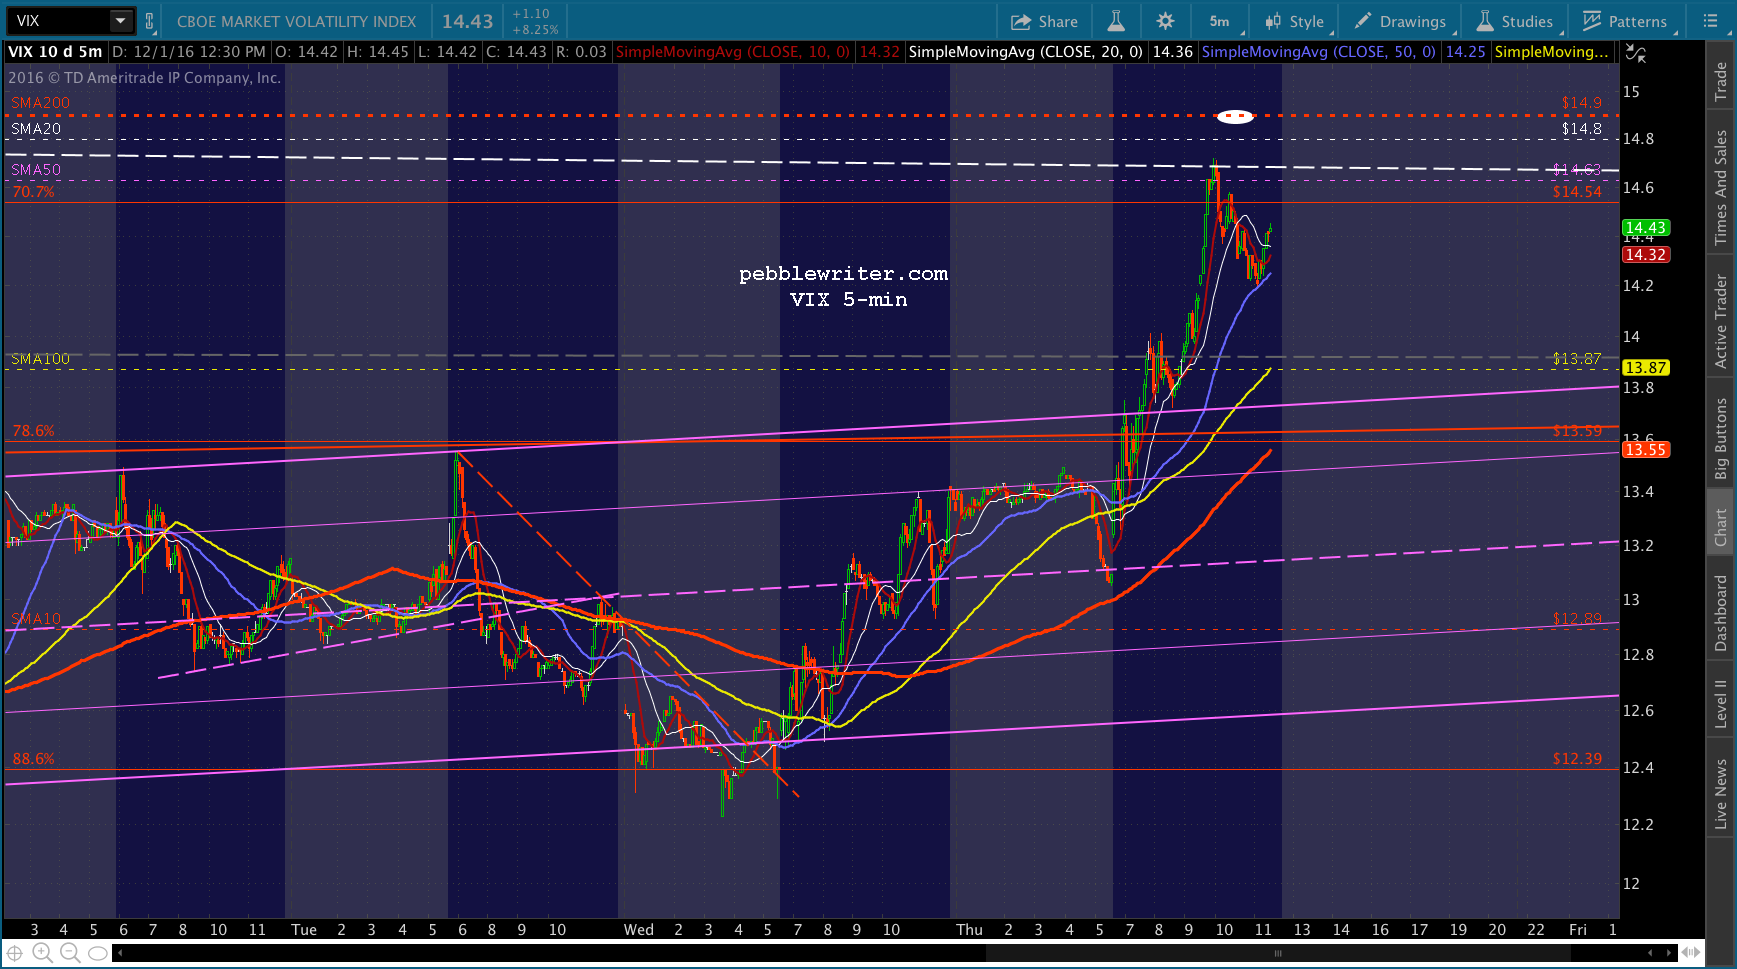
VIX has pushed above the SMA100, which indicates we have further to go. Watch your stops if it reverses and SPX does more than backtest the SMA10. CL is still above the .886 and is nudging higher. The euro close is coming up in 30 minutes.
UPDATE: 11:34 AM
SPX hasn’t yet declared. I have to step away for 20-30 minutes, but basically I’d want to remain short below the SMA10 and in cash above it. The SMA5 20 should serve as a reasonable overhead resistance on the way down to the red 1.618 at 2188.29, followed by the purple midline at 2185ish. CL continues to offer a boost, while VIX is tiptoeing all around the SMA100, with a potential backtest of the purple channel a distinct possibility.

UPDATE: 12:19 PM
Progress report…so far, so good.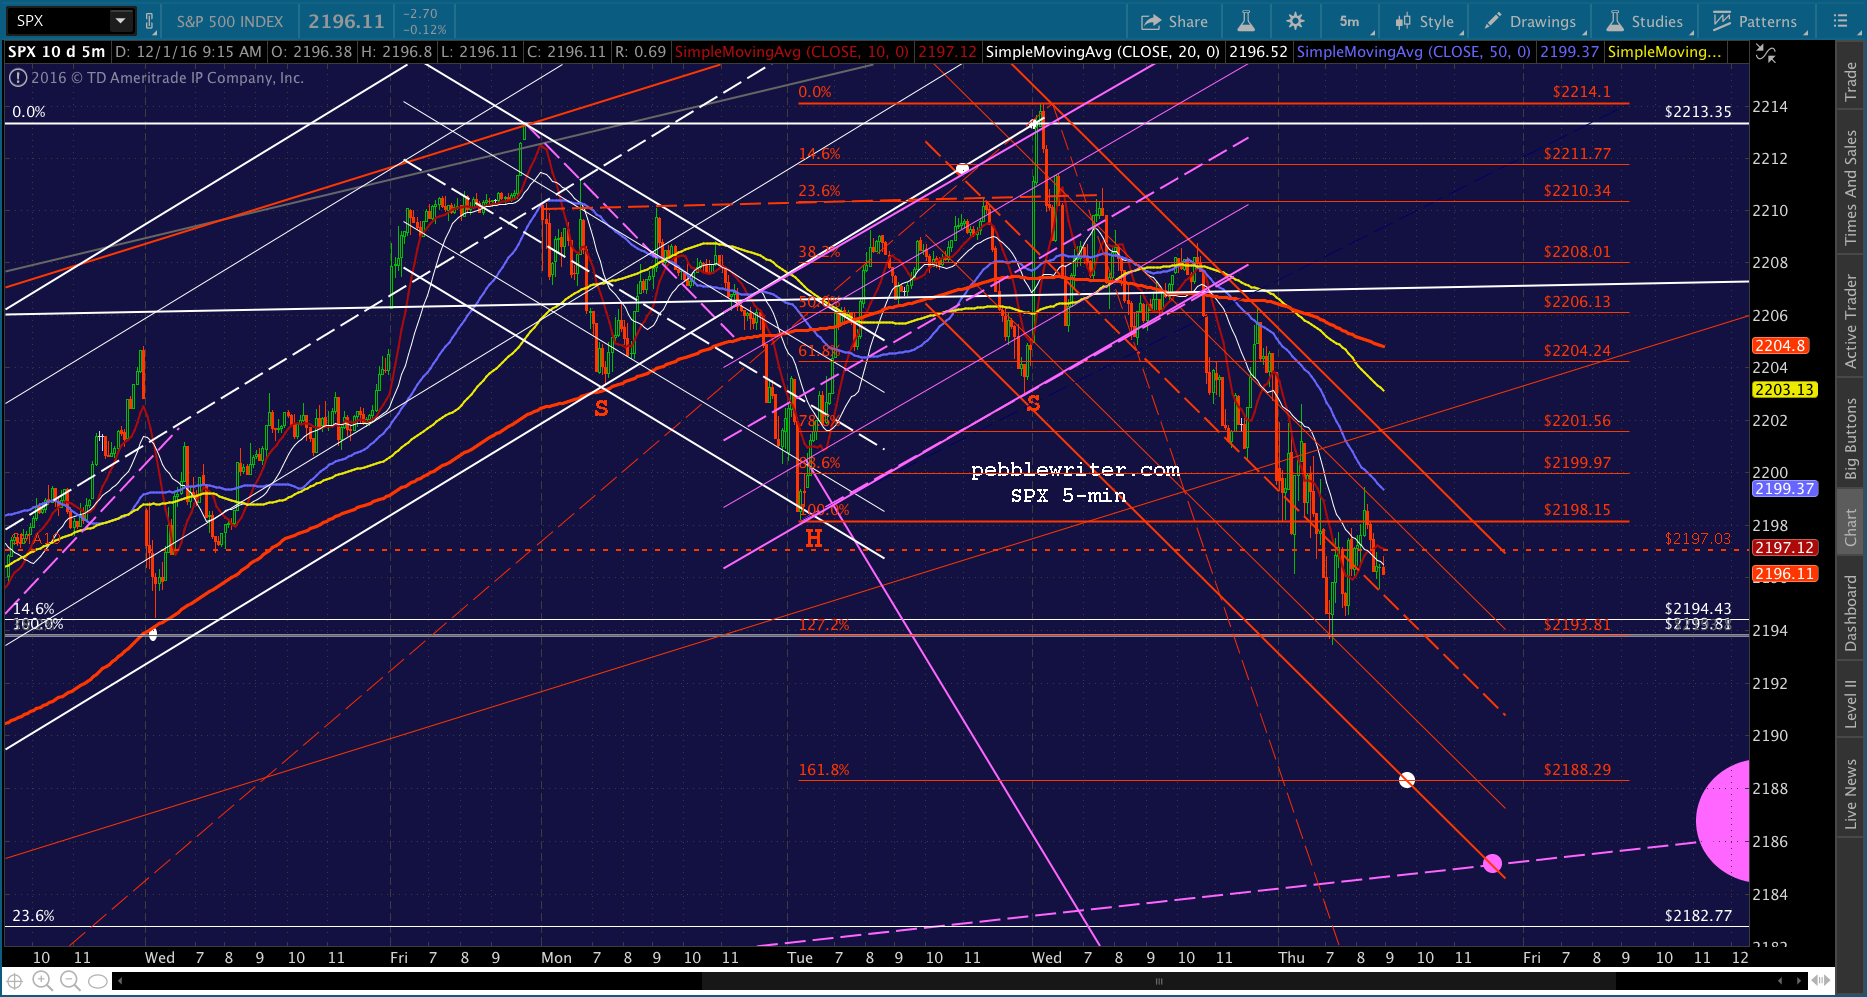
UPDATE: 1:11 PM
SPX is approaching our next target at 2188.29. Note that VIX is also approaching its SMA200 at 14.90. Reaching it might very well align with SPX’s bottom or, at least, an interim bottom.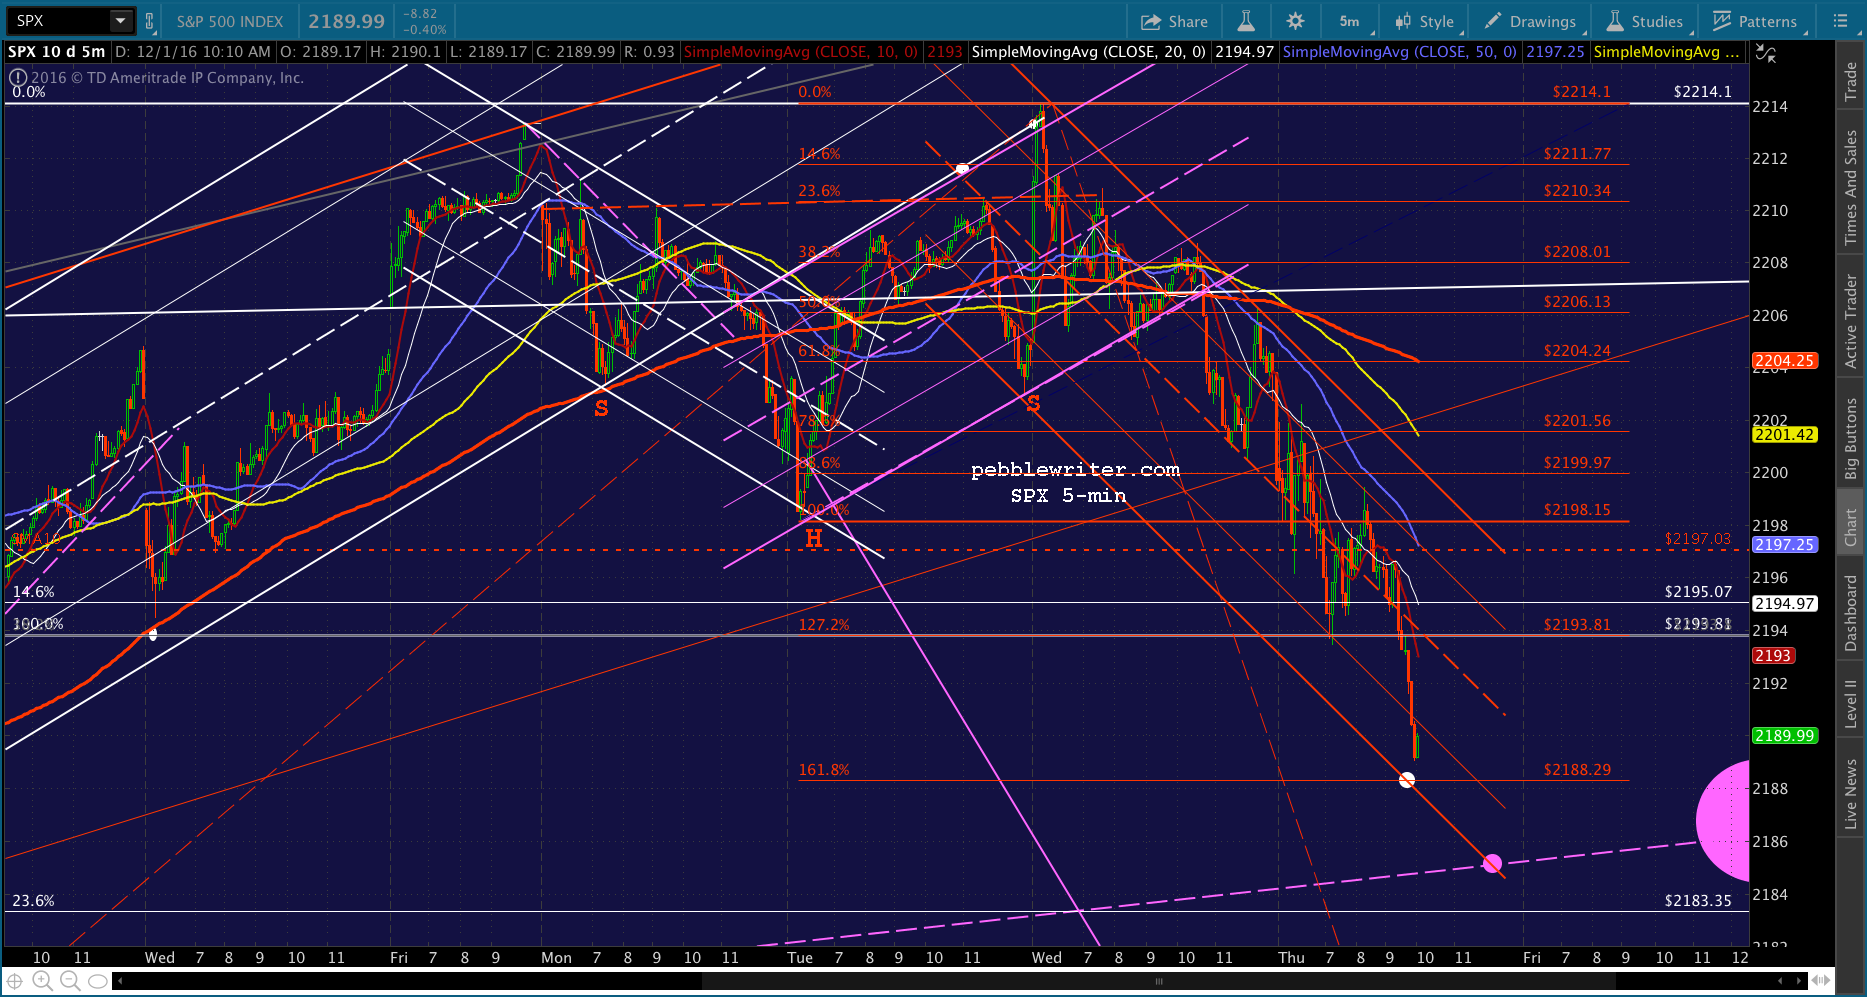
UPDATE: 2:10 PM
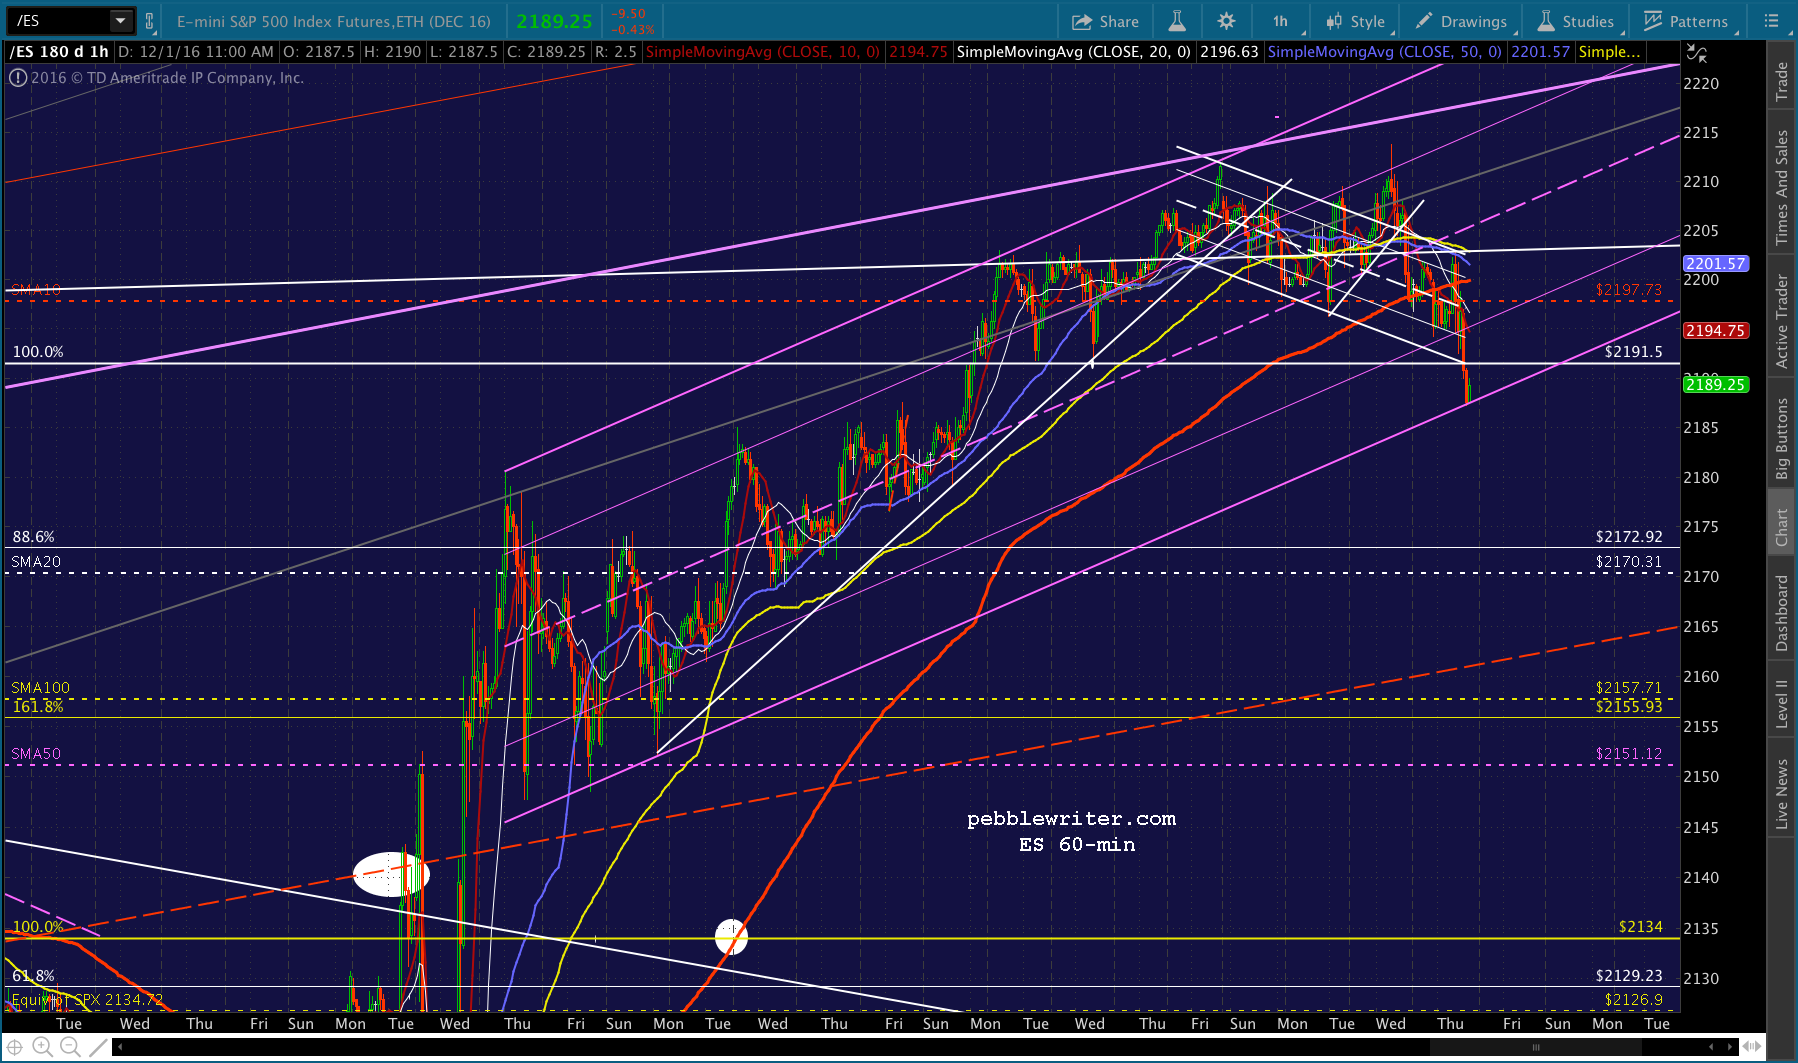
If it seems like SPX is having trouble getting down to 2188.29, it’s because of ES. Its rising purple channel will need to break down, at least a little, for SPX to reach our target. If it breaks down by more than a little, we will get a shot at the purple midline — currently around 2185.12.
A note of caution for bears: because the purple midline is rising, it will intersect with the 1.618 next Tuesday, which would be Day 105 in our analog. It would fit from a direction and timing standpoint, if not a price movement standpoint.
As we approach FOMC announcement day, we can expect the usual rally to higher prices…which are a better place, from bulls’ standpoint, from which to fall. In other words, don’t put all your marbles on 2138. I placed the purple target at 2186 for a reason.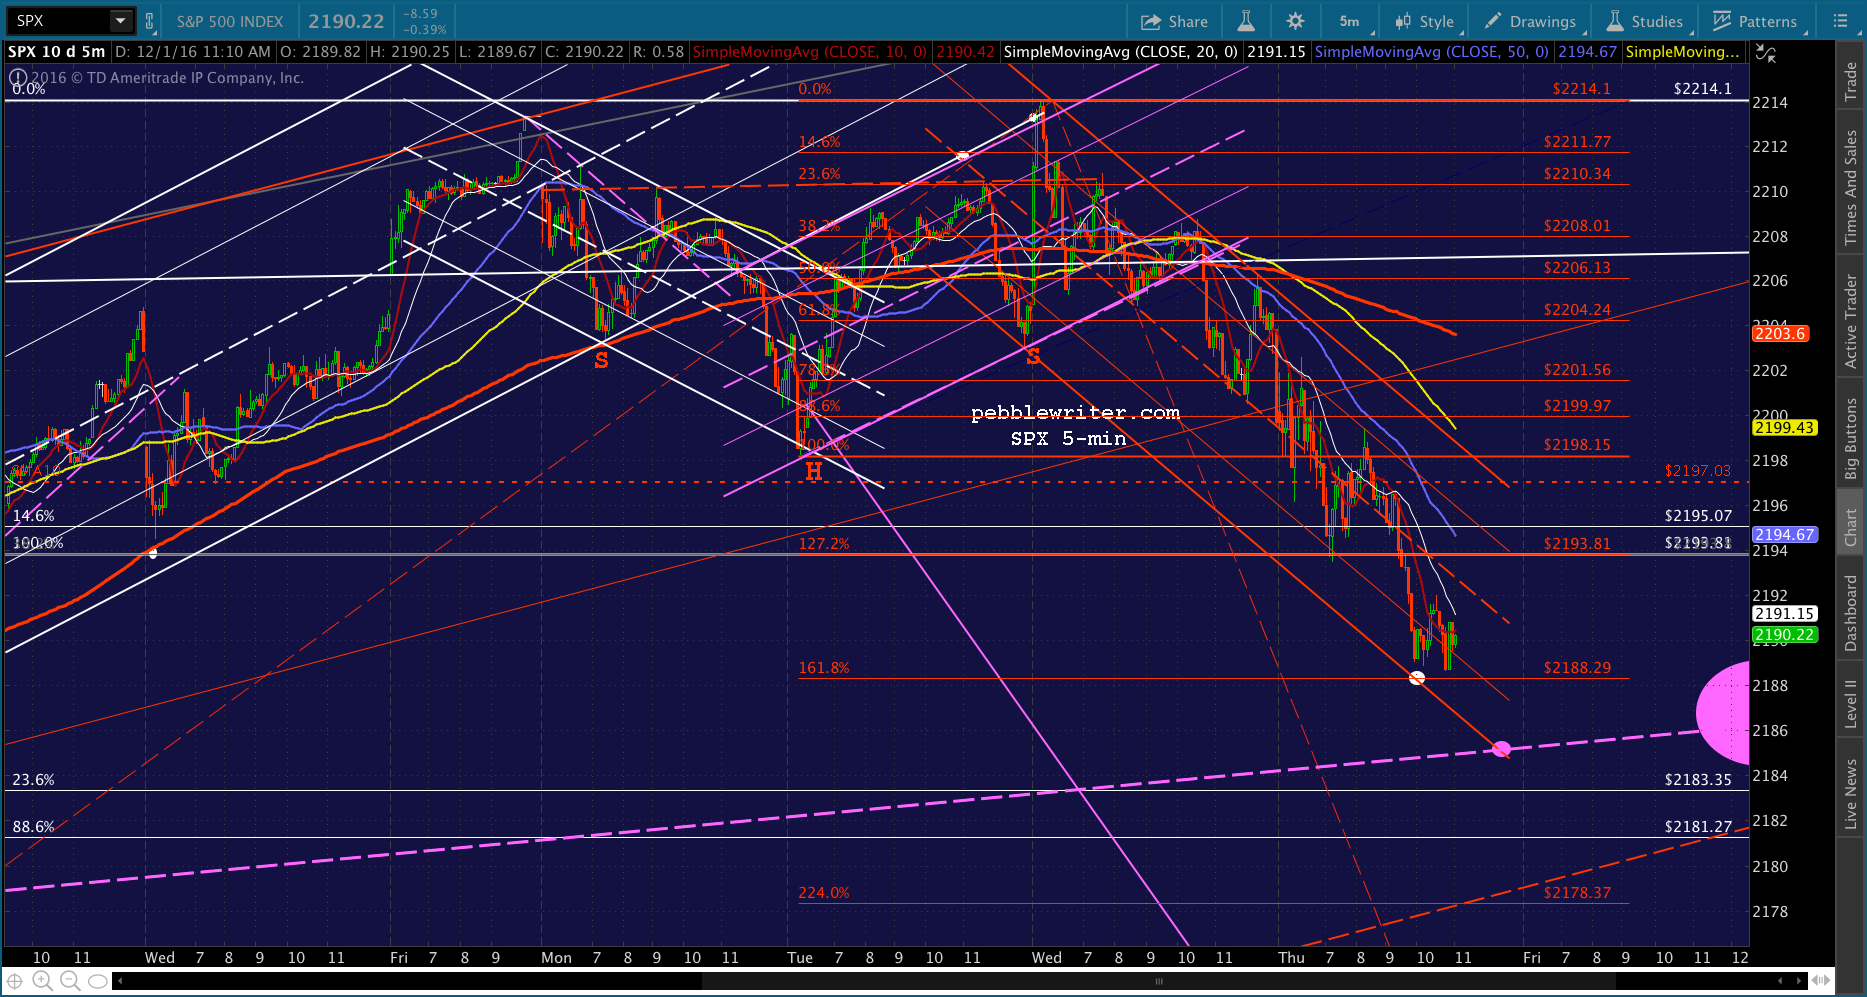
UPDATE: 3:29 PM
SPX just tagged our 2188.29 target. VIX continues to levitate, so SPX should leak lower. But, remember, we’re within a few points of a potential strong bounce. So, watch your stops.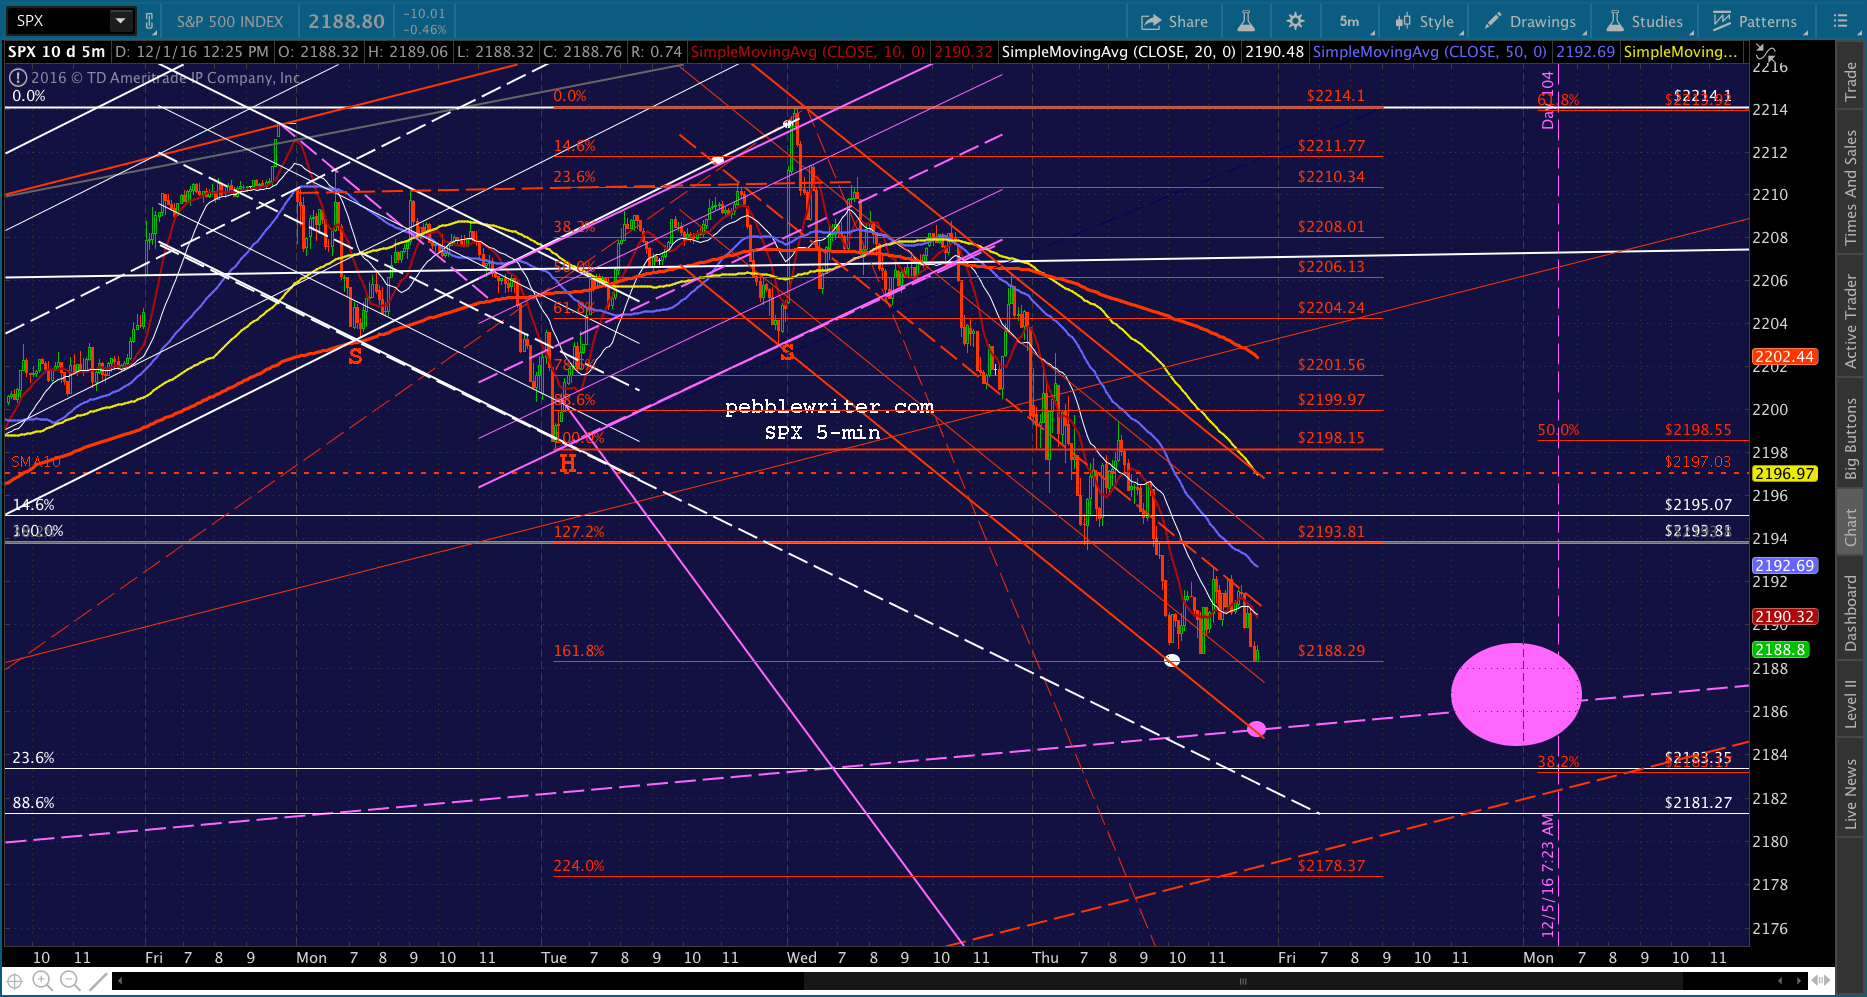
UPDATE: 3:44 PM
VIX seems to be reversing. If you’re not planning on holding short overnight, this is probably as good an exit point as any.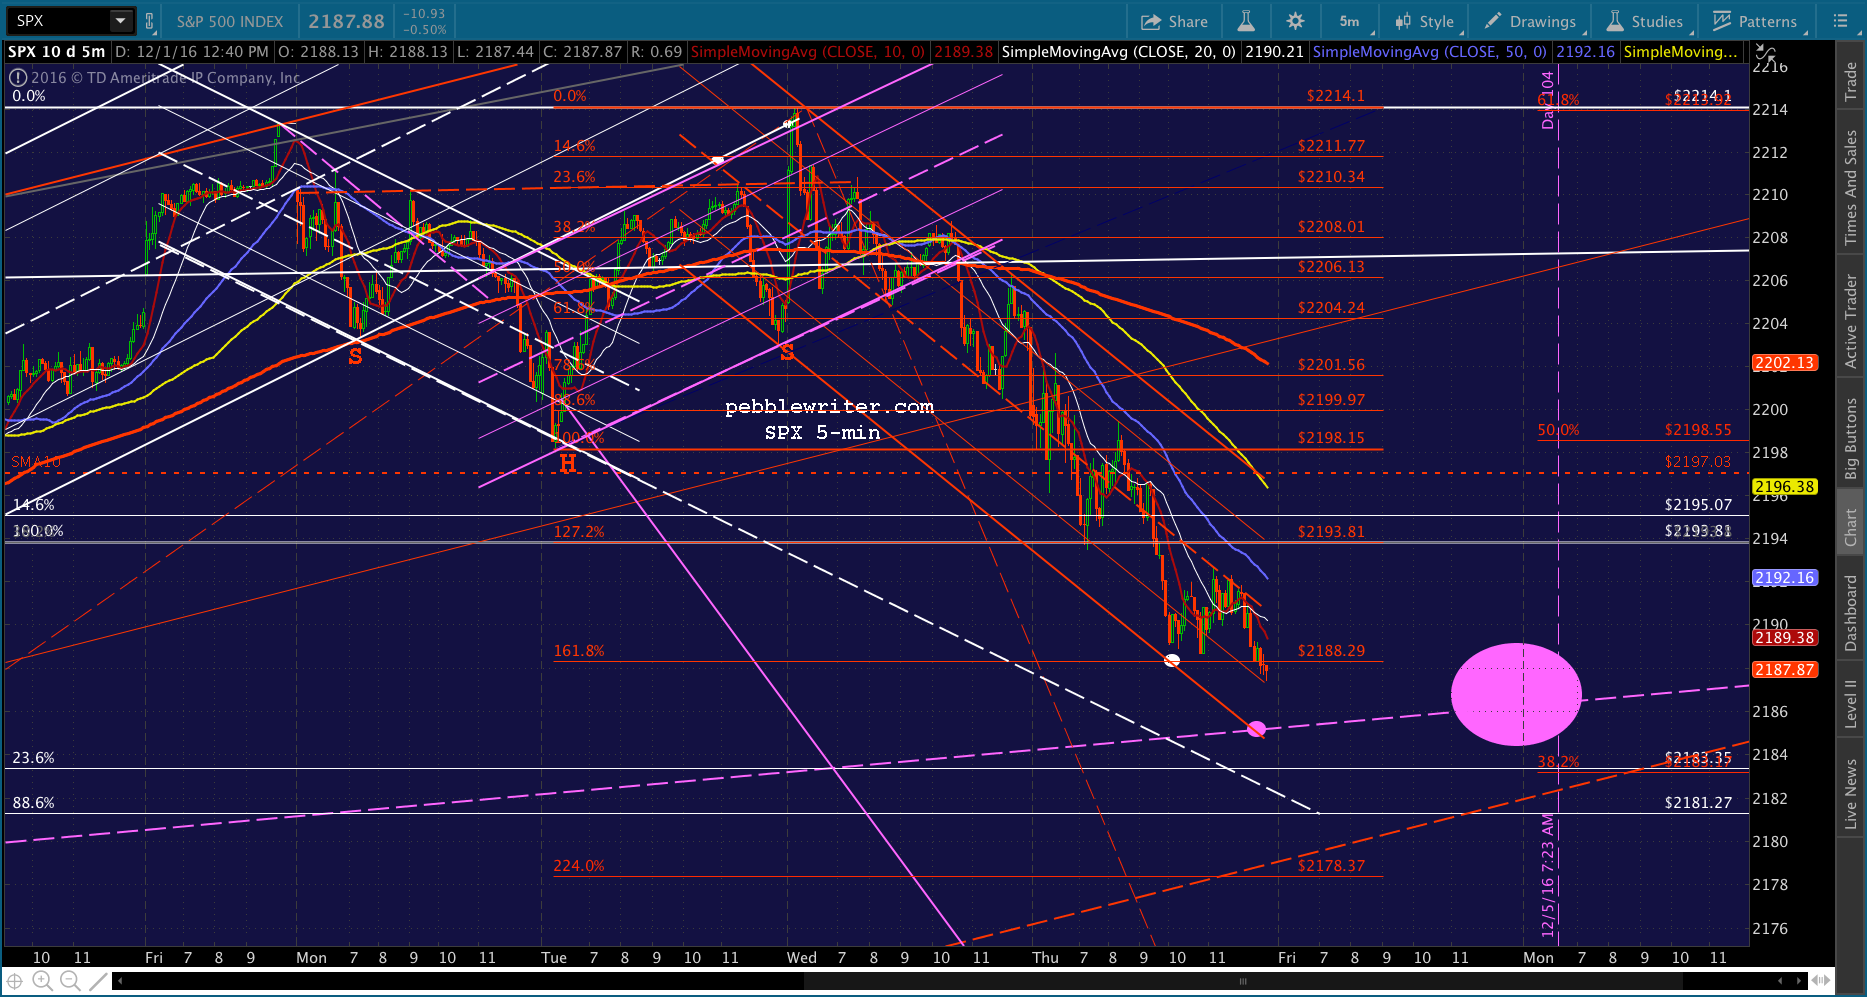
I believe we’ll move lower, but certainly can’t rule out a nice bounce or even reversal here.
.
Comments
4 responses to “The Nikkei, Yen and Oil: Joined at the Hip”
Very nice job charting PW as usual – excellent targets!
Nasdaq really tanking…
Good time to short CL or not yet?
Yes, I would definitely short it here. It might take a while to play out, but it should be a winner.