

As Congress dithers over a stimulus bill, the part of the economy not reflected by the stock market continues to suffer. How long before the market takes notice?
Most factors driving stock prices are currently tracing out triangles – a chart pattern marked by lower highs and higher lows. It’s the go to pattern for marking time before a big event such as an important economic data point, a Fed meeting or an election.
WTI is a perfect example.
continued for members…
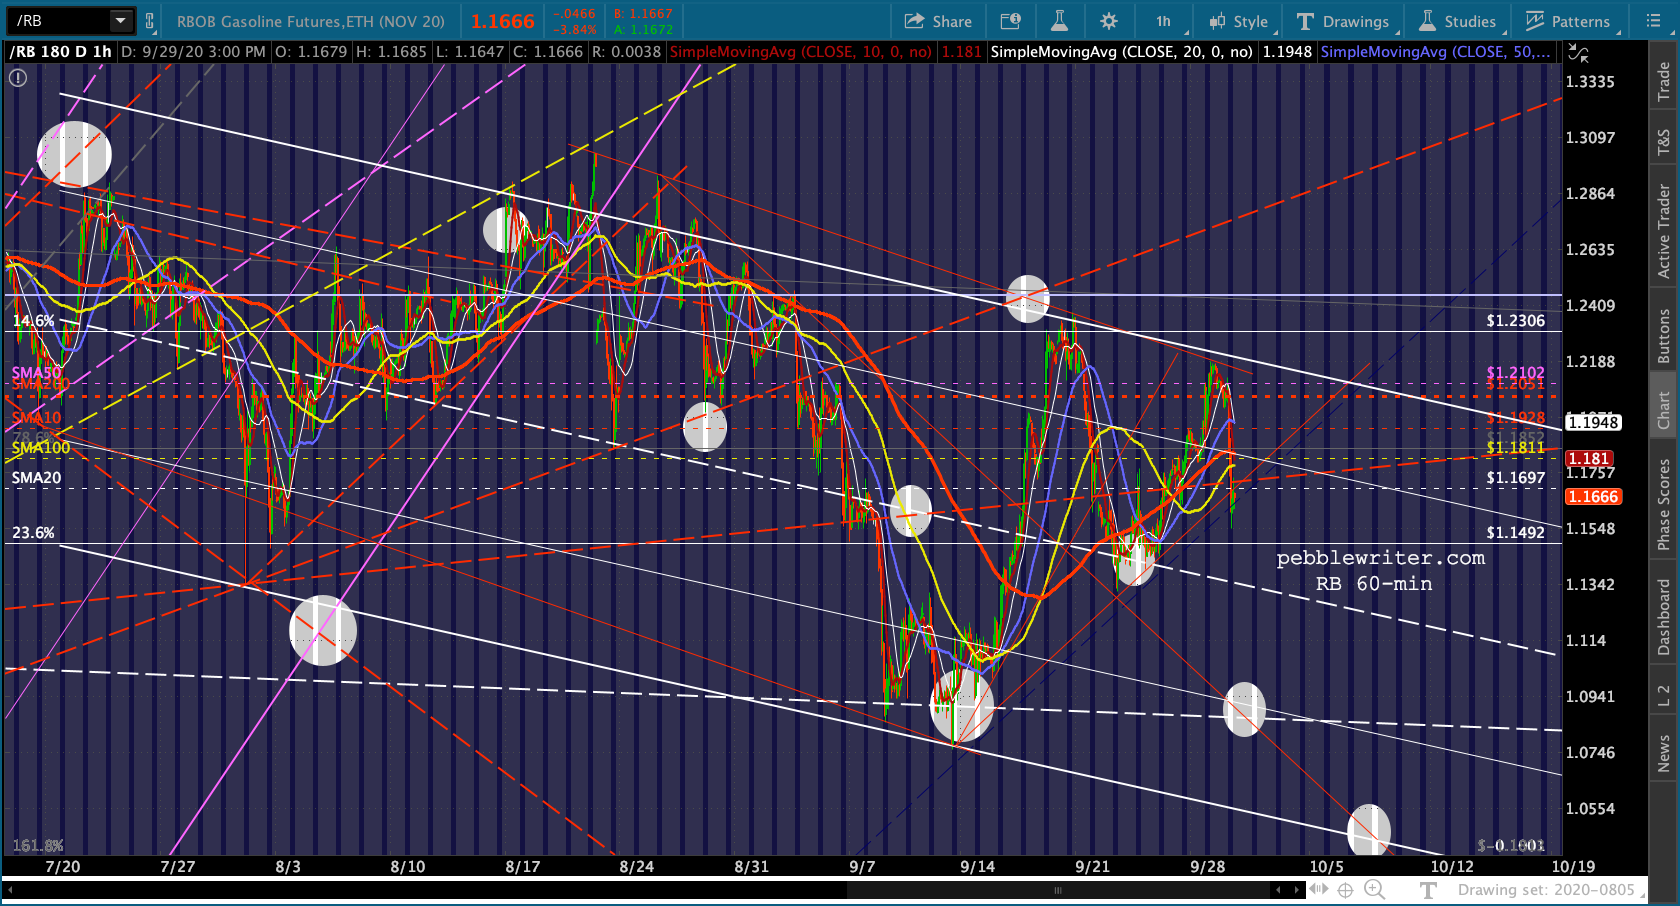
RB is in a similar position, though within a more clearly defined falling channel as opposed to CL, which has broken and backtested a rising channel and could be expanding it.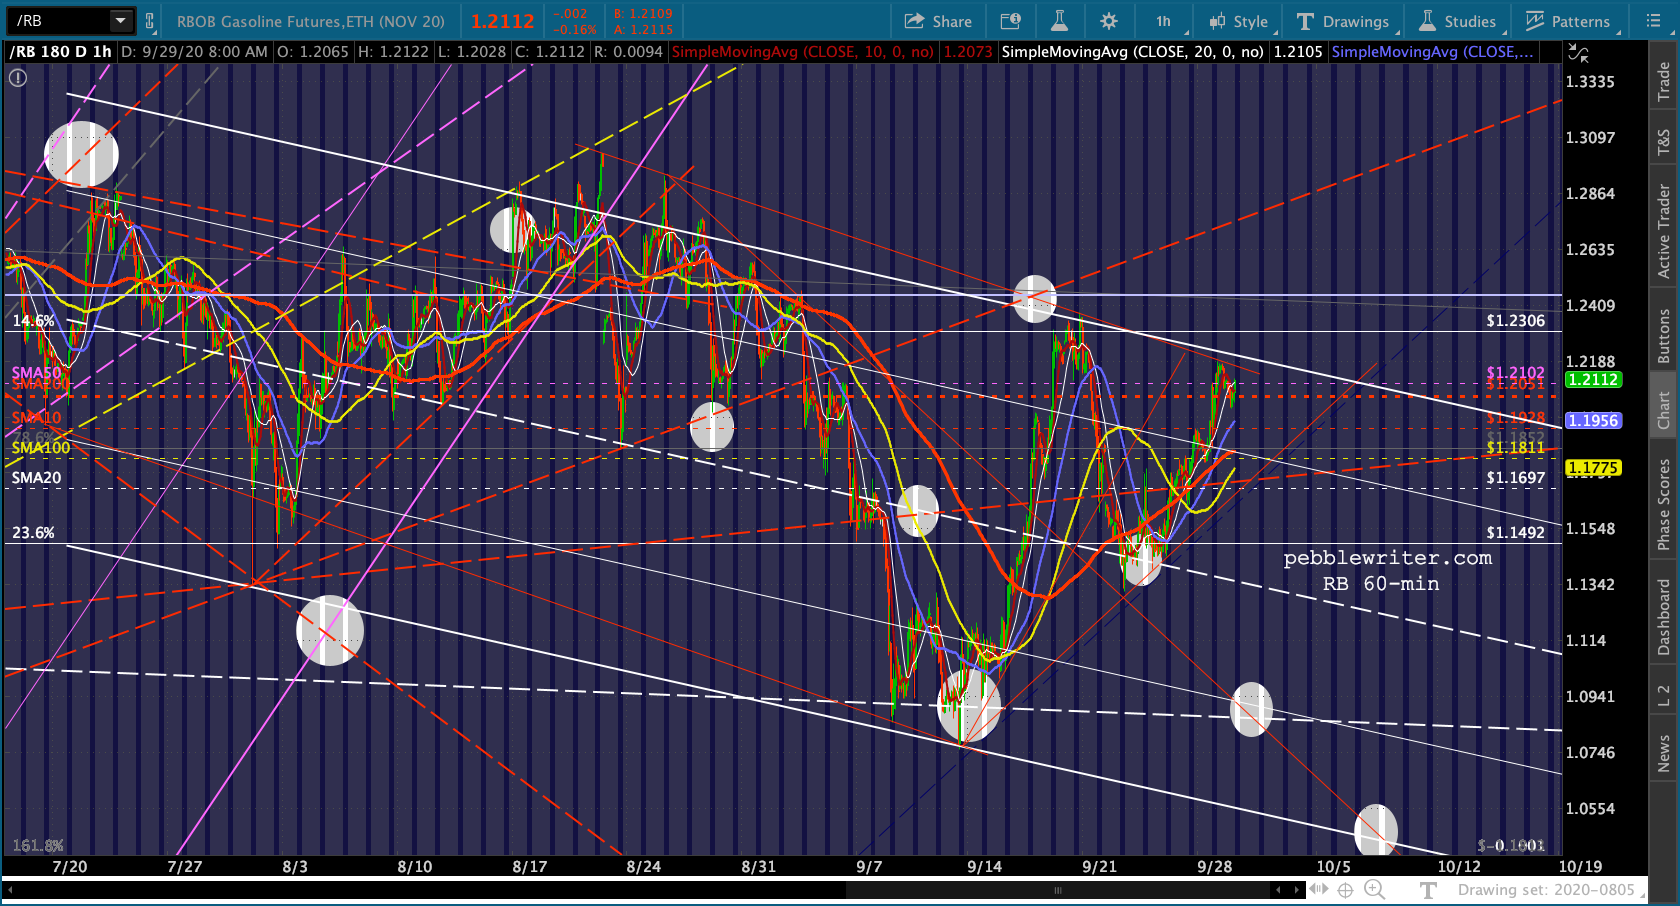 This should continue to place downward pressure on stocks unless, of course, the triangle breaks to the upside instead of breaking down – a scenario which is a definite possibility given the coziness between Trump and the Saudis.
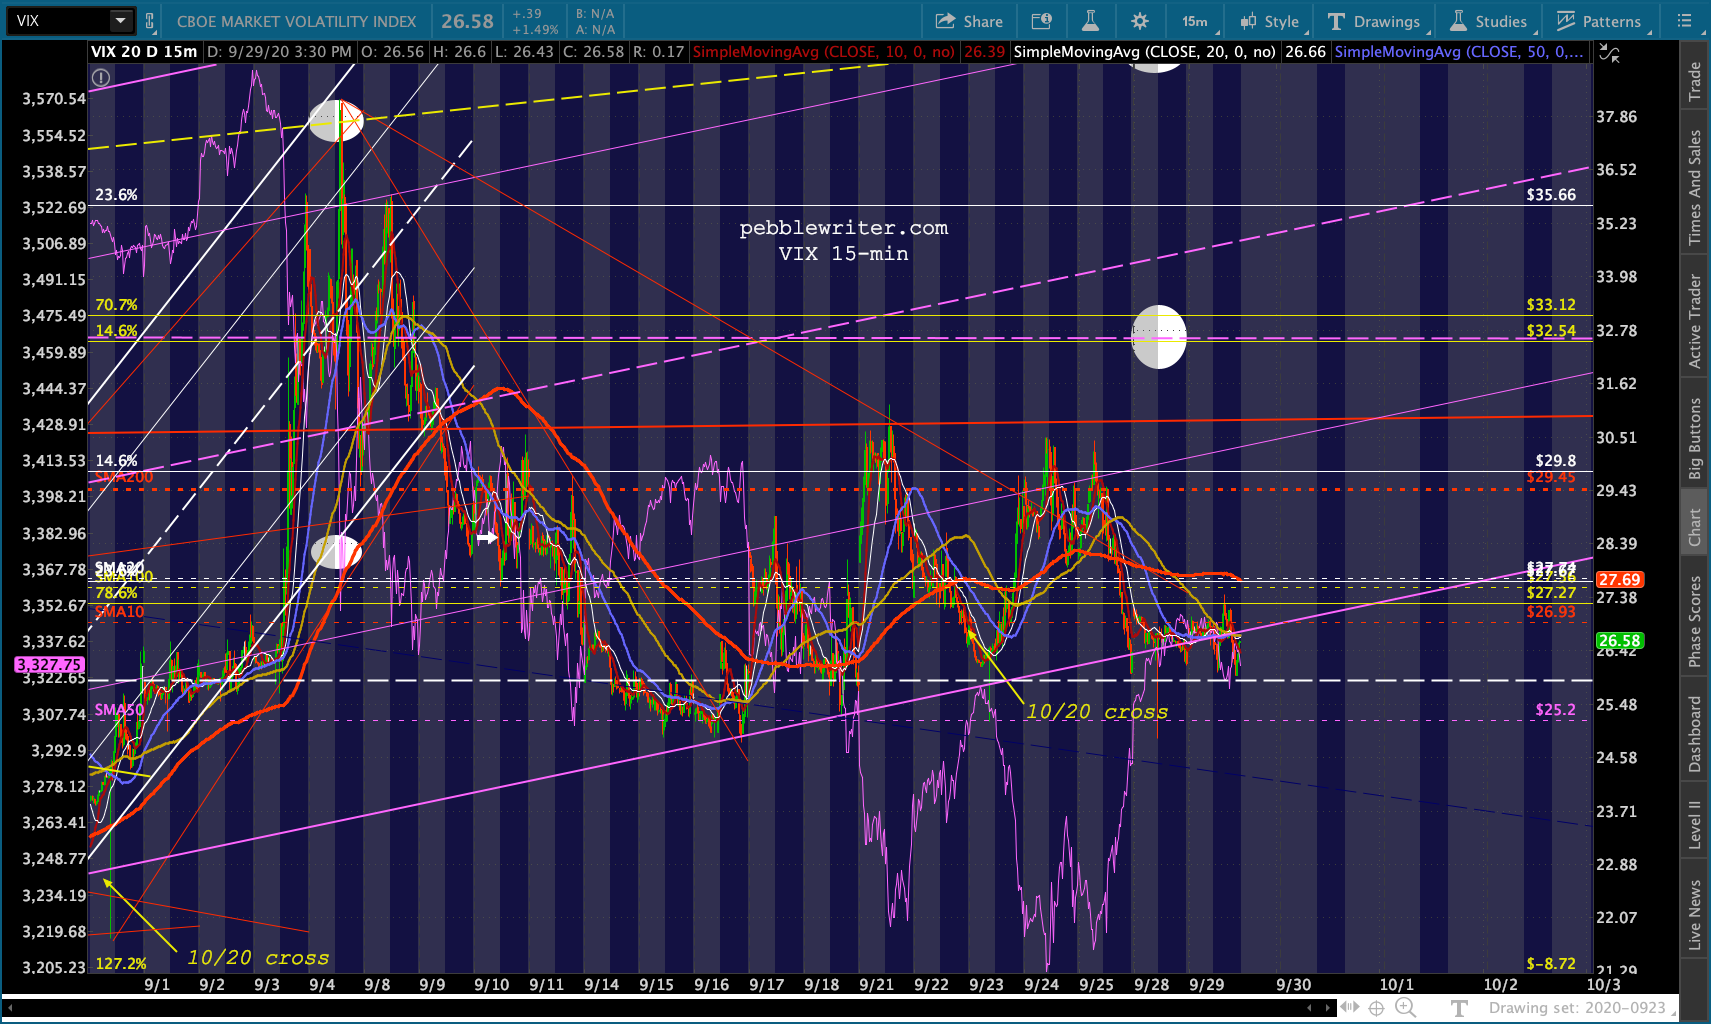
 VIX is still in position to break down if need be to prop up stocks – which it has done consistently over the past several sessions.
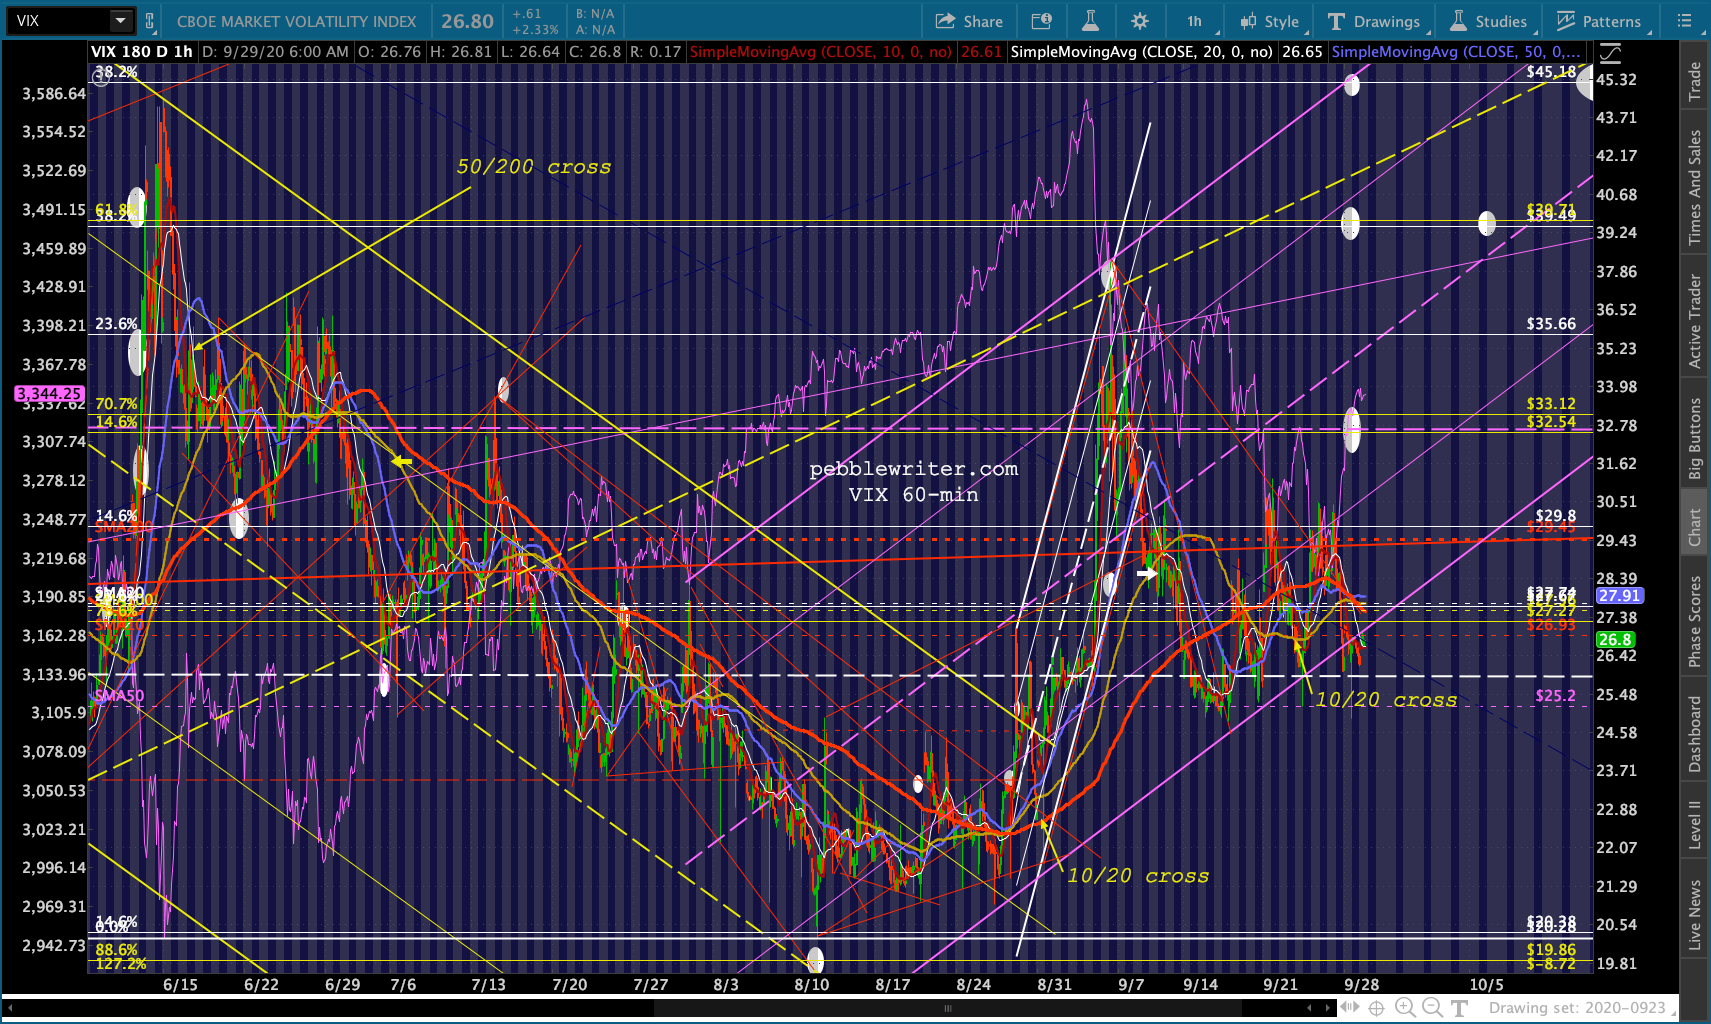 And, though DXY continues to falter, USDJPY could pop through its backtest if the BoJ decides that maintaining that .886 is important enough.
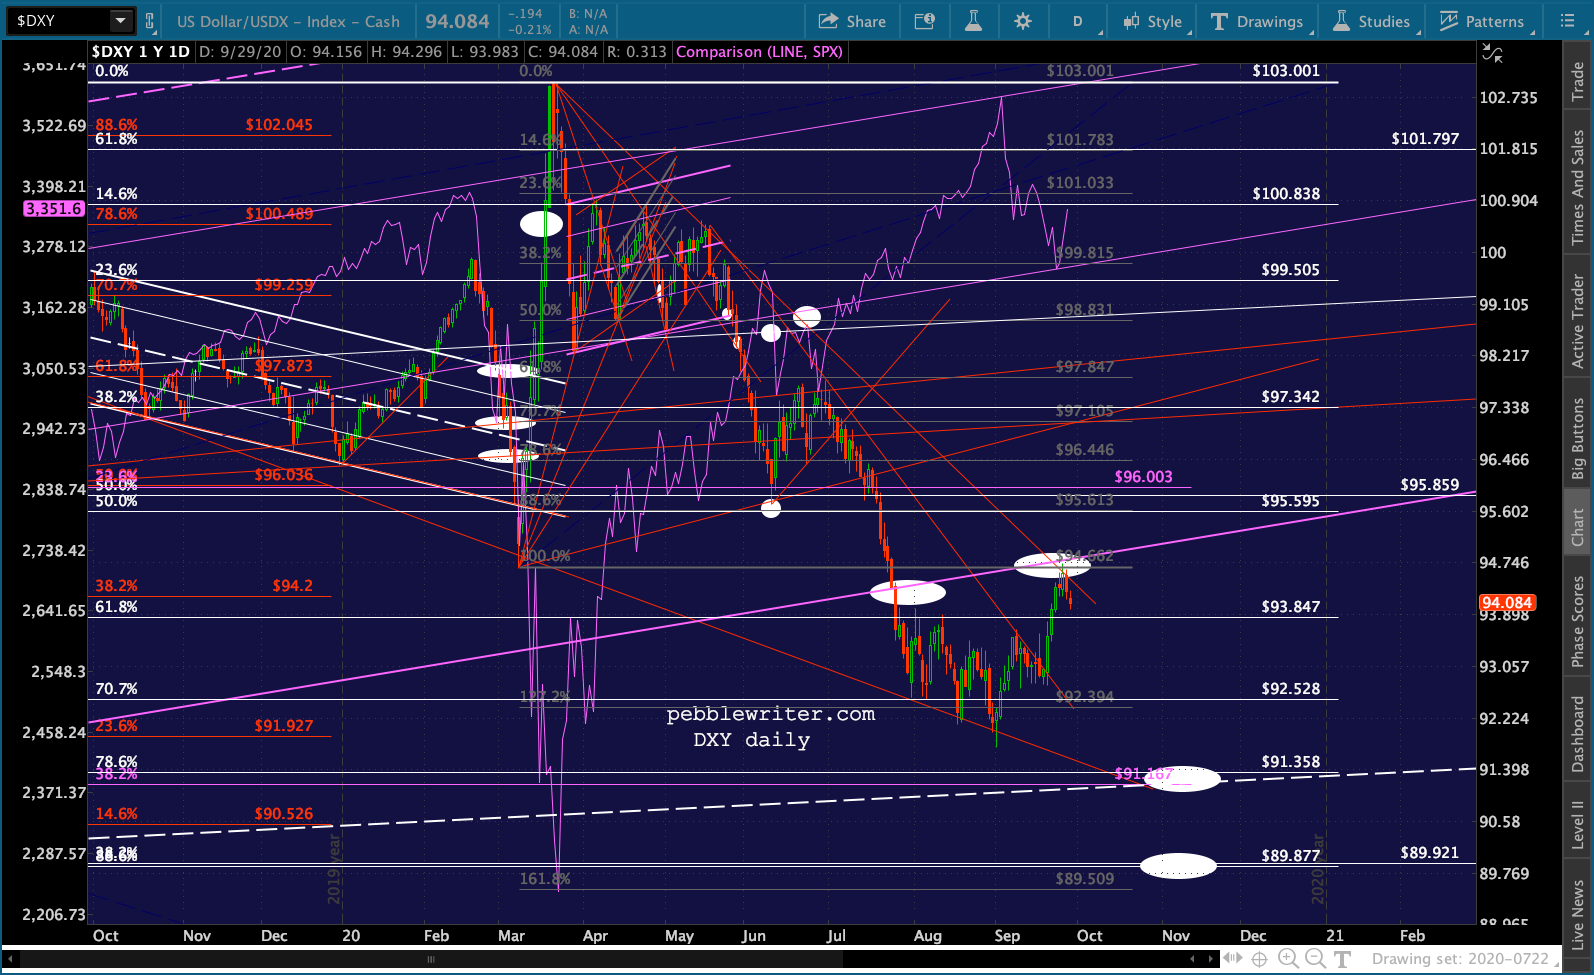

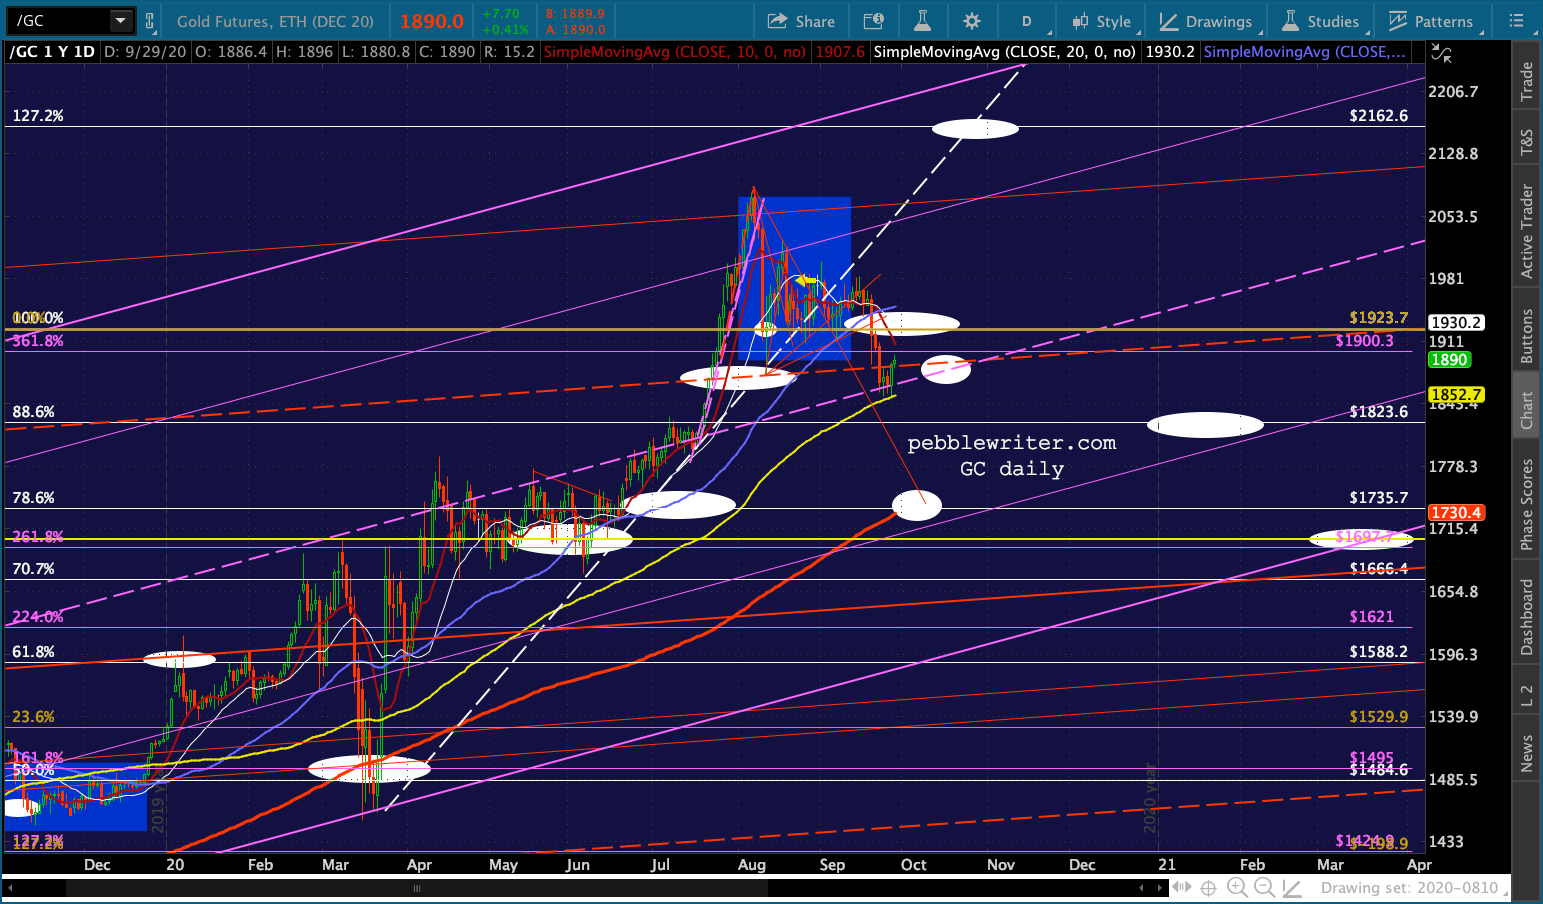
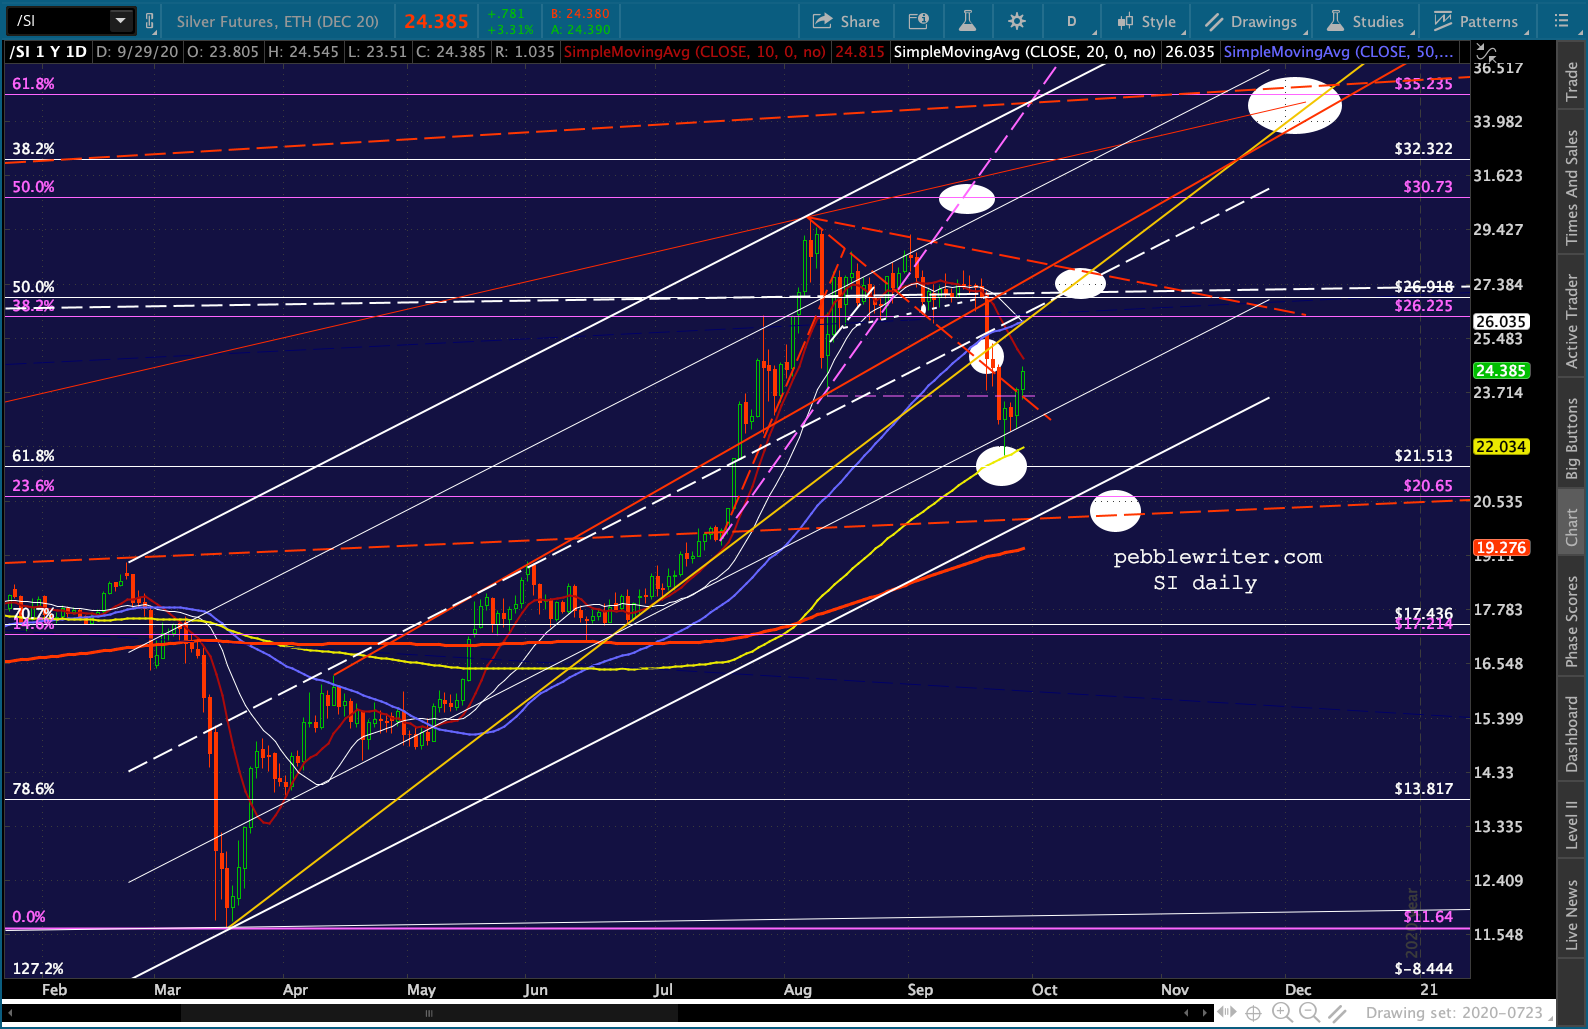
 GC and SI are trying to bounce, but will need DXY to cooperate by continuing to drop.
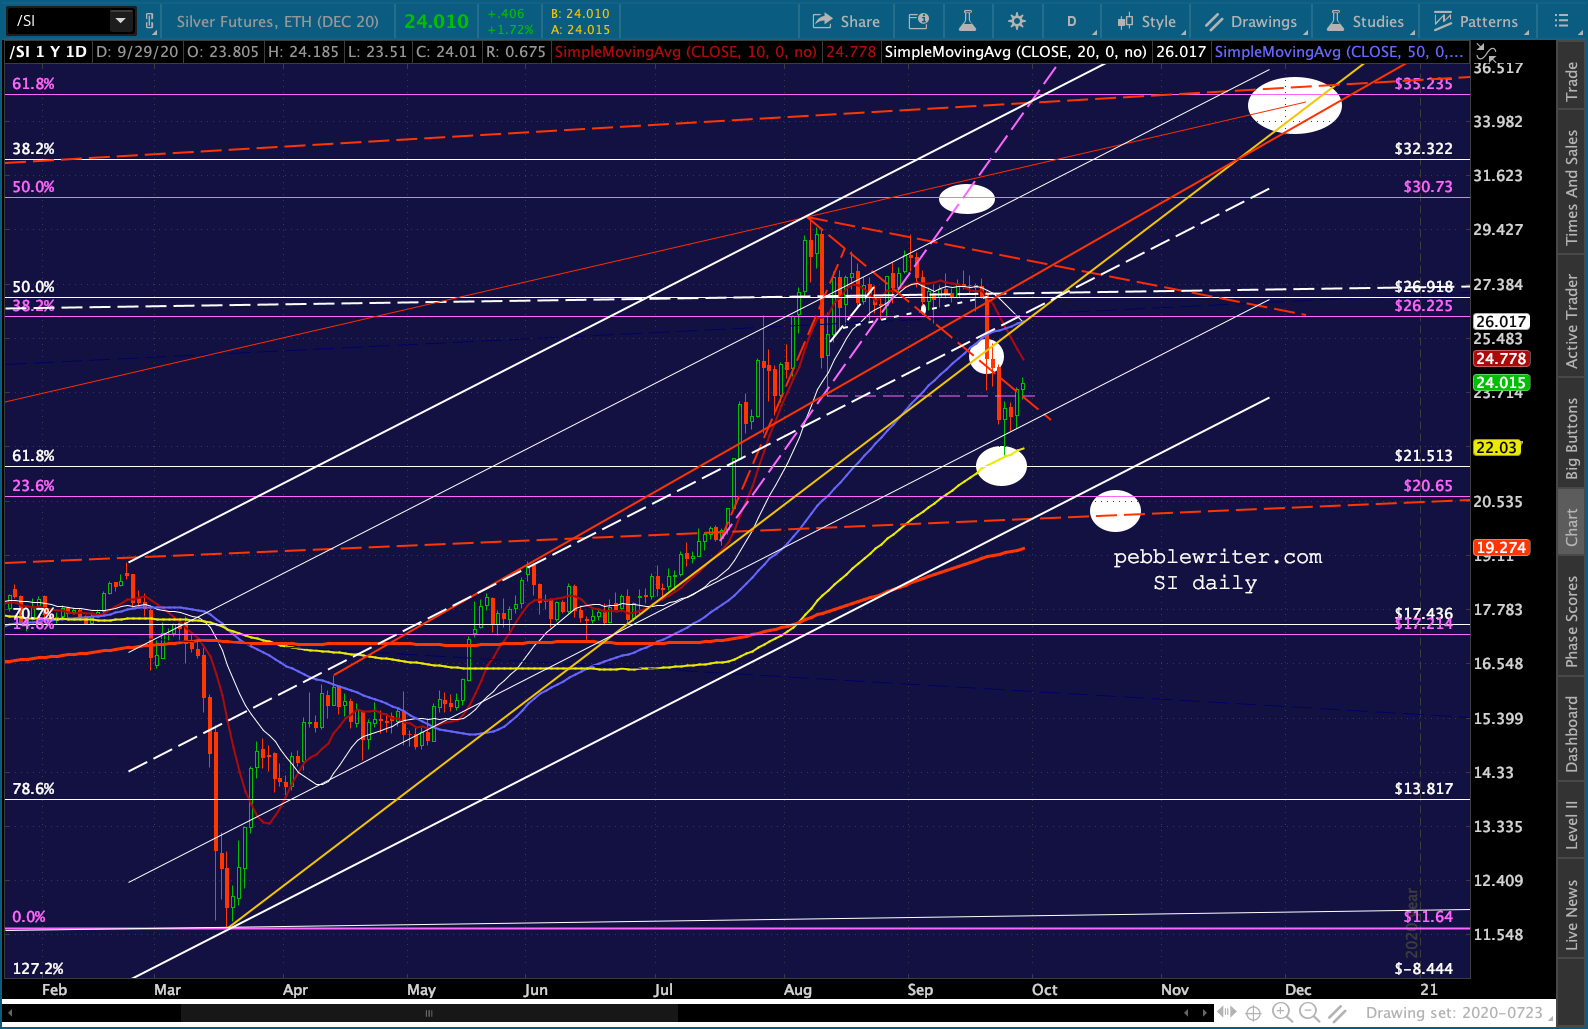
 If TNX would continue to break down, it seems like only a matter of time.
 More later…
UPDATE: 3:40 PM
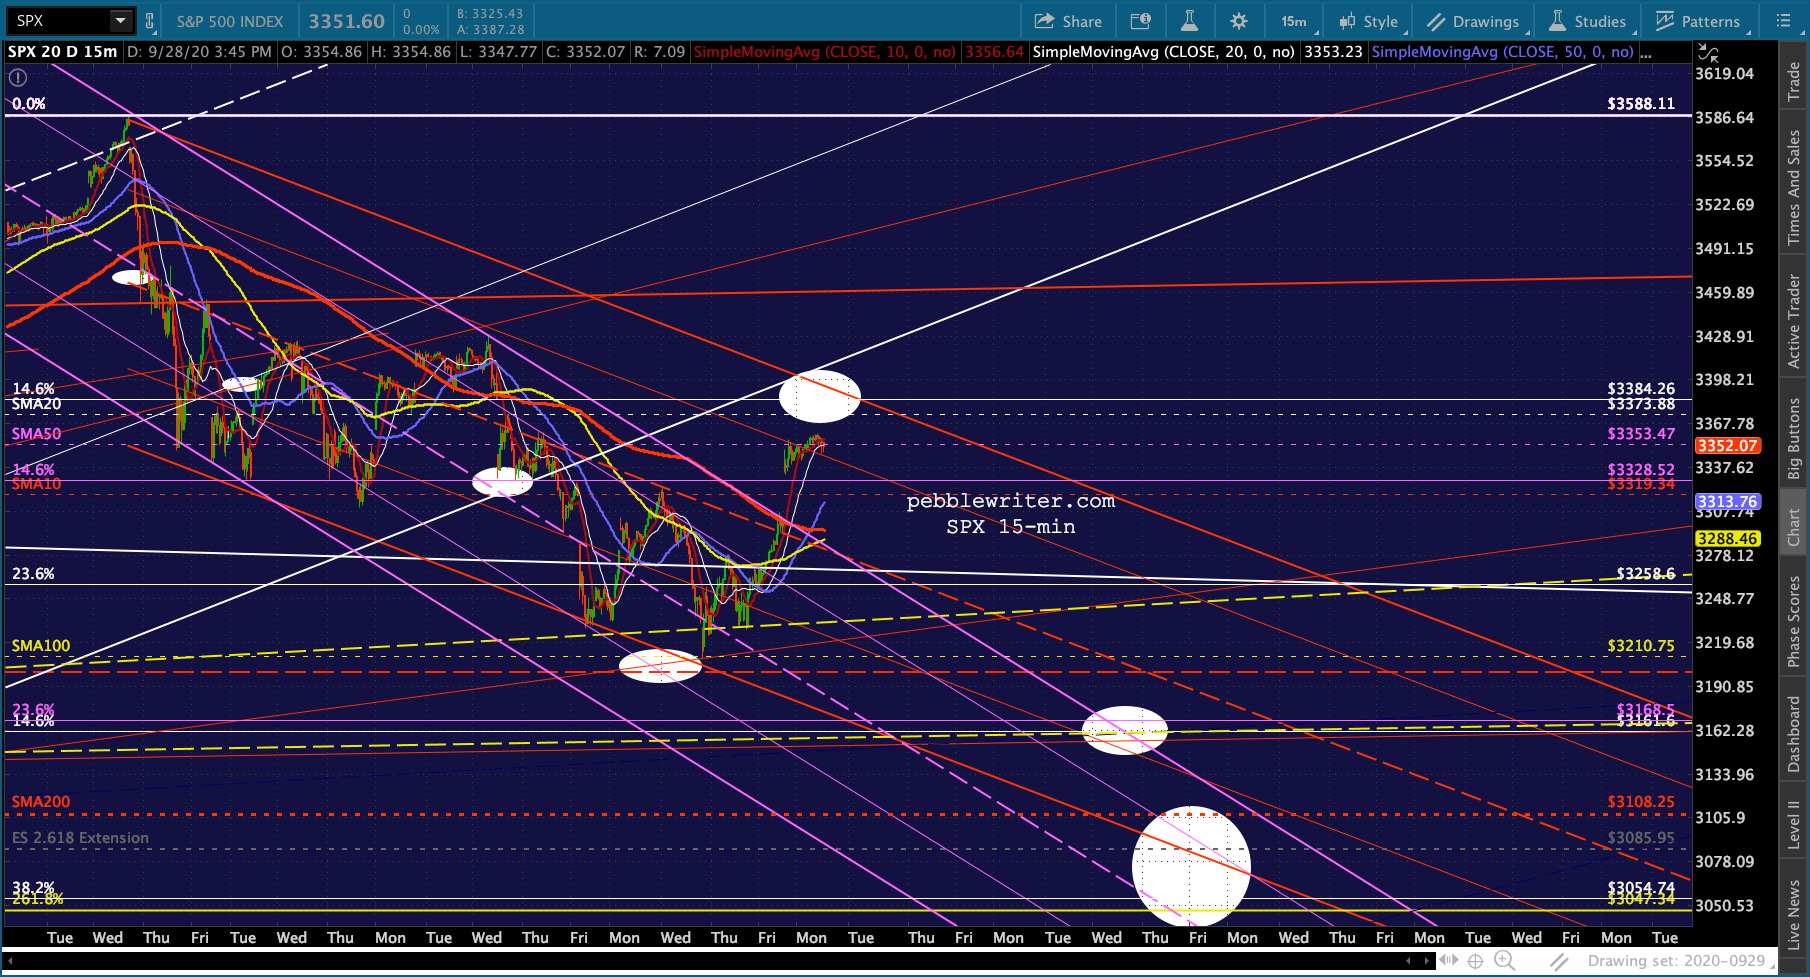
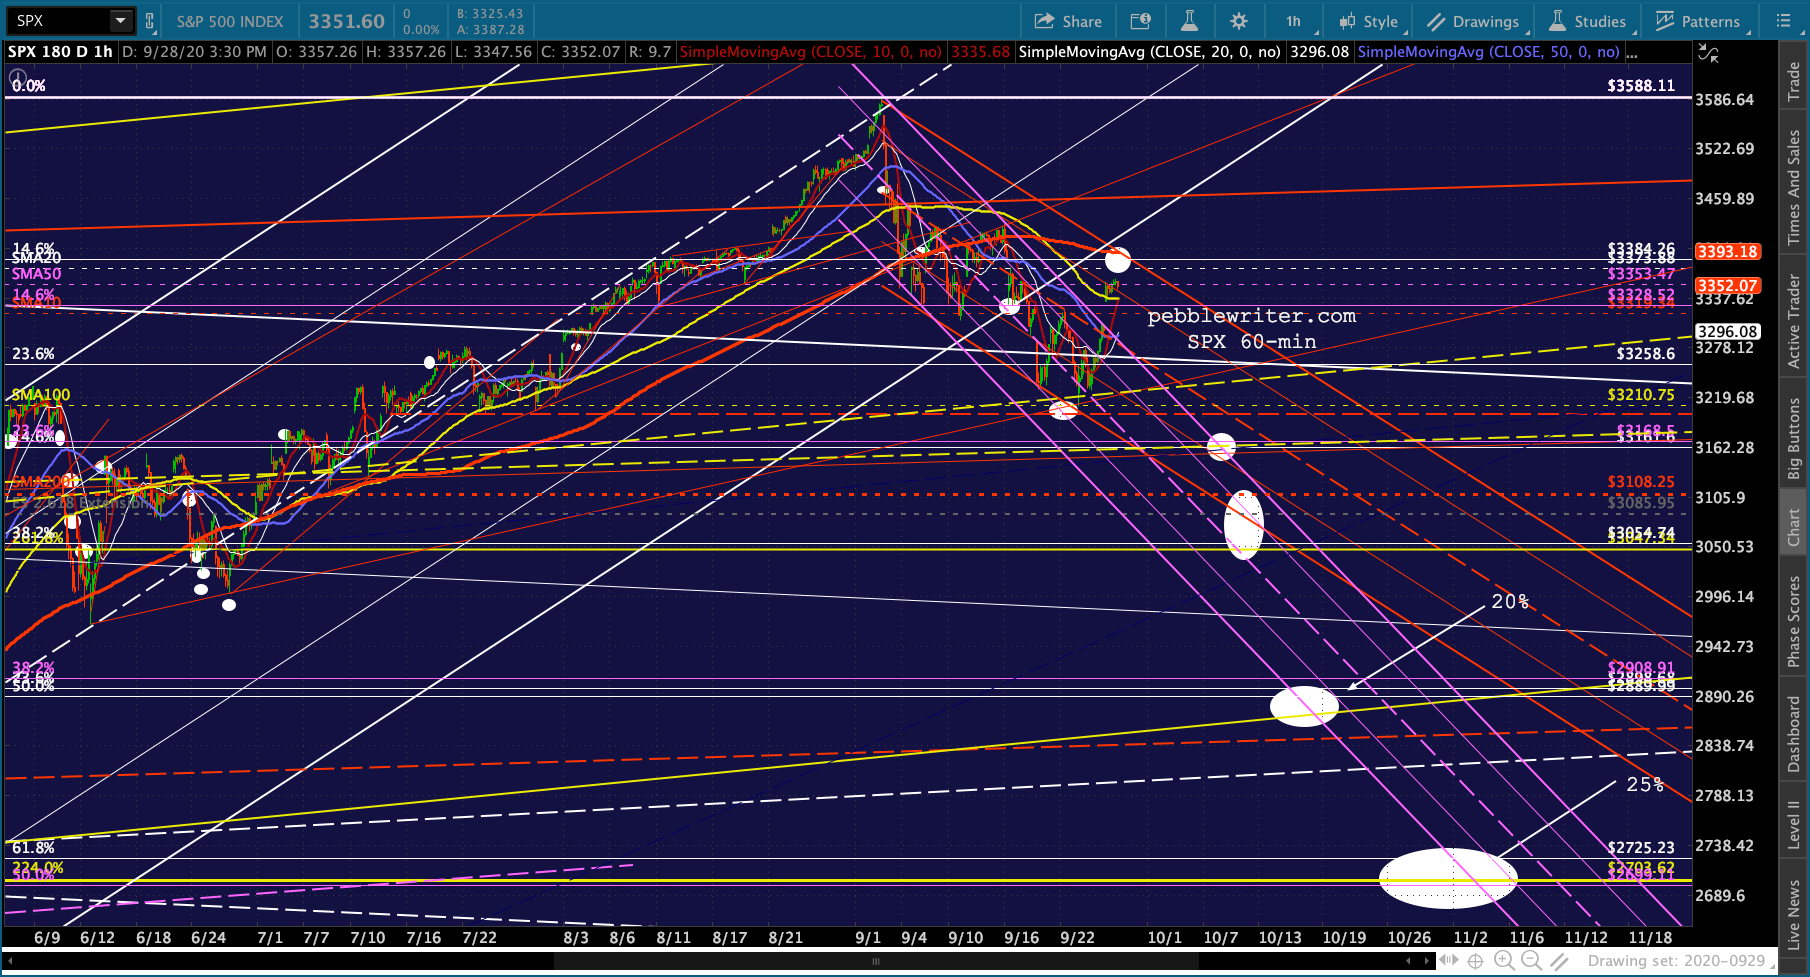
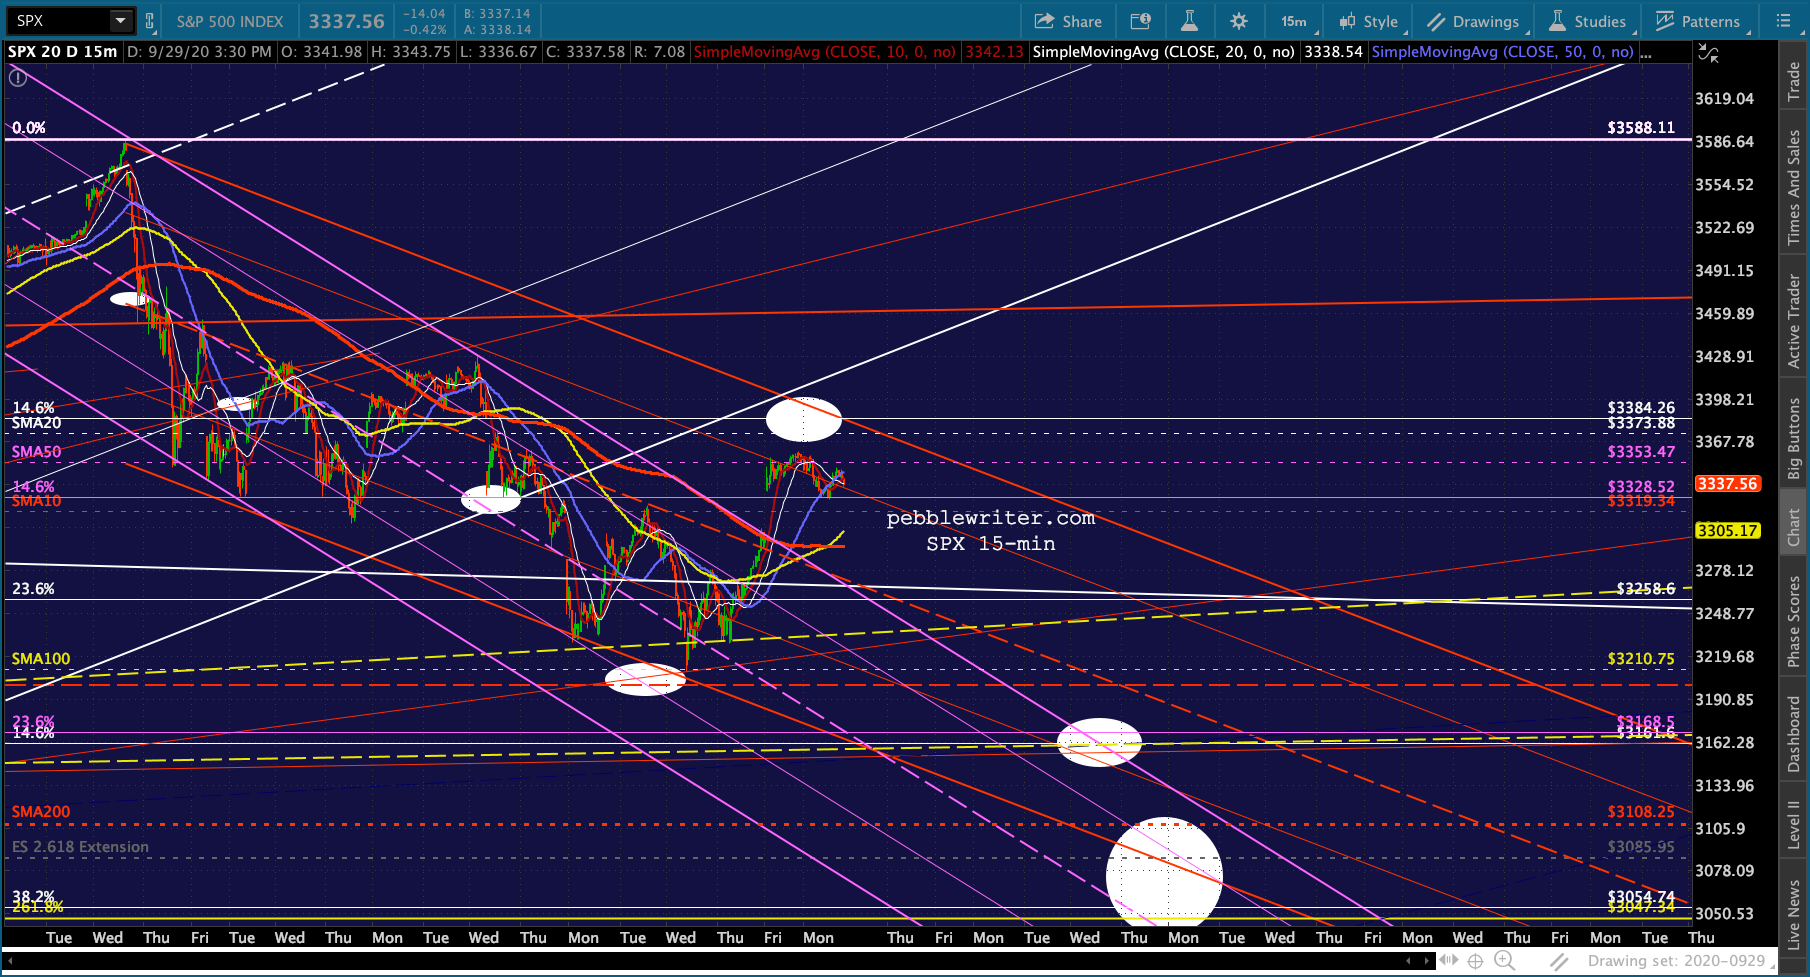
Pretty much as expected, with VIX again slumping into the close to prop up SPX.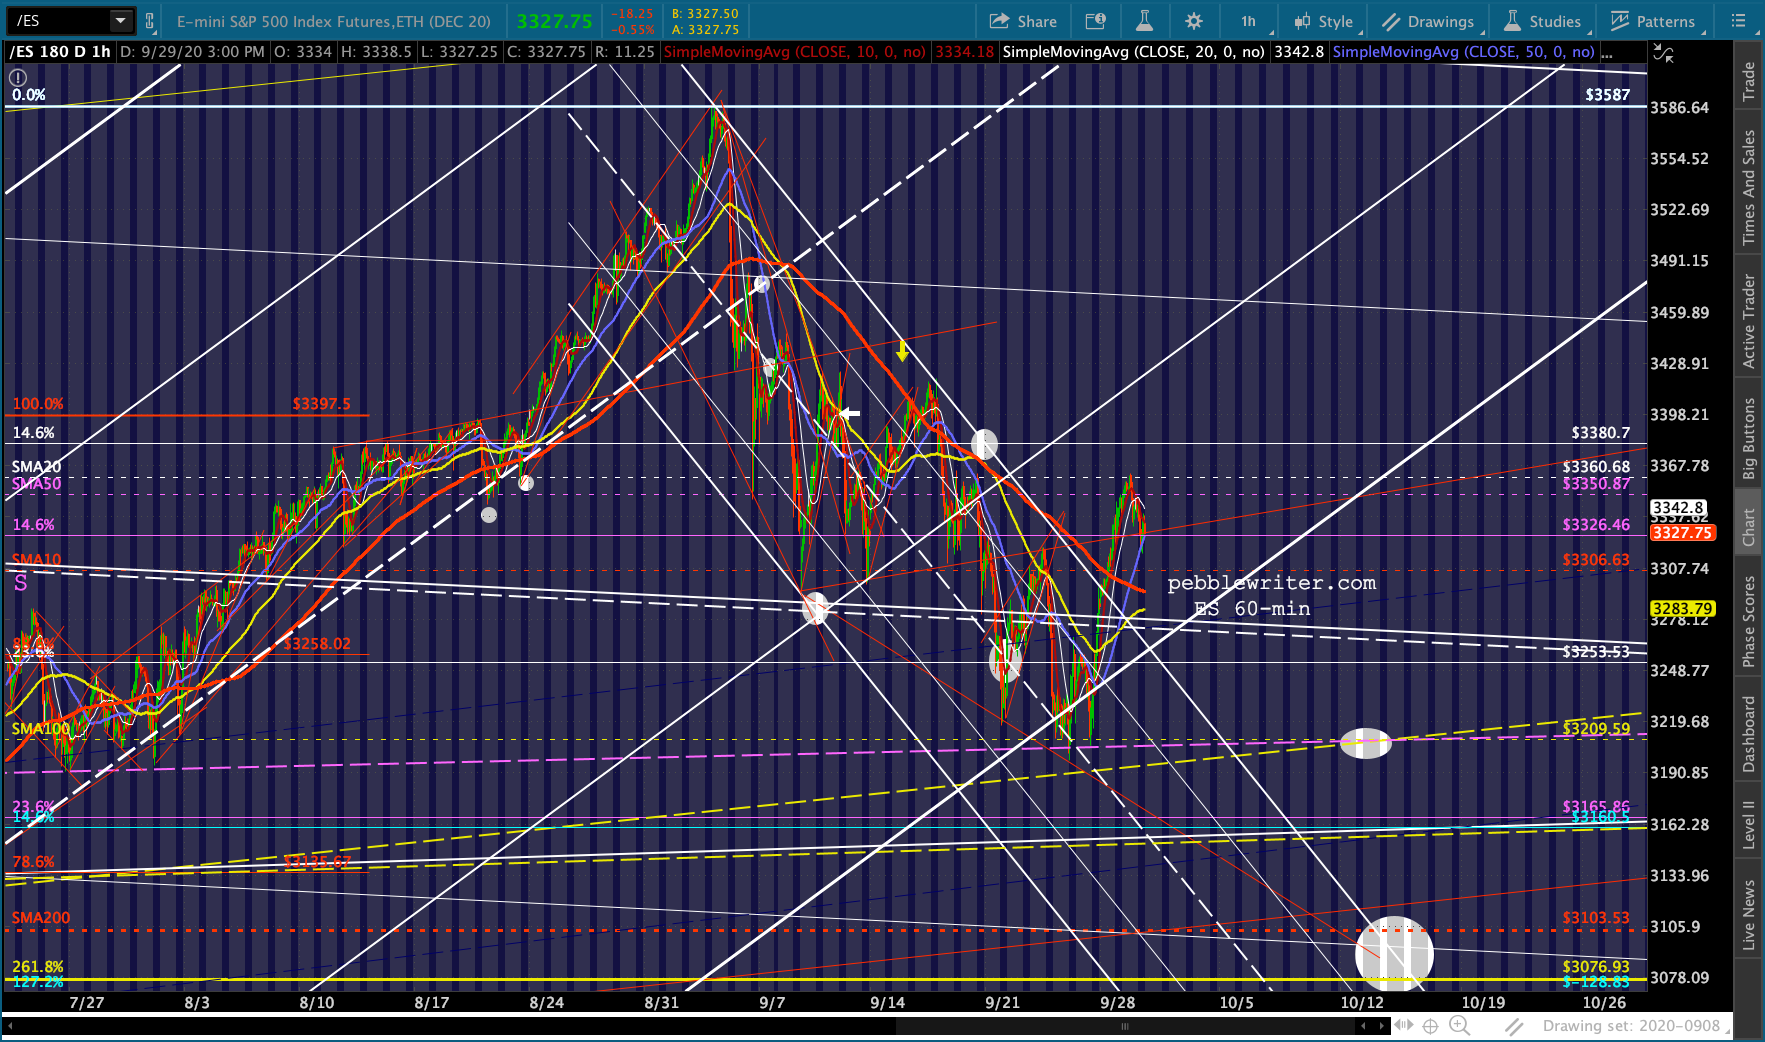
 Note that DXY is dropping more noticeably with TNX nudging it lower.
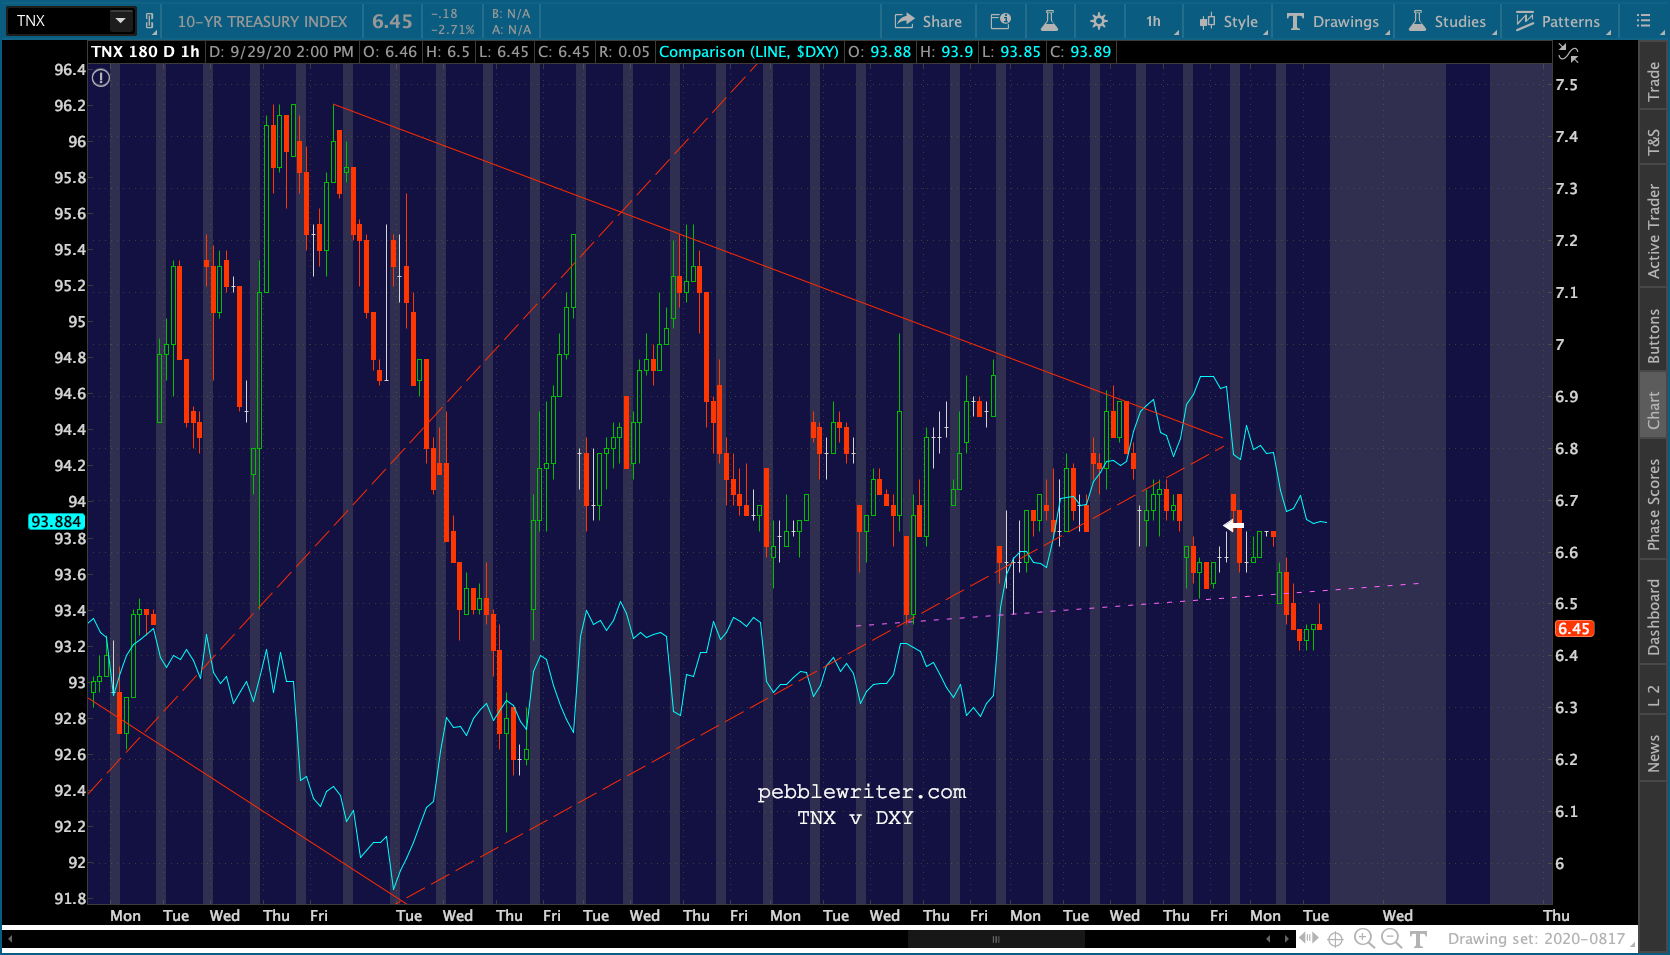
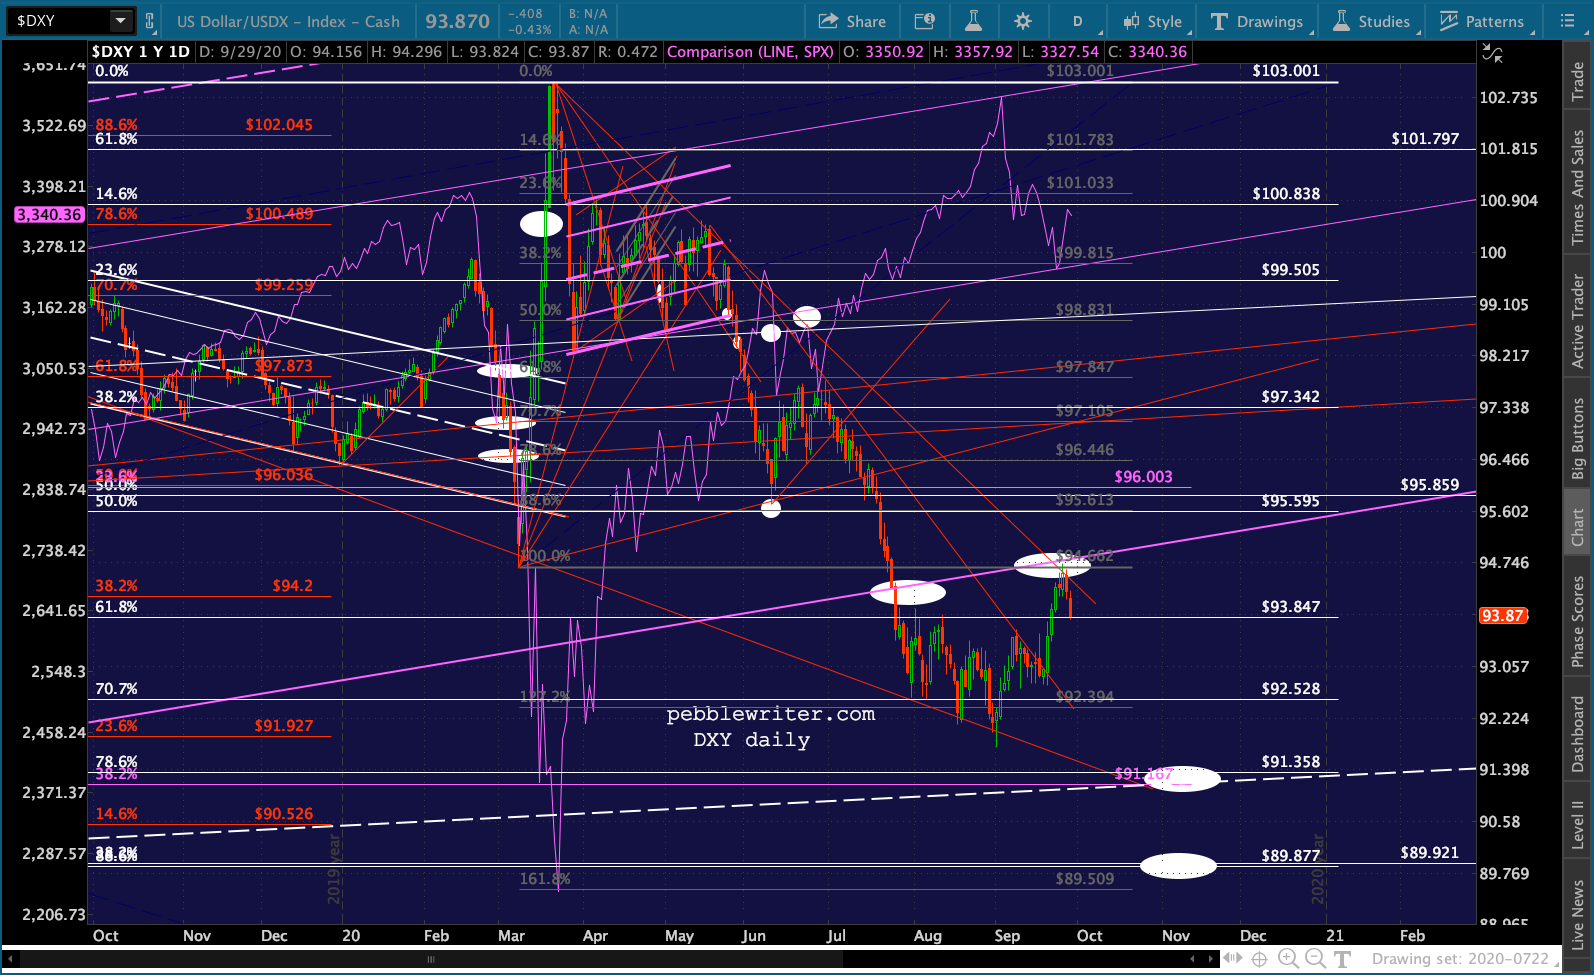 Though it’s coming almost entirely from the euro.
 SI and GC are hanging in there.
 Oil and gas are bouncing, but probably just backtesting former support.
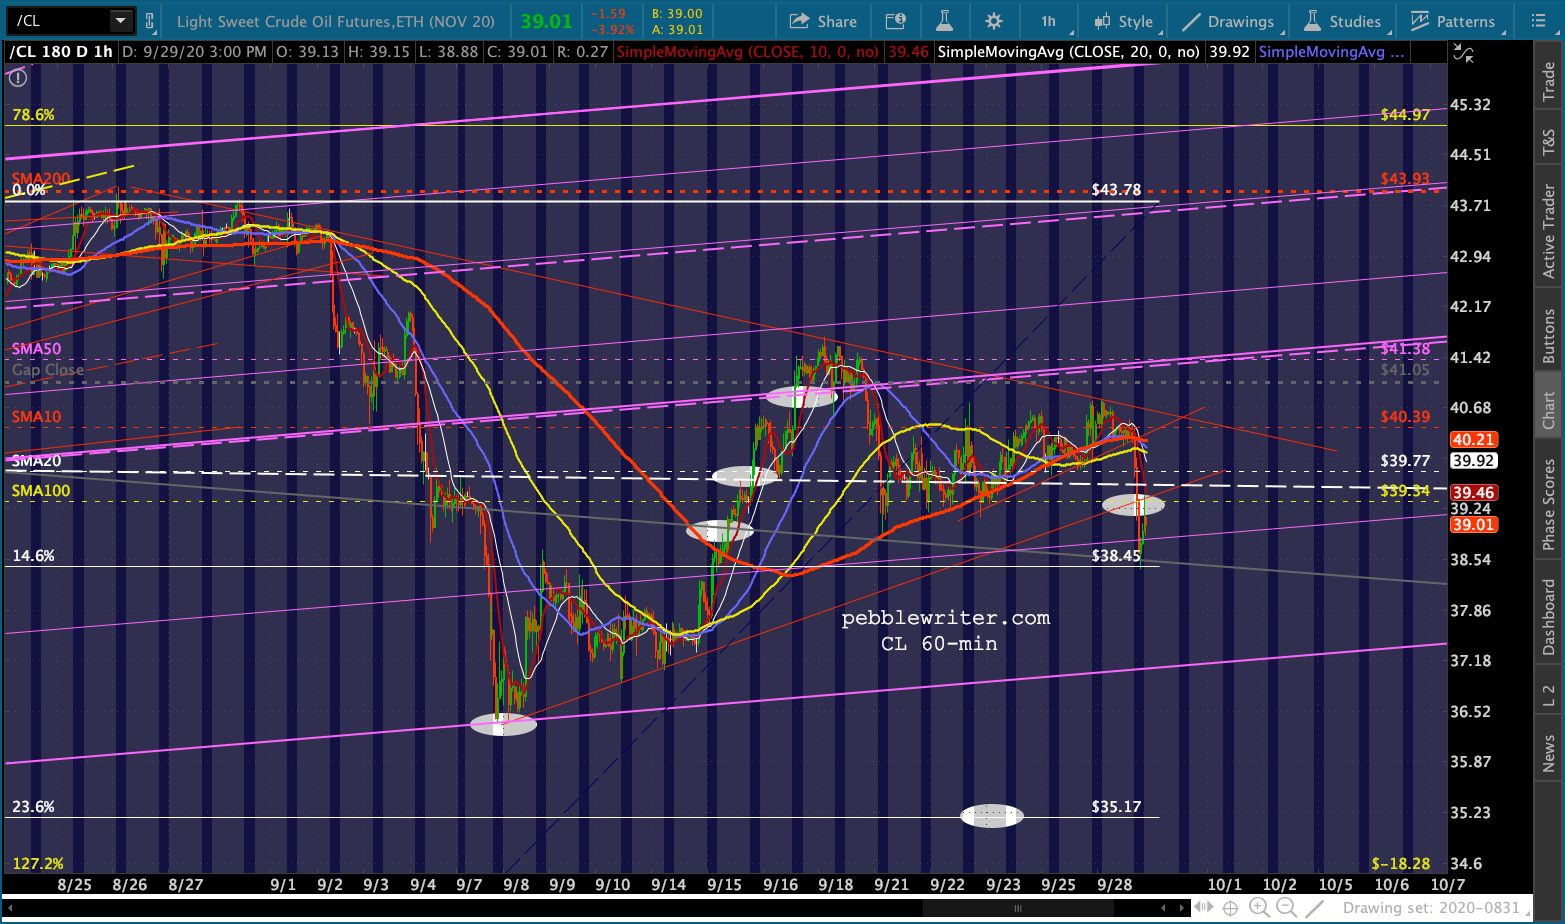
 I’m looking forward to the debate tonight. Should be interesting!